HAL Id: hal-01681629
https://hal.archives-ouvertes.fr/hal-01681629
Submitted on 4 May 2018
HAL is a multi-disciplinary open access archive for the deposit and dissemination of sci-entific research documents, whether they are pub-lished or not. The documents may come from teaching and research institutions in France or
L’archive ouverte pluridisciplinaire HAL, est destinée au dépôt et à la diffusion de documents scientifiques de niveau recherche, publiés ou non, émanant des établissements d’enseignement et de recherche français ou étrangers, des laboratoires
Patterns and dynamics of European vegetation change
over the last 15,000 years
Thomas Giesecke, Simon Brewer, Walter Finsinger, Michelle Leydet, Richard
H. W. Bradshaw
To cite this version:
Thomas Giesecke, Simon Brewer, Walter Finsinger, Michelle Leydet, Richard H. W. Bradshaw. Pat-terns and dynamics of European vegetation change over the last 15,000 years. Journal of Biogeography, Wiley, 2017, 44 (7), pp.1441-1456. �10.1111/jbi.12974�. �hal-01681629�
Patterns and dynamics of European vegetation change over the last 15,000 years
Thomas Giesecke1,*, Simon Brewer2, Walter Finsinger3, Michelle Leydet4 and Richard H.W. Bradshaw5
1
Department of Palynology and Climate Dynamics, Albrecht-von-Haller-Institute for Plant Sciences, University of Göttingen, Untere Karspüle 2, 37073 Göttingen, Germany,
2
Department of Geography, University of Utah, 260 S. Central Campus Drive, Salt Lake City, UT 84119, USA,
3
Palaeoecology, ISEM (UMR 5554 CNRS/ UM/EPHE), Place E. Bataillon, 34095 Montpellier, France,
4
IMBE-CNRS, Aix-Marseille Universite, IRD, Avignon Universite, Technopole Arbois-Mediterranee, Bat. Villemin – BP 80, F-13545 Aix-en-Provence Cedex 04, France, 5School of Environmental Sciences, University of Liverpool, Liverpool L69 7ZT, UK
*Correspondence: Thomas Giesecke, Department of Palynology and Climate Dynamics, Albrecht-von-Haller-Institute for Plant Sciences, University of Göttingen, Untere Karspüle 2, 37073
Göttingen, Germany. E-mail: thomas.giesecke@biologie. uni-goettingen.de
Abstract
Aim Palaeoecological reconstructions document past vegetation change, with estimates of fast shifts in species distributions. The resulting rates of plant spread are often not matched by model simulations of climate-driven vegetation dynamics. Genetic surveys of extant plant populations document directions of the post-glacial spread of trees, challenging traditional interpretations. Our aim is to examine an updated continental pollen data set from Europe in the light of the new ideas about vegetation dynamics emerging from genetic research and vegetation modelling studies.
Location Europe.
Methods We use pollen data from the European Pollen Database (EPD) to construct interpolated maps of pollen percentages documenting changes in the distribution and abundance of major plant genera and the grass family in Europe over the last 15,000 years.
Results Our analyses confirm high rates of post-glacial spread with at least 1000 m year 1 for Corylus, Ulmus and Alnus and average rates of m year 1 for Tilia, Quercus, Fagus and Carpinus. The late Holocene expansions of Picea and Fagus populations in many European regions cannot be explained by migrational lag. Both taxa shift their population centres towards the Atlantic coast suggesting that climate may have played a role in the timing of their expansions. The slowest rates of spread were reconstructed for Abies.
Main conclusions The calculated rates of post-glacial plant spread are higher in Europe than those from North America, which may be due to more rapid shifts in climate mediated by the Gulf
Stream and westerly winds. Late Holocene anthropogenic land use practices in Europe had major effects on individual taxa, which in combination with climate change contributed to shifts in areas of abundance and dominance. The high rates of spread calculated from the European pollen data are consistent with rapid tracking of early Holocene climate change by common tree species, documenting that plants can spread fast tracing their climate space, regardless of their dispersal strategy.
Keywords Europe, global warming, migrational lag, pollen, post-glacial, spread of trees, EPD
Introduction
The pace of human-induced global warming is forecast to rival the rates of change associated with natural transitions from glacial to interglacial periods (Diffenbaugh & Field, 2013) and the ability of plants to respond remains one of the greatest uncertainties about the impact of global warming on vegetation (e.g. Svenning & Sandel, 2013). The rate of shifting bioclimatic envelopes may not be met by the spread of plants causing a risk for their extinction (Ohlemüller et al., 2006).
The spread of plants after the last glaciation provides examples of how plants altered their ranges and abundance in response to climate change, which has been researched and discussed for more than a century. Reid (1899) showed that the distance covered by Quercus during post-glacial recolonization of the British Isles was too large to be achieved by passive seed dispersal alone. Skellam (1951) demonstrated this paradox using a diffusion model connecting population growth with the rate of spread, confirming the importance of long-distance dispersal (LDD; Clark, 1998). LDD events are more frequent over shorter distances, but exceptional chance events over large distances do occur (Nathan, 2006). The time required for trees and shrubs to produce seed and the number and size of propagules should also impose limits on the rate of spread. Consequently, there should be intrinsic species-specific maximum rates of spread determining how fast plants can shift their ranges in response to climate change.
Limits on post-glacial spread considered a century ago (see discussions in Firbas, 1949) led to the interpretation that the intrinsic rate of spread and distance from Last Glacial Maximum (LGM) distributions could explain the sequential appearance of taxa in Europe (Bertsch, 1940). The delayed arrival of taxa to a region with presumed suitable climate was later described as ‘migrational lag’ (e.g. Huntley & Webb, 1989). However, the alternative dynamic equilibrium hypothesis explains the appearance of taxa and their population expansion as direct reactions to climate (von Post, 1924; Rudolph, 1930; Godwin, 1975) with lags of < 1.5 ka (Prentice et al., 1991). Pollen-based climate reconstructions (e.g. Bartlein et al., 2011) imply the validity of the dynamic equilibrium hypothesis. Nevertheless, the migrational lag hypothesis is often cited as the major factor explaining, for example the late arrival of Fagus and its apparent continued spread to fill its climatic range (Lang, 1994). Svenning & Skov (2004) used species distribution models to show that most European trees have not yet filled their current potential ranges, suggesting that the post-glacial northward spread of trees is still active and partly determines current tree distributions and diversity gradients (Svenning et al., 2008). This emphasises migrational lag as an important factor in past vegetation change and revives the debate about whether intrinsic, species-specific
dispersal properties can explain the sequential appearance and dominance of major trees in Europe.
Pollen analysis is powerful for documenting regional abundance changes in anemophilous trees once they have reached densities higher than possibly one tree per hectare (Bennett, 1986). Huntley & Birks (1983) mapped pollen data across Europe using high abundance thresholds and estimated maximum rates of spread for common European trees between 300 and 2000 m year-1. These high rates of spread were difficult to reconcile with simulations using observed seed
dispersal distances that result in much lower rates (e.g. Meier et al., 2012; Feurdean et al., 2013; Snell et al., 2014).
Lower rates of spread are obtained by assuming the spread originated from populations surviving the LGM further north than previously estimated (Stewart & Lister, 2001). This view is supported by finds indicating the occurrence of temperate trees in central-eastern Europe just before the LGM (Willis & van Andel, 2004), whereas Tzedakis et al. (2013) discussed that these may not have survived the LGM, advocating the absence of temperate trees in Europe north of 45° N. The time between the end of the coldest phase of the last glaciation and the onset of the Holocene may have allowed small outposts of temperate trees to establish far to the north of their LGM distributions, as was first suggested by Rudolph (1930). Feurdean et al. (2013) considered more northern LGM distributions, assumed that northward spread started with Lateglacial climate warming and ended with the arrival of trees at their current or maximum Holocene northern limit. These assumptions led to much lower overall rates of post-glacial spread between 60 and 260 m year 1 and suggested that the earlier rates of Huntley & Birks (1983) could be overestimates. New insights into the post-glacial spread of plants have come from mapping genetic markers in extant populations (Hu et al., 2009). Independently dated pollen diagrams have increasingly become available with a large number stored in the European Pollen Database (EPD). Based on these sources of information we revisit the palaeoecological evidence from the European continent, 33 years after the summary by Huntley & Birks (1983). The uneven distribution of pollen diagrams hampers spatial analysis and we therefore construct interpolated maps of pollen deposition to infer past distribution and abundance of widespread European plant genera and the grass family. The aim of this study was to analyse changes in spatial patterns of plant distribution and abundance during the last 15 kyr and interpret them in the light of the new insights emerging from genetic research and modelling studies. We compare the dynamics and rate of the post-glacial spread and abundance changes in the dominant European tree genera. Our analyses provide a basis for comparative studies with vegetation model experiments.
Materials and methods Study area
Interpolated maps were based on pollen data from the EPD. Sites beyond the European continent but included in the EPD were ignored. European islands without publicly available data were also excluded. Because the distribution of sites becomes increasingly sparse to the east, we limited the analysis to west of a line from the Black Sea to the White Sea. Pollen abundances were
interpolated to a 0.5° grid. Data
We used publicly available EPD sites with associated chronologies based on Giesecke et al. (2014), resulting in about 780 locations within or close to the study area contributing to the
interpolations. All ages are given as calibrated years before present, where ‘present’ equals the year 1950 Anno Domini (ad). Sample selection is identical to the set used for mapping abundance changes at individual sites (Brewer et al., 2016) with age uncertainties of less than 500 years and extrapolations of < 2000 years (Giesecke et al., 2014). Pollen counts were converted to
percentages based on all terrestrial pollen taxa, excluding Cyperaceae, wetland and aquatic plants, fern and moss spores. Samples were collated into consecutive year bins centred on full 500-year intervals between 0 and 15 ka. The values were averaged over all samples where more than one sample per site fell within one bin. The available information differs between time slices, with fewer sites available prior to the Holocene (Giesecke et al., 2014).
Interpolation and classification
Long-distance transport, erosion and redeposition of pollen grains bias the interpretation of small pollen proportions regarding the regional occurrence of the parent tree. To reduce this bias we designed threshold values (Tint, Table 1) and interpolated percentages above the threshold using
the tricube distance-weighting function (Cleveland & Devlin, 1988; Huntley et al., 1989) with a horizontal search limit of 300 km radius and a vertical threshold of 500 m. Horizontal and elevation differences between grid cells and pollen diagrams are used as covariates, making the procedure well suited for continental interpolations of pollen data with an uneven spatial coverage (e.g. Williams et al., 2004). The inclusion of elevation limits the propagation of
abundance information from a mountainous area into the neighbouring lowlands. Nevertheless, in the case of the Fagus distribution in the north of the Iberian Peninsula it was necessary to
manually restrict the extrapolation towards the south, which was done by introducing pseudo-absences from non-existent sites with 0% Fagus pollen.
Acknowledging the many uncertainties in the resulting interpolation, we restrict the mapping and subsequent analysis to four abundance classes capturing the main differences in the abundance of the parent plants (Table 1). The lowest class is designed to approximate the regional presence of the taxon, whereas the highest abundance class was chosen to represent the area within which a species is regionally dominant or characteristic. We determined the threshold values in
comparisons between interpolations of modern samples (1700–2010 ad) and species
distributional maps and abundance information. The two remaining abundance classes were set to intermediate values with class two representing a more conservative threshold for presence and class three indicating increased abundance. The threshold for presence on the interpolated surface (T1) was necessary to restrict distributions in data-sparse areas. No presence threshold was set for Poaceae because taxa of this family are presumed to occur everywhere in Europe and only changes in abundance through time and space are informative. Pinus and Betula are prolific pollen producers and their northern limit occurs in a landscape of low total pollen production. It is therefore impossible to find pollen percentage thresholds that would adequately describe their northern limits and thresholds were chosen to describe their southern boundaries (Lisitsyna et al., 2011). As a consequence, rates of spread cannot be obtained for these genera based on this analysis. The results of the interpolations are provided as supplementary information (https://doi.pangaea.de/10.1594/PANGAEA.865121).
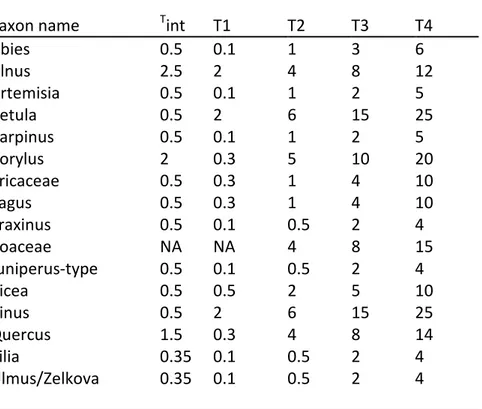
Table 1 Pollen percentage thresholds. The threshold Tint is applied before the interpolation
procedure. Thresholds T1 to T4 are the lower limit of the four abundance classes applied to the results of the interpolation.
Taxon name Tint T1 T2 T3 T4
Abies 0.5 0.1 1 3 6 Alnus 2.5 2 4 8 12 Artemisia 0.5 0.1 1 2 5 Betula 0.5 2 6 15 25 Carpinus 0.5 0.1 1 2 5 Corylus 2 0.3 5 10 20 Ericaceae 0.5 0.3 1 4 10 Fagus 0.5 0.3 1 4 10 Fraxinus 0.5 0.1 0.5 2 4 Poaceae NA NA 4 8 15 Juniperus-type 0.5 0.1 0.5 2 4 Picea 0.5 0.5 2 5 10 Pinus 0.5 2 6 15 25 Quercus 1.5 0.3 4 8 14 Tilia 0.35 0.1 0.5 2 4 Ulmus/Zelkova 0.35 0.1 0.5 2 4
Change in area and rate of spread
We adjusted for the latitudinal reduction in area represented by grid cells. Area calculations of lower abundance classes include higher abundances. The general position of inferred distributions and abundance classes was compared with the distance to the Mediterranean and Atlantic coasts by computing the distance for all grid cells and summing all values from grid cells with the
respective abundance class.
We restricted the analysis of the dynamics of spread to the nine common arboreal taxa for which the northern distributional limits may be approximated by the pollen percentage thresholds adopted here. We limited the study area to north of 47° N latitude, which is outside the location of possible LGM distributions for the analysed tree taxa with the exception of Picea (Tzedakis et al., 2013). For this northern half of Europe, we fitted the logistic function to the increase in the area of presence with time and estimated the inflection point, the point at which the initial exponential increase in area starts to slow. We estimated rates of overall spread (V) and area-doubling times for all abundance classes, using a simple model of reaction diffusion V = 2(kD)1/2, where k is the intrinsic rate of population growth and D the diffusion coefficient (Birks, 1989). The slope of the square root of area increase over time is an estimate of (kD)1/2 yielding V for the time from the appearance of a taxon with the respective abundance class, until the time when maximum values were reached. The area-doubling time was estimated as ln(2)/r based on a logistic model, where the growth rate r was determined as the slope of the regression between the decadal logarithm of (K N)/N versus time t, with N as the area at time t and K as the carrying capacity set to the
We used a more detailed configuration as a starting point for assessing the dynamics of post-glacial spread (Fig. 1). The limits were moved north in eastern Europe to avoid large initial
dispersal jumps in data poor areas. Prior to calculations, we manually removed the appearance of isolated small occurrences that subsequently disappeared, whereas considering disjointed
dispersal jumps growing into larger areas and/or higher abundance classes. This resulted in connected areas of distribution as the basis for analysis and this requirement is the reason why higher abundance classes, which often have disjoint areas, were not considered. Rates of spread were obtained as the shortest geographical distance between the centres of grid cells marking the distributional limits in two consecutive time slices and dividing the value by 0.5 ka. This yields rates of spread in all directions, however, as the analysis was restricted to the area north of the Alps, changes in the southern limits were not considered. We also computed the distance of the northward shift of the 95 percentile of the distributions, with respect to distance to the
Mediterranean Sea, using the initial set of taxa and based on the entire area represented by the maps.
Difference maps and dynamics of change
For each grid-cell, we calculated the differences in interpolated pollen proportions between two consecutive time slices and classified the results into four classes of increase and decrease, with one class of no change. Thresholds were obtained per taxon as the standard deviations (SD) of all values over all time slices. The value of zero was assigned to grid cells with <1 SD difference, whereas maximum and minimum values of 4 and 4 were assigned to differences larger than 4 SD. The resulting maps are provided as supplementary information
(https://doi.pangaea.de/10.1594/PAN GAEA.865119).
We visualized these changes by multiplying the numeric value (4 to 4) of each class with the area represented by grid cells assigned to this class. The resulting values were summed over all grid cells per time slice to obtain an index for the dynamics (area 9 amount of change). This was carried out separately for northern and southern Europe with the division at 47° N latitude.
All interpolations and analyses were carried out in R (R Core Team, 2016) using the packages ncdf (Pierce, 2014) and raster (Hijmans, 2015).
Results and interpretations
The Lateglacial vegetation in Europe was dominated by herbaceous vegetation types with
abundant Poaceae and Artemisia as well as scrublands with Juniperus and Betula nana and boreal woodlands with Pinus and Betula trees. During the Lateglacial the latitudinal tree line formed in central Europe (Theuerkauf & Joosten, 2012; Mortensen et al., 2014), and reached a more northerly position to the east of the Baltic Ice Lake (Amon et al., 2014). However, this tree line consisting of Pinus and Betula is not adequately represented in the maps (see methods) resulting in biases in their Lateglacial distribution. This problem does not occur for Picea, which was most likely part of the latitudinal tree line east of the Baltic Ice Lake during the Younger Dryas (Heikkila et al., 2009) and elsewhere during the early Holocene (Giesecke & Bennett, 2004).
The effect of the Bølling-Allerød warming and Younger Dryas cooling can be seen in the area of occurrence and/or abundance of some taxa (e.g. Artemisia, Juniperus, Ulmus), although the 500-year time slices can only weakly resolve the impact of these climate fluctuations (Fig. 2, see
Appendix S1.1 in Supporting Information). The 12 ka time slice represents the situation just before the onset of Holocene warming at 11.7 ka (Rasmussen et al., 2014), however, due to age
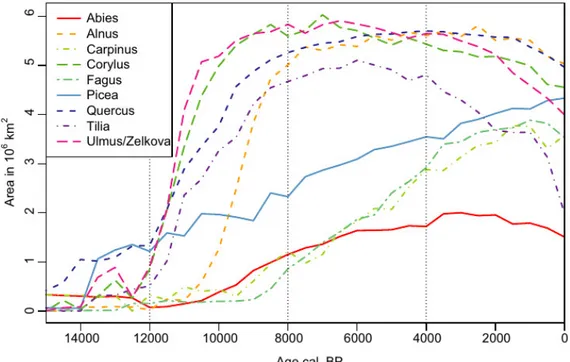
uncertainty and the 500-year wide sampling window, some initial expansion may already be included. The onset of the Holocene warming set the clear starting point for the expansion in area and abundance of many temperate woody taxa at the European scale. Ulmus and Corylus followed by Quercus and Tilia filled most of their current distributional area within 2 kyr from the onset of the Holocene (Fig. 2). Conversely, Fagus and Carpinus had hardly any response to the onset of the Holocene. They showed a gradual increase in area that only starts after 9 ka and which continues almost to the present. Picea and Ericaceae had similar trends of steady increase through the Holocene. Alnus and Abies showed intermediate patterns with late starting area expansions that stopped in the mid-Holocene.
Figure 1 Study area of Europe restricted towards the east in a line from the Black to the White Sea. The red line marks the starting point for the evaluation of the rate of spread ignoring the regions to the south as here species may have survived the last ice age so that patterns are more difficult to interpret and site density is lower, leading to additional biases. The broken line marks 47° N latitude, which was used as a limit to contrast the dynamics of change between northern and southern Europe.
The areas of occurrence increased through time (Fig. 2) and followed logistic models of population growth. This becomes particularly clear when limiting the analysis to Europe north of 47° N
latitude (Fig. 3). The inflection point that was estimated for these logistic increases provides a description for the timing of spread and range filling. Ulmus and Corylus slowed their exponential increase < 1 ka after the onset of the Holocene at around 11.2 and 11.1 ka respectively. Tilia and Quercus followed at 10.3 and 10.1 ka, whereas Alnus started to spread late but rapidly reached the inflection point at 9.5 ka. Picea survived the LGM north of 47° N latitude and its increase in apparent area of occurrence was gradual without a strong sigmoidal shape. The age of inflection point at 6.7 ka characterizes its mid-Holocene expansion. Abies started spreading north of the Alps around 9 ka and slowed its increase in area at around 5.9 ka. Fagus and Carpinus started to slow their spread at 4.9 and 4.8 ka respectively.
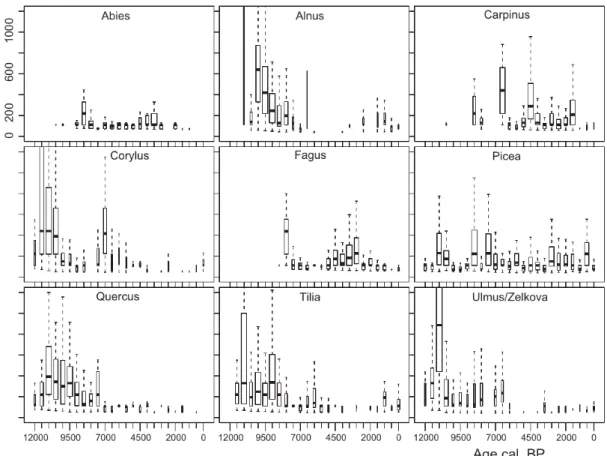
Distributions did not shift evenly, but some edges spread faster than others resulting in a range of values (Fig. 4). The box plots and the northward movement of the 95-percentile of distributions for the different abundance classes (see Appendix S1.7) show that the fastest rates of spread were reached during the early Holocene. For Ulmus the uppermost quantile (Fig. 4 beyond plot margin) ranges between 3000 and 1600 m year 1 for the time between 11.5 and 11 ka and the
95-percentile shifted over this time by about 1000 km for the first and second abundance classes, which converts to a velocity of 2000 m year 1. The northward range shift of Ulmus was
concentrated in one 500-year interval, whereas the rapid spread of Corylus, Tilia and Quercus had a longer duration, with average values around 400 m year 1. Nevertheless, the uppermost quantile of the Corylus boxplot for 12–11.5 ka ranges between 1300 and 2800 m year 1 (Fig. 4 beyond plot margin). The late-spreading taxa Fagus and Carpinus started with an initial rapid spread with apparent rates around 400 m year 1, whereas the later spread occurred generally at slower speed, and only Carpinus shows a sudden increase in higher abundance classes around 2 ka.
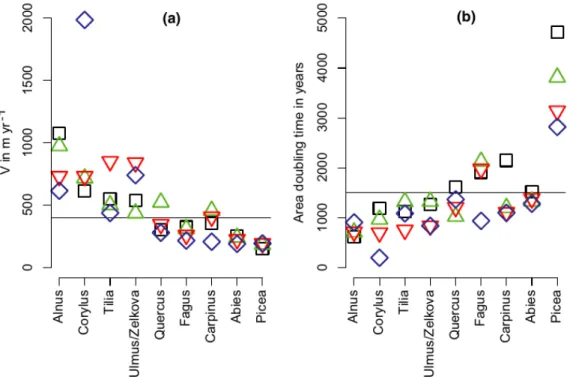
The overall rates of spread presented in Fig. 5(a) assume the rate of spread to be constant through time, which was not the case. The highest rate of spread for the entire distribution is estimated for Alnus with 1000 m year 1, whereas the estimates for most other taxa fall between 600 m year 1 for Corylus and 250 m year 1 for Abies and are thus comparable to average rates in Fig. 4. Only the gradual increase in the distribution of Picea resulted in a slow rate of 150 m year-1. The fastest rate of spread recorded is for the highest abundance class of Corylus, caused by the rapid and often synchronous population increase in Corylus across large areas of Europe (Giesecke et al., 2011). The logistic growth model used in the calculation of the area-doubling time (Fig. 5b) compensates for the saturation phase that reduces the slope in the overall estimate of spread in Fig. 5(a). This results in differences in the rank order, which are most pronounced for Fagus and Carpinus. The three higher abundance classes in Carpinus and the highest abundance class in Fagus have doubling times similar to early spreading taxa like Tilia and Ulmus.
Figure 2 Post-glacial changes in area of occurrence for the most common European tree taxa based on interpolation and classification of pollen percentages.
Figure 3 Fitted logistic functions to the increase in area of occurrence in Europe north of 47° N latitude as estimated from interpolation and interpretation of pollen percentages. The inflection point, where the exponential increase starts slowing down, is marked by the vertical line and its age given below the taxon name. Taxa are grouped according to the timing of the area expansion and differences in overall area.
The good agreement between the estimates of overall spread (Fig. 5a) based on different
abundance classes is remarkable. Early Holocene rapidly spreading taxa Alnus, Corylus, Ulmus and Tilia showed values above 400 m year 1 for all abundance classes. Quercus takes an intermediate position. Its post-glacial spread north started early, whereas the expansion at the northern limits in Sweden lasted until about 3 ka (e.g. Giesecke, 2005b). Picea clearly is the slowest in its overall dynamics, which is partly due to the fact that this analysis focuses on its Holocene dynamics, whereas its area of occurrence was already large during the Lateglacial. The tree was likely
widespread in Europe during the coldest stages of the last glacial (Ravazzi, 2002) and its Lateglacial history remains a focus of study and debate (Birks et al., 2012). The position of Abies differs
between the panels in Fig. 5, with the overall rate of spread for all abundance classes being similar to Picea, whereas the doubling time for the first abundance class is close to that for Quercus. The obtained doubling times describe the Holocene dynamics of distributions and their use to estimate the size of the LGM distributions by extrapolation may not be appropriate here (Magri, 2008). However, they indicate that the taxa must have been widespread in the southern half of Europe during the LGM.
The Holocene vegetation history of Europe also provides examples of declines in distribution and abundance. The overall area of occurrence contracted along the northern limits of Corylus, Ulmus, Tilia and Quercus during the last 4 kyr. However, the decline in the area of occurrence is also due to a reduction in abundance below what can be recognized using the applied percentage
thresholds. This is the main reason for the strong decline in Tilia (see Appendix S1.1). The area curves for higher abundance classes document these shifts in the abundance of different species
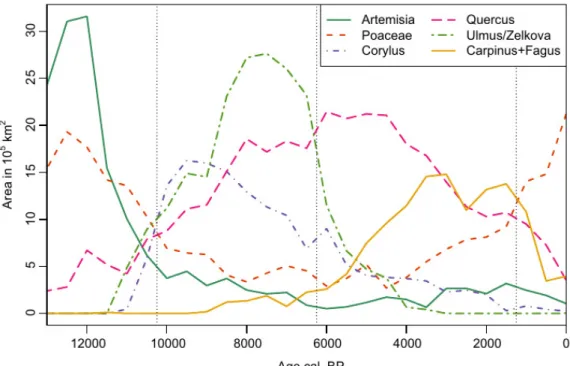
across Europe. Curves for the highest abundance class show distinct peaks, some of which replace each other and thus characterize the different phases of European vegetation history (Fig. 6; see also Appendix S1.2). The 16 taxa considered here reach their largest area of the highest
abundance class in the following order: Poaceae (15 ka), Juniperus-type (15 ka), Artemisia (12 ka), Betula (10.5 ka), Corylus (9.5 ka), Pinus (8.5 ka), Ulmus/Zelkova (7.5 ka), Fraxinus (7.5 ka), Tilia (6.5 ka), Quercus (6 ka), Abies (5.5 ka), Alnus (4 ka), Carpinus (3.5 ka), Fagus (3 ka), Picea (1.5 ka), Ericaceae (0.5 ka). These peaks mark in most cases the culmination of the expansion phase and are succeeded by a period of decline. The abundance of Ulmus and Tilia characterized many European forests between 9 and 6 ka. The pattern also clearly depicts the well described decline of Ulmus, which is followed by Tilia, whereas the area of abundance rises for Fagus and Carpinus. The deforestation of Europe over the last 3.5 kyr is also clearly depicted by the increase in the area for the highest abundance class of Poaceae, with an associated decline in the area for abundant cover of Fagus, Carpinus, Tilia and Quercus.
Figure 4 Boxplots for rates of spread as obtained by the shortest distance between two grid cells marking the area of inferred occurrence in consecutive time slices. Note that the width of a box indicates the number of observations, with thin boxes indicating that distributional shifts occurred along a small section of the mapped limit. Negative shifts were ignored.
Figure 5 Assessments of the dynamics of area increase: (a) rate of overall spread estimated from the slope of the increase in square root of the area versus time, (b) area-doubling time obtained from the logistic growth model. Symbols: black square = class 1, green triangle = class 2, red triangle point down = class 3, blue diamond = class 4. Taxa are ordered according to their overall rates of spread and doubling time. Horizontal lines separate rapidly expanding taxa.
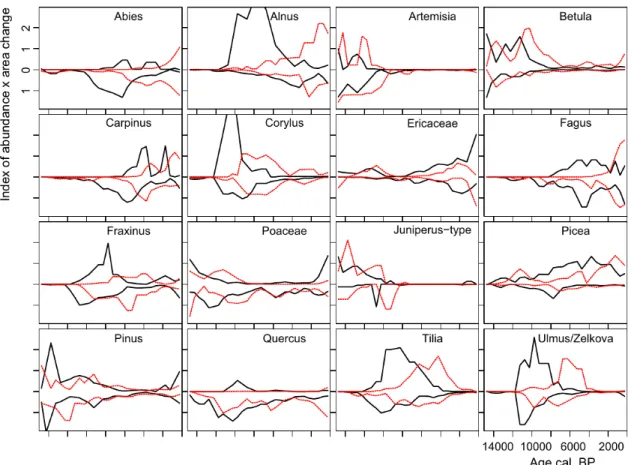
The change in area and abundance for each taxon between two time slices is presented in the difference maps (https://d oi.pangaea.de/10.1594/PANGAEA.865119) and these changes, summarized in one index (difference class multiplied by area) are presented in Fig. 7. This
comparison shows large symmetry in population expansion and decline between north and south. Some species show more change in the north (Picea) and others in the south (Abies), which is partly due to the centre of their distribution (Fig. 8). The lack of change for Quercus in northern Europe, except around 10 ka, is due to its increase and decline at low rates resulting in small differences over 500 year intervals.
Assuming temperate tree taxa survived the LGM in southern Europe, one would expect populations to start expanding there and subsequently spread northwards where population expansion would be delayed. This pattern is indeed visible for some taxa, particularly for Fraxinus and Abies where southern European dynamics clearly precede northern European changes. However, populations of Tilia and Ulmus expand almost in parallel in the south and north, with a short lead in the south. For Corylus and Alnus the change in the north appears to lead. Fagus populations have their highest rate of increase at the same time in the north and south around 5 ka. The dynamics of declining populations is mirrored for many taxa between north and south. Most symmetry in decline is visible for Corylus, whereas Ulmus declined earlier in the south compared to the north.
To follow the change in the gravitational centre of the different taxa, we calculated the average distance of grid cells within the different abundance classes to the Mediterranean Sea and Atlantic Ocean (see Appendix S1.3, S1.4 and Fig 8). In both cases the average distances for the different abundance classes are near each other for most taxa at most times, indicating that most distributions were symmetrical with higher abundance classes in the centre of the distribution.
Abundance distributions are skewed to the north for the boreal taxa Pinus and Betula, with higher abundance classes found successively further north, whereas the opposite trend is observed for Quercus with a southern affinity (see Appendix S1.3). The symmetry of distributions often deteriorated when abundances declined. For example, the decline in the abundance of Corylus after its initial peak around 9.5 ka occurred mainly in the south and east without affecting the distributional area and consequently the gravitational centre of the abundant areas shifted north and west. The curves for Picea are striking. The distance to the Mediterranean describes the tree as a southern species during the early Holocene, when populations mainly expanded in the eastern Alps and Carpathians. In the Carpathians the dominance of Picea at mid-elevation was replaced by Fagus in the second half of the Holocene (Feurdean et al., 2010), whereas the tree expanded in Fennoscandia during that time (Giesecke & Bennett, 2004). As a consequence, the mean distance to the Mediterranean shifted for higher abundance classes from southern
dominance, as for Quercus, to northern dominance as for Pinus and Betula. At the same time the average distance to the Atlantic Ocean decreased steadily though the Holocene for all abundance classes. This west-ward shift was observed and reported for the two Picea distributions in central and northern Europe separately and it is interesting to see how both distributions shifted
simultaneously (Giesecke & Bennett, 2004; van der Knaap et al., 2005). The two other latecomers Fagus and Carpinus followed the same trend, shifting the centres of their distributions from east to west with the general spread of the distribution in the same direction.
Figure 6 Post-glacial changes in area of highest abundance or dominance for the most common European tree taxa, Artemisia and Poaceae based on interpolation and classification of pollen percentages. Vertical dashed lines mark times of change
Figure 7 Dynamics of abundance change comparing Europe north and south of 47° N latitude depicted as upper and lower values from a central zero line. Solid lines indicate an increase, and dashed lines indicate a decline in area abundance.
While the gravitational centres of distributions shifted north together with the northern edges of the populations, the southern distributional limits did not move north with the early Holocene climate warming (see Appendix S1.3– S1.6). Betula is the only taxon with a slight northward shift of its southern distributional limit and higher abundance classes showed a strong northward shift of the southern limits (see Appendix S1.6).
Discussion
Spread and population expansion
We found that the rates of taxon spread slowed before northern distributional limits were reached, which is demonstrated by the logistic fits in Fig. 3. This may not just be explained by range filling, but rather be an effect of slowed population growth rates near the northern limits, where growing season warmth often limits seed production. This interpretation is supported by findings of lower population growth at higher altitudes and latitudes (McLeod & MacDonald, 1997; Giesecke, 2005a) indicating a climatic control (Prentice, 1988). It is also consistent with a close link between population growth and rate of spread.
The observation that different abundance classes yield similar overall rates of spread (Fig. 5a) agrees with a simple diffusion model predicting that the speed of the wave can be obtained regardless of the population threshold applied (Lubina & Levin, 1988). This would suggest that the wave is stable in space and even though the wave ‘front’ cannot be captured by palaeoecological
methods (Bennett, 1986), the rate of spread may be obtained from higher abundance classes, where spread is followed by population expansion. A travelling wave of expanding populations has been described for Fagus in North America (Woods & Davis, 1989) and Picea in Scandinavia
(Giesecke, 2005a) and appears to be the rule rather than the exception, even where spread and population expansion may have been disconnected, as in the case of Picea (Giesecke, 2013). This disconnect is a feature of late expanding taxa, and both Picea and Fagus provide some of the best examples for Europe. The mapping of genetic markers in extant Picea populations in
Fennoscandia, Russia and the Baltic states documents strong links between the populations in southern Sweden and in the Baltic states as well as between northern Sweden and northern Russia (Tollefsrud et al., 2009). Macro-fossil evidence of Picea indicates that the tree occurred on the Scandinavian Peninsula soon after deglaciation (Kullman, 2008). On the other hand, pollen data documenting the time of population expansion show a clear wave of expanding populations travelling north-west from southern Finland, crossing the northern extent of the Baltic Sea and then turning south-west into southern Sweden (Giesecke & Bennett, 2004). Thus it seems that the expansion of populations, documented by rising pollen proportions, occurred independently of and in a different pattern to the initial spread of the species. The existence of a Picea haplotype occurring only on the Scandinavian Peninsula (Parducci et al., 2012) supports this interpretation, documenting that the initial spread, which left a genetic imprint in populations, and the later population expansion are decoupled.
Figure 8 The average distance of areas assigned to different abundance classes to the modern coast of the
Mediterranean and the Atlantic respectively. Lower abundance classes include the area of higher abundance classes. The dotted line represents the average for the analysed area. Colour codes: black = class 1, green = class 2, red =
Genetic markers in extant populations confirm earlier claims that Fagus survived the LGM on the Iberian Peninsula (Magri et al., 2006) and possibly also in south-western France (de Lafontaine et al., 2014), yet these areas contributed little to the post-glacial colonization of Europe.
Similarly, the populations on the Apennine and Balkan peninsulas did not contribute to the post-glacial spread of the tree. The dominance of central and north-western Europe by a single chloroplast haplotype is in sharp contrast with the high haplotype diversity of the southern edge of the distribution in northern Greece (Magri et al., 2006). The simulations by Saltre et al. (2013) illustrate how the expansion from a more northerly population may block the northward spread from populations in the south. However, we found that Fagus populations on the Balkan and Iberian Peninsulas remained small until the mid-Holocene and grew in parallel with the
populations in central Europe (Fig. 7; Giesecke et al., 2007). Thus the LGM distribution of Fagus is not related to the time of population expansion in central and north-western Europe, as has often been postulated (e.g. Lang, 1994). Using the proposed LGM distributions as starting points to simulate the post-glacial spread of Fagus as well as Picea (Saltre et al., 2013; Lehsten et al., 2014) does therefore not help develop understanding of the post-glacial history of either species. In both cases similarities between simulated and reconstructed patterns may be accidental, and although we have not yet understood why these two species spread late, our findings do not indicate that the time of population expansion can be explained by migrational lag. Vegetation models that can describe the spread of plants mechanistically are useful as they can test the importance of
particular components like interannual variability (Nabel et al., 2013), but the models need further improvement before they can provide convincing estimates of the consequence of global warming for vegetation (Snell et al., 2014). The patterns and rates presented here can be used to test these models, but care is needed in the selection of suitable taxa. Modelling the post-glacial colonization of Europe would certainly be useful for Quercus, but is of less value for Picea and Fagus without a better understanding of their early Holocene controls.
Genetic markers in Quercus document that many populations from around the Mediterranean Basin have spread north with post-glacial warming (Petit et al., 2002), yet these immigration routes find no reflection in a differentiated time of initial population expansion (Brewer et al., 2002; Giesecke, 2016). High-resolution mapping of haplotypes in extant white oak populations in western France highlights the importance of frequent LDD events, which could explain the observed patchwork of distinct haplotypes of chloroplast DNA markers (Petit et al., 1997).
Simulations using this example also link the frequency of LDD to population density (Bialozyt et al., 2006).
Comparisons between Europe and North America
Estimated rates of post-glacial spread of woody taxa in eastern North America are nearly always lower than the rates discussed here, regardless of the method. Davis (1976) published the first rates of spread based on independently dated pollen diagrams and used the increase in pollen accumulation rates as indication for the local arrival of a taxon. Based on a limited set of sites, she obtained rates between 350–500m year 1 for Pinus banksiana/resinosa and 100 m year 1 for Castanea (Davis, 1976). Delcourt & Delcourt (1987) used a modern data set to interpret the regional arrival of a taxon to produce isochrone maps and evaluate the spread of woody plants along five different north–south tracks. They obtained average rates of spread between 287 m year 1 for Salix and 70 m year 1 for Nyssa, including individual maximal dispersal jumps of 1044 m
year 1 for Tsuga and 753 m year 1 for Tilia. Highest rates of spread were observed between 17 and 13.8 ka and thus much earlier compared to Europe, although also at lower latitudes. Ritchie MacDonald (1986) presented a study with the highest rates of spread in North America, for the spread of Picea glauca from south-central Alberta to the Mackenzie Delta with rates of 2000 m year 1, whereas they reported rates of 2–300 m year 1 in other regions. The apparently high rates in the western interior may, however, result from an eastward spread of populations that survived the ice age in Alaska (Anderson et al., 2006). Ordonez & Williams (2013) used well-dated pollen diagrams to model past species distributions using simulated past climate. Core distributions moved northwards at maximal mean velocities of 188 m year 1 for Abies and 153 m year 1 for Alnus during 12–10 ka.
In North America the distributional shifts of the southern boundaries occurred at similar rates (Ordonez & Williams, 2013). In Europe, the position of most rear-edge distributions had not changed significantly during the last 15 kyr, except perhaps for Betula which declined in abundance at its southern distributional limits in Italy during the early Holocene (Magri et al., 2015). All other boreal and temperate trees and shrubs remain present in southern European mountains. Pinus sylvestris for example dominates the northern boreal forest in Scandinavia and grows at or near the tree line on mountains in Spain, Greece and northern Italy. Bennett et al. (1991) speculated that the southern edge of the distributions of the European woody flora was maintained in these southern European mountains through glacial–interglacial cycles. It may also be argued for North America that the southern distributional limits for temperate species have not significantly moved north (Bennett et al., 1991), however, here temperate trees may have
survived close to the ice margin that extended much further south (McLachlan et al., 2005). Consequently, studies estimating rates of postglacial spread in eastern North America have considered a wide latitudinal range where the trees in question may have occurred during the LGM.
We have focused on rates of spread north of 45° N in Europe, which in eastern North America corresponds to north of the Canadian border. The northern limits of several temperate species in Europe reach 60° N, and these high northern limits are due to the Gulf Stream pumping heat to high latitudes and the westerly winds pushing it into the continent. As a consequence, January isotherms in Europe have a strong N–S component while they run predominantly east–west in eastern North America. The prevailing westerlies would also propagate rapid shifts in sea surface temperature in the north Atlantic connected to the mode of the North Atlantic Deep Water formation, such as its ‘off’ mode during the Younger Dryas (Rahmstorf, 2002). Compared to eastern North America, the rate of climate change with the onset of the Holocene was therefore most likely much higher in Europe with highest rates near the Atlantic coast (Heiri et al., 2014). Higher rates of climatic changes in Europe might explain the comparably faster apparent rates of spread and higher rates of vegetation change. The slower meltdown of the larger Laurentide ice sheet may have set a slower pace for North American climate and vegetation change during the Lateglacial and early Holocene (Shuman et al., 2002).
Human influence has rarely been discussed in the spreading of tree taxa in North America, although humans were present in the postglacial landscape and probably influenced fire regimes and cultivated crops by 3.8 ka (Smith & Yarnell, 2009). Indians may have affected regional
distributional limits of fire-sensitive hardwoods at the prairie-forest transition zone for a long time (Grimm, 1984). In contrast in Europe, there has been considerable discussion about potential
(Tinner et al., 2013), Carpinus (Ralska-Jasiewiczowa et al., 2003), Fagus (Küster, 1997) and Tilia (Turner, 1962). The effect of humans on European vegetation was particularly pronounced during the second half of the Holocene (Molinari et al., 2013) and the conversion of forest to agricultural land is clearly visible in the increase in area dominated by grasses since 4 ka (Fig. 6). The late Holocene spread of Fagus in northern Europe has almost certainly been catalysed by
anthropogenic activities (Bradshaw, 2004) which cannot be separated from a potential response to climate. It may never be known for certain if the tree would have been able to reach its current northern limits in Sweden, western Norway, Scotland and Ireland without human assistance. Genetic markers have provided supporting evidence for likely human translocation of trees such as Castanea sativa and Pinus pinea, whose Mediterranean distributions lack normal genetic structure (Fineschi et al., 2000; Vendramin et al., 2008) and whose ranges have been significantly increased through millennia of cultivation (Conedera et al., 2004).
Two types of change possibly mediated by human activities emerge from our analyses. First, disturbance-mediated population increases, either short-lived as seen with Carpinus in north-eastern Europe (Ralska-Jasiewiczowa et al., 2003) or more sustained as shown by Fagus in northern Europe (Giesecke et al., 2007). Second, declines in abundance that are not necessarily linked to range contractions, best demonstrated for Tilia population declines in connection with forest clearance for agriculture (Turner, 1962), but also described for Abies linked to domestic grazing and use of fire (Tinner et al., 2013). Human activities have therefore had a far greater influence on taxon spread and distributional limits in the Holocene of Europe than in North America, yet the pollen record for forest trees has been dominated by natural population dynamics until recent centuries (Bradshaw, 2004). Today very little ‘natural’ forest remains and the current population size of European trees is largely an outcome of recent land use (Bradshaw et al., 2015).
Explanations for Holocene shifts in tree abundance
The vegetation cover of Europe has changed profoundly over the course of the Holocene with changing dominance of different woody taxa. Their time of dominance corresponds to their time of spread, but it was probably not the species-specific rate of spread that determined the time of dominance in most cases. The late-arriving species Fagus and Carpinus do not show a constant slow spread northward that would explain their late arrival at their northern limits. The expansion of Fagus populations in the Balkan and Iberian peninsulas, where the species occurred during the LGM, was as late as in central Europe where the tree was previously absent. Picea presumably reached mountain tops in Scandinavia during the Lateglacial and early Holocene, but populations did not expand until at least 5 ka later. Thus the late expansion of particularly Fagus, Carpinus and Picea cannot be explained by ‘migrational lag’, whereas a number of taxa that have not filled their potential distribution and are restricted to southern Europe (Svenning et al., 2008) show a ‘lack of migration’.
The glacial/interglacial cycle first proposed by Iversen (1958) may have some power explaining the late expansion of some trees (Birks & Birks, 2004; Kunes et al., 2011). Glacials reset soil formation particularly in high latitude areas and the young soils gradually leached phosphorus (Boyle et al., 2013). Thus while phosphorus may be readily available in young soils during the initial phase of an inter-glacial, with time this nutrient becomes increasingly limiting to plant growth. Kunes et al. (2011) suggest that plants with phosphorus-mining ectomycorrhiza would therefore be favoured during the later stages of interglacials and lists Fagus, Carpinus and Picea among those. The
constant increase in area with various abundance classes of Ericaceae pollen over the last 8 kyr (see Fig. S1.1) also attests to gradual changes in soils, namely paludification increasing the amount of peatland as well as podsolization reducing soil fertility. Corylus also possesses ectomycorrhiza, but decreased in abundance during the second half of the Holocene. Its decline, particularly in more continental areas, was unlikely to be due simply to the species being shaded out by more shade-tolerant taxa. There is a simultaneous west-ward shift of Picea distributions towards the Atlantic coast. Corylus benefits from mild winters while they seem to limit the natural distribution of Picea in Europe. Thus a decline of Corylus in more continental areas and a spread of Picea towards more oceanic regions may be interpreted as caused by decreasing winter temperatures in continental areas due to a reduction in the strength of the westerly winds (Giesecke et al., 2008). Thus while migrational lag has little power to explain the shifts in Holocene plant abundance, the combination of climate and soil changes may explain some patterns. Seed dispersal, population growth rates and other plant traits were surely important in shaping the early Holocene dynamics, but cannot explain many patterns.
Acknowledgements
Pollen data were extracted from the European Pollen Database (EPD;
http://www.europeanpollendatabase.net/) and the work of the data contributors and the EPD community is gratefully acknowledged. Giesecke acknowledges funding from the DFG grant GI 732/5-1. Brewer was funded by NSF grant EAR-1003848. We thank John Birks, Jack Williams and two anonymous reviewers for comments on the manuscript.
References
Amon, L., Veski, S. & Vassiljev, J. (2014) Tree taxa immigration to the eastern Baltic region, southeastern sector of Scandinavian glaciation during the Late-glacial period (14,500-11,700 cal. BP). Vegetation History and Archaeobotany, 23, 207–216.
Anderson, L.L., Hu, F.S., Nelson, D.M., Petit, R.J. & Paige, K.N. (2006) Ice-age endurance: DNA evidence of a white spruce refugium in Alaska. Proceedings of the National Academy of Sciences USA, 103, 12447–12450.
Bartlein, P.J., Harrison, S.P., Brewer, S., Connor, S., Davis, B.A.S., Gajewski, K., Guiot, J., Harrison-Prentice, T.I., Henderson, A., Peyron, O., Harrison-Prentice, I.C., Scholze, M., Seppa, H., Shuman, B., Sugita, S., Thompson, R.S., Viau, A.E., Williams, J. & Wu, H. (2011) Pollen-based continental climate reconstructions at 6 and 21 ka: a global synthesis. Climate Dynamics, 37, 775–802.
Bennett, K.D. (1986) The rate of spread and population increase of forest trees during the
postglacial. Philosophical Transactions of the Royal Society of London Series B, Biological Sciences, 314, 523–531.
Bennett, K.D., Tzedakis, P.C. & Willis, K.J. (1991) Quaternary refugia of North European trees. Journal of Biogeography, 18, 103–115.
Bertsch, K. (1940) Geschichte des deutschen Waldes. Fischer, Jena.
Bialozyt, R., Ziegenhagen, B. & Petit, R.J. (2006) Contrasting effects of long distance seed dispersal on genetic diversity during range expansion. Journal of Evolutionary Biology, 19, 12–20.
Birks, H.H., Giesecke, T., Hewitt, G.M., Tzedakis, P.C., Bakke, J. & Birks, H.J.B. (2012) Comment on “Glacial survival of boreal trees in northern Scandinavia”. Science, 338, 742–742.
Birks, H.J.B. (1989) Holocene isochrone maps and patterns of tree-spreading in the British Isles. Journal of Biogeography, 16, 503–540.
Birks, H.J.B. & Birks, H.H. (2004) The rise and fall of forests. Science, 305, 484–485.
Boyle, J.F., Chiverrell, R.C., Norton, S.A. & Plater, A.J. (2013) A leaky model of long-term soil phosphorus dynamics. Global Biogeochemical Cycles, 27, 516–525.
Bradshaw, R.H., Jones, C.S., Edwards, S.J. & Hannon, G.E. (2015) Forest continuity and conservation value in Western Europe. The Holocene, 25, 194–202.
Bradshaw, R.H.W. (2004) Past anthropogenic influence on European forests and some possible genetic consequences. Forest Ecology and Management, 197, 203–212.
Brewer, S., Cheddadi, R., deBeaulieu, J.L. & Reille, M.; data contributors (2002) The spread of deciduous Quercus throughout Europe since the last glacial period. Forest Ecology and Management, 156, 27–48.
Brewer, S., Giesecke, T., Davis, B.A.S., Finsinger, W., Wolters, S., Binney, H., de Beaulieu, J.-L., Fyfe, R., Gil-Romera, G., Kuhl,€ N., Kunes, P., Leydet, M. & Bradshaw, R.H. (2016) Late-glacial and
Holocene European pollen data. Journal of Maps, 1–8, doi:10.1080/17445647.2016.1197613. Clark, J.S. (1998) Why trees migrate so fast: confronting theory with dispersal biology and the paleorecord. The American Naturalist, 152, 204–224.
Cleveland, W.S. & Devlin, S.J. (1988) Locally weighted regression - An approach to regression-analysis by local fitting. Journal of the American Statistical Association, 83, 596–610.
Conedera, M., Krebs, P., Tinner, W., Pradella, M. & Torriani, D. (2004) The cultivation of Castanea sativa (Mill.) in Europe, from its origin to its diffusion on a continental scale. Vegetation History and Archaeobotany, 13, 161–179.
Davis, M.B. (1976) Pleistocene biogeography of temperate deciduous forests. Geoscience and Man, 13, 13–26.
de Lafontaine, G., Amasifuen Guerra, C.A., Ducousso, A. & Petit, R.J. (2014) Cryptic no more: soil macrofossils uncover Pleistocene forest microrefugia within a periglacial desert. New Phytologist, 204, 715–729.
Delcourt, P.A. & Delcourt, H.R. (1987) Long-term forest dynamics of the Temperate Zone: a case study of Late-Quaternary Forests in eastern North America. Springer, New York.
Diffenbaugh, N.S. & Field, C.B. (2013) Changes in ecologically critical terrestrial climate conditions. Science, 341, 486–492.
Feurdean, A., Willis, K.J., Parr, C.L., Tantau, I. & Farcas, S. (2010) Post-glacial patterns in vegetation dynamics in Romania: homogenization or differentiation? Journal of Biogeography, 37, 2197– 2208.
Feurdean, A., Bhagwat, S.A., Willis, K.J., Birks, H.J.B., Lischke, H. & Hickler, T. (2013) Tree
migration-rates: narrowing the gap between inferred post-glacial rates and projected rates. PLoS ONE, 8, e71797.
Fineschi, S., Taurchini, D., Villani, F. & Vendramin, G.G. (2000) Chloroplast DNA polymorphism reveals little geographical structure in Castanea sativa Mill. (Fagaceae) throughout southern European countries. Molecular Ecology, 9, 1495–1503.
Firbas, F. (1949) Spät- und nacheiszeitliche Waldgeschichte Mitteleuropas nördlich der Alpen, Allgemeine Waldgeschichte. Gustav Fischer, Jena.
Giesecke, T. (2005a) Moving front or population expansion: how did Picea abies (L.) Karst. become frequent in central Sweden? Quaternary Science Reviews, 24, 2495–2509.
Giesecke, T. (2005b) Holocene dynamics of the southern boreal forest in Sweden. The Holocene, 15, 858–872.
Giesecke, T. (2013) Changing plant distributions and abundances. The encyclopedia of quaternary science, vol 3 (ed. by S.A. Elias), pp. 854–860. Elsevier, Amsterdam.
Giesecke, T. (2016) Did thermophilous trees spread into central Europe during the Lateglacial? New Phytologist, 212, 15–18.
Giesecke, T. & Bennett, K.D. (2004) The Holocene spread of Picea abies (L.) Karst. in Fennoscandia and adjacent areas. Journal of Biogeography, 31, 1523–1548.
Giesecke, T., Hickler, T., Kunkel, T., Sykes, M.T. & Bradshaw, R.H.W. (2007) Towards an
understanding of the Holocene distribution of Fagus sylvatica L. Journal of Biogeography, 34, 118– 131.
Giesecke, T., Bjune, A.E., Chiverrell, R.C., Seppa, H., Ojala, A.E.K. & Birks, H.J.B. (2008) Exploring Holocene continentality changes in Fennoscandia using present and past tree distributions. Quaternary Science Reviews, 27, 1296– 1308.
Giesecke, T., Bennett, K.D., Birks, H.J.B., Bjune, A.E., Bozilova, E., Feurdean, A., Finsinger, W., Froyd, C., Pokorny, P., Roesch, M., Seppa, H., Tonkov, S., Valsecchi, V. & Wolters, S. (2011) The pace of Holocene vegetation change - testing for synchronous developments. Quaternary Science
Giesecke, T., Davis, B., Brewer, S., Finsinger, W., Wolters, S., Blaauw, M., Beaulieu, J.-L., Binney, H., Fyfe, R., Gaillard, M.-J., Gil-Romera, G., Knaap, W.O., Kunes, P., Kuhl,€ N., Leeuwen, J.N., Leydet, M., Lotter, A., Ortu, E., Semmler, M. & Bradshaw, R.W. (2014) Towards mapping the late
Quaternary vegetation change of Europe. Vegetation History and Archaeobotany, 23, 75–86. Godwin, H. (1975) History of the British flora, 2nd edn. Cambridge University Press, Cambridge. Grimm, E.C. (1984) Fire and other factors controlling the big woods vegetation of Minnesota in the mid-nineteenth century. Ecological Monographs, 54, 291–311.
Heikkila, M., Fontana, S.L. & Seppa, H. (2009) Rapid Late-glacial tree population dynamics and ecosystem changes in the eastern Baltic region. Journal of Quaternary Science, 24, 802–815. Heiri, O., Brooks, S.J., Renssen, H. et al. (2014) Validation of climate model-inferred regional temperature change for late-glacial Europe. Nature Communications, 5:4914, 1–7.
Hijmans, R.J. (2015) raster: geographic data analysis and modeling. R package version 2.5-2. Available at: https:// CRAN.R-project.org/package=raster.
Hu, F.S., Hampe, A. & Petit, R.J. (2009) Paleoecology meets genetics: deciphering past vegetational dynamics. Frontiers in Ecology and the Environment, 7, 371–379.
Huntley, B. & Birks, H.J.B. (1983) An atlas of past and present pollen maps for Europe 0–13000 years ago. Cambridge University Press, Cambridge.
Huntley, B. & Webb, T. (1989) Migration: species’ response to climatic variations caused by changes in the Earth’s orbit. Journal of Biogeography, 16, 5–19.
Huntley, B., Bartlein, P.J. & Prentice, I.C. (1989) Climatic control of the distribution and abundance of beech (Fagus L.) In Europe and North-America. Journal of Biogeography, 16, 551–560.
Iversen, J. (1958) The bearing of glacial and interglacial epochs on the formation and extinction of plant taxa. Uppsala Universitets Arsskrift, , 210 215.
Kullman, L. (2008) Early postglacial appearance of tree species in northern Scandinavia: review and perspective. Quaternary Science Reviews, 27, 2467–2472.
Kunes, P., Odgaard, B.V. & Gaillard, M.-J. (2011) Soil phosphorus as a control of productivity and openness in temperate interglacial forest ecosystems. Journal of Biogeography, 38, 2150–2164. Küster, H. (1997) The role of farming in the post-glacial expansion of beech and hornbeam in the oak woodlands of central Europe. Holocene, 7, 239–242.
Lehsten, D., Dullinger, S., Hülber, K., Schurgers, G., Cheddadi, R., Laborde, H., Lehsten, V., Francois, L., Dury, M. Sykes, M.T. (2014) Modelling the Holocene migrational dynamics of Fagus sylvatica L. and Picea abies (L.) H. Karst. Global Ecology and Biogeography, 23, 658–668.
Lisitsyna, O.V., Giesecke, T. & Hicks, S. (2011) Exploring pollen percentage threshold values as an indication for the regional presence of major European trees. Review of Palaeobotany and Palynology, 166, 311–324.
Lubina, J.A. & Levin, S.A. (1988) The spread of a reinvading species – range expansion in the California sea otter. The American Naturalist, 131, 526–543.
Magri, D. (2008) Patterns of post-glacial spread and the extent of glacial refugia of European beech (Fagus sylvatica). Journal of Biogeography, 35, 450–463.
Magri, D., Vendramin, G.G., Comps, B., Dupanloup, I., Geburek, T., Gomory, D., Latalowa, M., Litt, T., Paule, L., Roure, J.M., Tantau, I., van der Knaap, W.O., Petit, R.J. & de Beaulieu, J.L. (2006) A new scenario for the Quaternary history of European beech populations: palaeobotanical evidence and genetic consequences. New Phytologist, 171, 199–221.
Magri, D., Agrillo, E., Di Rita, F., Furlanetto, G., Pini, R., Ravazzi, C. & Spada, F. (2015) Holocene dynamics of tree taxa populations in Italy. Review of Palaeobotany and Palynology, 218, 267–284. McLachlan, J.S., Clark, J.S. & Manos, P.S. (2005) Molecular indicators of tree migration capacity under rapid climate change. Ecology, 86, 2088–2098.
McLeod, T.K. & MacDonald, G.M. (1997) Postglacial range expansion and population growth of Picea mariana, Picea glauca and Pinus banksiana in the western interior of Canada. Journal of Biogeography, 24, 865–881.
Meier, E.S., Lischke, H., Schmatz, D.R. & Zimmermann, N.E. (2012) Climate, competition and connectivity affect future migration and ranges of European trees. Global Ecology and Biogeography, 21, 164–178.
Molinari, C., Lehsten, V., Bradshaw, R.H.W., Power, M.J., Harmand, P., Arneth, A., Kaplan, J.O., Vanniere, B. & Sykes, M.T. (2013) Exploring potential drivers of European biomass burning over the Holocene: a data-model analysis. Global Ecology and Biogeography, 22, 1248– 1260.
Mortensen, M.F., Henriksen, P.S. & Bennike, O. (2014) Living on the good soil: relationships between soils, vegetation and human settlement during the late Allerod period in Denmark. Vegetation History and Archaeobotany, 23, 195–205.
Nabel, J.E.M.S., Zurbriggen, N. & Lischke, H. (2013) Interannual climate variability and population density thresholds can have a substantial impact on simulated tree species’ migration. Ecological Modelling, 257, 88–100.
Ohlemüller, R., Gritti, E.S., Sykes, M.T. & Thomas, C.D. (2006) Towards European climate risk surfaces: the extent and distribution of analogous and non-analogous climates 1931–2100. Global Ecology and Biogeography, 15, 395–405.
Ordonez, A. & Williams, J.W. (2013) Climatic and biotic velocities for woody taxa distributions over the last 16000 years in eastern North America. Ecology Letters, 16, 773–781.
Parducci, L., Jorgensen, T., Tollefsrud, M.M. et al. (2012) Glacial survival of boreal trees in northern Scandinavia. Science, 335, 1083–1086.
Petit, R.J., Pineau, E., Demesure, B., Bacilieri, R., Ducousso, A. & Kremer, A. (1997) Chloroplast DNA footprints of postglacial recolonization by oaks. Proceedings of the National Academy of Sciences USA, 94, 9996–10001.
Petit, R.J., Csaikl, U.M., Bordacs, S. et al. (2002) Chloroplast DNA variation in European white oaks – phylogeography and patterns of diversity based on data from over 2600 populations. Forest Ecology and Management, 156, 5–26.
Pierce, D. (2014) ncdf: Interface to Unidata netCDF data files. R package version 1.6.8. Available at: https://CRAN.R-pro ject.org/package=ncdf.
Prentice, I.C. (1988) Paleoecology and plant-population dynamics. Trends in Ecology and Evolution, 3, 343–345.
Prentice, I.C., Bartlein, P.J. & Webb, T. (1991) Vegetation and climate change in eastern North-America since the Last Glacial Maximum. Ecology, 72, 2038–2056.
R Core Team (2016) R: A language and environment for statistical computing. R Foundation for Statistical Computing, Vienna, Austria. Available at: https://www.R-project.org/ (Last accessed 01.04.2016).
Rahmstorf, S. (2002) Ocean circulation and climate during the past 120,000 years. Nature, 419, 207–214.
Ralska-Jasiewiczowa, M., Nalepka, D. & Goslar, T. (2003) Some problems of forest transformation at the transition to the oligocratic/Homo sapiens phase of the Holocene interglacial in northern lowlands of central Europe. Vegetation History and Archaeobotany, 12, 233–247.
Rasmussen, S.O., Bigler, M., Blockley, S.P. et al. (2014) A stratigraphic framework for abrupt climatic changes during the Last Glacial period based on three synchronized Greenland ice-core records: refining and extending the INTIMATE event stratigraphy. Quaternary Science Reviews, 106, 14–28.
Ravazzi, C. (2002) Late Quaternary history of spruce in southern Europe. Review of Palaeobotany and Palynology, 120, 131–177.
Ritchie, J.C. & MacDonald, G.M. (1986) The patterns of post-glacial spread of white spruce. Journal of Biogeography, 13, 527–540.
Rudolph, K. (1930) Grundzüge der nacheiszeitlichen Waldgeschichte Mitteleuropas. Beihefte Botanisches Centralblatt, 47, 11–176.
Saltre, F., Saint-Amant, R., Gritti, E.S., Brewer, S., Gaucherel, C., Davis, B.A.S. & Chuine, I. (2013) Climate or migration: what limited European beech post-glacial colonization? Global Ecology and Biogeography, 22, 1217–1227.
Shuman, B., Bartlein, P., Logar, N., Newby, P. & Webb Iii, T. (2002) Parallel climate and vegetation responses to the early Holocene collapse of the Laurentide Ice Sheet. Quaternary Science Reviews, 21, 1793–1805.
Skellam, J.G. (1951) Random dispersal in theoretical populations. Bulletin of Mathematical Biology, 53, 135–165.
Smith, B.D. & Yarnell, R.A. (2009) Initial formation of an indigenous crop complex in eastern North America at 3800 B.P. Proceedings of the National Academy of Sciences USA, 106, 6561–6566. Snell, R.S., Huth, A., Nabel, J.E.M.S., Bocedi, G., Travis, J.M.J., Gravel, D., Bugmann, H., Gutierrez, A.G., Hickler, T., Higgins, S.I., Reineking, B., Scherstjanoi, M., Zurbriggen, N. & Lischke, H. (2014) Using dynamic vegetation models to simulate plant range shifts. Ecography, 37, 1184–1197. Stewart, J.R. & Lister, A.M. (2001) Cryptic northern refugia and the origins of the modern biota. Trends in Ecology and Evolution, 16, 608–613.
Svenning, J.C. & Sandel, B. (2013) Disequilibrium vegetation dynamics under future climate change. American Journal of Botany, 100, 1266–1286.
Svenning, J.C. & Skov, F. (2004) Limited filling of the potential range in European tree species. Ecology Letters, 7, 565– 573.
Svenning, J.C., Normand, S. & Skov, F. (2008) Postglacial dispersal limitation of widespread forest plant species in nemoral Europe. Ecography, 31, 316–326.
Theuerkauf, M. & Joosten, H. (2012) Younger Dryas cold stage vegetation patterns of central Europe – climate, soil and relief controls. Boreas, 41, 391–407.
Tinner, W., Colombaroli, D., Heiri, O., Henne, P.D., Steinacher, M., Untenecker, J., Vescovi, E., Allen, J.R.M., Carraro, G., Conedera, M., Joos, F., Lotter, A.F., Luterbacher, J., Samartin, S. &
Valsecchi, V. (2013) The past ecology of Abies alba provides new perspectives on future responses of silver fir forests to global warming. Ecological Monographs, 83, 419–439.
Tollefsrud, M.M., Sonstebo, J.H., Brochmann, C., Johnsen, O., Skroppa, T. & Vendramin, G.G. (2009) Combined analysis of nuclear and mitochondrial markers provide new insight into the genetic structure of North European Picea abies. Heredity, 102, 549–562.
Turner, J. (1962) The Tilia decline: an anthropogenic interpretation. New Phytologist, 61, 328–341. Tzedakis, P.C., Emerson, B.C. & Hewitt, G.M. (2013) Cryptic or mystic? Glacial tree refugia in northern Europe. Trends in Ecology and Evolution, 28, 696–704.
van der Knaap, W.O., van Leeuwen, J.F.N., Finsinger, W., Gobet, E., Pini, R., Schweizer, A.,
Valsecchi, V. & Ammann, B. (2005) Migration and population expansion of Abies, Fagus, Picea, and Quercus since 15000 years in and across the Alps, based on pollen-percentage threshold values. Quaternary Science Reviews, 24, 645–680.
Vendramin, G.G., Fady, B., Gonzalez-Martınez, S.C., Hu, F.S., Scotti, I., Sebastiani, F., Soto, A. & Petit, R.J. (2008) Genetically depauperate but widespread: the case of an emblematic
Mediterranean pine. Evolution, 62, 680–688.
von Post, L. (1924) Ur de sydsvenska skogarnas regionala historia under postarktisk tid. Geologiska Föreningens Förhandlingar, 46, 83–128.
Williams, J.W., Shuman, B.N., Webb, T., Bartlein, P.J. & Leduc, P.L. (2004) Late-quaternary vegetation dynamics in north America: scaling from taxa to biomes. Ecological Monographs, 74, 309–334.
Willis, K.J. & van Andel, T.H. (2004) Trees or no trees? The environments of central and eastern Europe during the Last Glaciation. Quaternary Science Reviews, 23, 2369– 2387.
Woods, K.D. & Davis, M.B. (1989) Paleoecology of range limits – beech in the upper peninsula of Michigan. Ecology, 70, 681–696.
Supporting Information
Additional Supporting Information may be found in the online version of this article:
Data accessibility
All pollen data used for the maps are available from the European Pollen Database (EPD; http://www.europeanpolle ndatabase.net/). The maps generated for this study are available as PDFs as well as numerical values from https://doi.pan gaea.de/10.1594/PANGAEA.865121.
Thomas Giesecke is a palaeoecologist interested in ecosystem dynamics on scales from decades to glacial–interglacial cycles, trying to tease apart internal vegetation drivers such as plant spread from external forcing like climate change. Together with M.L., S.B., W.F. and R.B. he is working with the EPD aiming to increase its usefulness as a resource for the immediate and wider scientific community. The group also uses this resource to address continental scale questions of past vegetation change.
Author contributions: T.G., S.B., W.F. and R.B. had the original idea and M.L. compiled the data; S.B. constructed the maps; T.G. and S.B. performed analyses; T.G. wrote the paper with substantial contributions from M.L., S.B., W.F. and R.B.


![[PDF] Cours général sur Ruby | Formation informatique](data:image/gif;base64,R0lGODlhAQABAIAAAP///wAAACH5BAEAAAAALAAAAAABAAEAAAICRAEAOw==)