HAL Id: hal-00296091
https://hal.archives-ouvertes.fr/hal-00296091
Submitted on 6 Dec 2006
HAL is a multi-disciplinary open access
archive for the deposit and dissemination of
sci-entific research documents, whether they are
pub-lished or not. The documents may come from
teaching and research institutions in France or
abroad, or from public or private research centers.
L’archive ouverte pluridisciplinaire HAL, est
destinée au dépôt et à la diffusion de documents
scientifiques de niveau recherche, publiés ou non,
émanant des établissements d’enseignement et de
recherche français ou étrangers, des laboratoires
publics ou privés.
ECHAM4/MADE GCM ? Part II: Results from a first
multiannual simulation of the submicrometer aerosol
A. Lauer, J. Hendricks
To cite this version:
A. Lauer, J. Hendricks. Simulating aerosol microphysics with the ECHAM4/MADE GCM ? Part II:
Results from a first multiannual simulation of the submicrometer aerosol. Atmospheric Chemistry
and Physics, European Geosciences Union, 2006, 6 (12), pp.5495-5513. �hal-00296091�
© Author(s) 2006. This work is licensed under a Creative Commons License.
Chemistry
and Physics
Simulating aerosol microphysics with the ECHAM4/MADE GCM –
Part II: Results from a first multiannual simulation of the
submicrometer aerosol
A. Lauer and J. HendricksDLR Institute of Atmospheric Physics, Oberpfaffenhofen, 82234 Wessling, Germany Received: 12 June 2006 – Published in Atmos. Chem. Phys. Discuss.: 7 August 2006 Revised: 13 November 2006 – Accepted: 28 November 2006 – Published: 6 December 2006
Abstract. First results of a multiannual integration with the new global aerosol model system ECHAM4/MADE are pre-sented. This model system enables simulations of the particle number concentration and size-distribution, which is a funda-mental innovation compared to previous global model stud-ies considering aerosol mass cycles only. The data calculated by the model provide detailed insights into the properties of the global submicrometer aerosol regarding global bur-den, chemical composition, atmospheric residence time, par-ticle number concentration and size-distribution. The aerosol components considered by the model are sulfate (SO4),
ni-trate (NO3), ammonium (NH4), black carbon (BC), organic
matter (OM), mineral dust, sea salt and aerosol water. The simulated climatological annual mean global atmospheric burdens (residence times) of the dominant submicrometer aerosol components are 2.25 Tg (4.5 d) for SO4, 0.46 Tg
(4.5 d) for NH4, 0.26 Tg (6.6 d) for BC, and 1.77 Tg (6.5 d)
for OM. The contributions of individual processes such as emission, nucleation, condensation or dry and wet deposi-tion to the global sources and sinks of specific aerosol com-ponents and particle number concentration are quantified. Based on this analysis, the significance of aerosol micro-physical processes (nucleation, condensation, coagulation) is evaluated by comparison to the importance of other pro-cesses relevant for the submicrometer aerosol on the global scale. The results reveal that aerosol microphysics are essen-tial for the simulation of the particle number concentration and important but not vital for the simulation of particle mass concentration. Hence aerosol microphysics should be taken into account in simulations of atmospheric processes show-ing a significant dependence on aerosol particle number con-centration. The analysis of the vertical variation of the micro-physical net production and net depletion rates performed for
Correspondence to: A. Lauer
(Axel.Lauer@dlr.de)
particle number concentration, sulfate mass and black carbon mass concentration unveils the dominant source and sink re-gions. Prominent features can be attributed to dominant mi-crophysical processes such as nucleation in the upper tropo-sphere or wet deposition in the lower tropotropo-sphere. Regions of efficient coagulation can be identified.
1 Introduction
Aerosols are known to play an important role not only in many atmospheric processes, but also in environmental pro-tection policy and when concerning adverse effects on pub-lic health. Absorption and scattering of solar radiation by aerosols (direct effect) as well as aerosol impacts on cloud formation and cloud microphysical properties (indirect ef-fect) are important aspects concerning the Earth’s climate, in particular when predicting future climate change. In ad-dition, aerosols are involved in atmospheric chemistry, e.g. by providing surface area for heterogeneous reactions. Re-cently, aerosols received increasing attention in environ-mental policy as the directive 1999/30/EC of the European Council obliges mandatory limit values for particulate mat-ter (PM10) in ambient air since 2005.
Because of the high spatial and temporal variability of aerosols, measurements alone are not sufficient to assess cli-matological average properties of the aerosol over the whole globe, which are needed to address global climate impact and health effects of particulate matter. Thus, the assistance of evaluated global models including detailed representations of atmospheric aerosols is needed to make further progress in understanding the global aerosol cycles and the global im-pact of particulate matter.
Most current global climate models include aerosols in the form of prescribed climatologies or treat aerosol mass
only (e.g. Roeckner et al., 1996, 2003; Feichter et al., 1996; Lohmann et al., 1999a; Adams et al., 1999). Important as-pects such as particle size and particle number concentra-tion have to be obtained diagnostically in such models. The high computing power of current super computers allows for a more detailed representation of aerosols not only in global transport models (e.g. Spracklen et al., 2005a,b) but also in general circulation models (e.g. Gong et al., 2003; Easter et al., 2004; Stier et al., 2005) and enabled the successful coupling of the general circulation model ECHAM4 (Roeck-ner et al., 1996) and the modal aerosol microphysics module MADE (Lauer et al., 2005). Due to the high relevance to climate research, the representation of aerosols is currently also subject to improvement in some other general circula-tion models. Different approaches and techniques are applied regarding the representation of the aerosol size-distribution (modal with fixed standard deviation or bin scheme), the number of modes or bins, the aerosol components consid-ered and the number of aerosol microphysical processes in-cluded. The progress achieved so far is well documented under the framework of the AeroCom Aerosol Model Inter-comparison Initiative (Textor et al., 2006). Model results and further information can also be found on the AeroCom web page http://nansen.ipsl.jussieu.fr/AEROCOM/.
The new model system ECHAM4/MADE is able to cal-culate particle number concentration and the aerosol size-distribution in addition to the mass concentrations of the aerosol components sulfate (SO4), ammonium (NH4),
ni-trate (NO3), black carbon (BC), organic matter (OM), sea
salt, mineral dust and aerosol liquid water (H2O). In the
present study, a so-called time slice experiment has been per-formed to obtain new insights into the properties of the global submicrometer aerosol. Averaging all 10 model years cal-culated, climatological properties of the global aerosol, rep-resentative for the beginning 1990s, are obtained. Besides the characterization of the global submicrometer aerosol, the simulations are used to assess the roles of individual pro-cesses such as emission or deposition. In particular aerosol microphysical processes (nucleation, condensation, coagula-tion) acting on the aerosol size-distribution through changing the aerosol mass or particle number concentration are inves-tigated. This analysis allows a quantitative assessment of the specific role of aerosol microphysics newly included in the model system for the simulation of submicrometer particles on the global scale. Previous investigations of the contri-bution of individual sources and sinks to the global aerosol budget (e.g. Adams and Seinfeld, 2002; Stier et al., 2005) are upgraded by taking into account particle mass concentration, particle number concentration, and, in particular, different size-ranges (modes).
Section 2 gives a brief overview of the model system and model configuration used in this study. The characteristics of the global aerosol regarding particle mass concentrations, particle composition, atmospheric residence time and global burden, particle number concentration, and size-distribution
are presented in Sect. 3. The role of aerosol microphysics for the global simulation of particle mass concentration and particle number concentration is discussed in Sect. 4. The main conclusions of this study are summarized in Sect. 5.
2 Model description
The coupled model system ECHAM4/MADE consists of two main components: the general circulation model (GCM) ECHAM4 and the modal aerosol microphysics model MADE. Each part will be described briefly in the following. Details on the model and techniques used can be found in Lauer et al. (2005) and the references therein. For a detailed evaluation of ECHAM4/MADE and comparison of modeled mass concentrations of multiple aerosol components, particle number concentrations, and size-distributions with observa-tions, we also refer to the first part of this study (Lauer et al., 2005).
2.1 The ECHAM4 GCM
The ECHAM4 GCM (Roeckner et al., 1996) is a spectral model. The horizontal resolution applied in this study is T30, which corresponds to a Gaussian grid of about 3.75◦×3.75◦
(longitude by latitude). The atmosphere is divided into 19 vertical layers ranging from the surface up to 10 hPa (≈30 km). The ECHAM4 version applied in this study in-cludes two major upgrades of the standard version: upgraded cloud microphysics (Lohmann et al., 1999a) and an aerosol module describing the mass concentrations of several aerosol species (Feichter et al., 1996; Lohmann et al., 1999a). In order to be consistent with Lauer et al. (2005), this aerosol module is used to drive the cloud and the radiation schemes of the GCM. MADE has been run in passive mode, neglect-ing feedbacks from the aerosol calculated by MADE to the
model dynamics. This allows us to study the impact of
aerosol microphysics on aerosol properties alone. Changes introduced by altered model dynamics and cloud properties would introduce additional uncertainties in investigating the relevance of aerosol microphysics to the simulation of global aerosol. For a more detailed description of this model set up, we refer to the first part of this study (Lauer et al., 2005).
2.2 Aerosol microphysics model MADE
The aerosol microphysics model MADE (Ackermann et al., 1998) (modal aerosol dynamics model) describes the aerosol size-distribution in a simplified manner by the sum of three log-normally distributed modes: the Aitken (diameter typ-ically smaller than 0.07 µm), accumulation (diameter be-tween about 0.07 µm to 1 µm) and coarse mode (diameter larger than 1 µm). As this study focuses on the submicrome-ter aerosol, coarse particles are not considered to reduce the computational burden of the model. This is justified by the
typically rather little interaction between fine and coarse par-ticle size-ranges (Whitby, 1978). Coarse parpar-ticles are mostly produced by mechanical processes, whereas fine particles are usually produced by combustion, condensation, or nu-cleation processes. Hence, the sources of fine and coarse particles are generally well separated. This counteracts the interaction between these size modes. Furthermore, the time scale of transferring mass from fine to coarse mode by coag-ulation is typically in the order of weeks whereas the usual residence time of fine particles is only in the order of days. A calculation of Binkowski and Roselle (2003) for a typi-cal average continental aerosol size-distribution showed, that the Aitken mode loses only about 0.1%/hr of particle num-ber concentration and about 0.02%/hr of particle mass to the coarse mode due to intermodal coagulation. The calculated loss rates of the accumulation mode to the coarse mode are even lower (0.002%/hr and 0.0008%/hr for number and mass concentration, respectively). Thus, about 4 weeks would be needed to reduce Aitken mode particle number concentra-tion to 50% due to intermodal coagulaconcentra-tion with coarse parti-cles, which is substantially longer than the typical residence times of Aitken mode particles. Hence, the coarse mode can be omitted without losing much accuracy when focusing on average properties of submicrometer particles under typical continental conditions. Nevertheless, the concentrations of sea salt and dust in the accumulation mode could be over-estimated by the model due to neglect of intermodal coagu-lation with coarse particles which can show comparatively large concentrations close to their sources. However, this overestimation is limited by the short residence time of the coarse particles due to efficient sedimentation. Nevertheless, the coarse mode can be easily switched on to allow, for in-stance, the calculation of aerosol optical properties.
All particles are assumed to be internally mixed (see Lauer et al. (2005) for a discussion of this assumption). Aerosol components considered are SO4, NH4, NO3, BC, OM, sea
salt, mineral dust and aerosol liquid water. In addition to the mass concentration of these individual aerosol components of each mode, particle number concentration and the median particle diameter of each mode are calculated taking into ac-count emission of primary particles, nucleation and conden-sation of sulfuric acid vapor, coagulation, size-dependent wet and dry deposition, aerosol chemistry, gas/aerosol partition-ing and cloud processpartition-ing. To reduce numerical expenses, the standard deviations of the modes are kept constant in this MADE version (σ =1.7 for the Aitken mode and σ =2.0 for the accumulation mode).
3 Characteristics of the global aerosol
Results obtained from a 10-year integration with the new model system ECHAM4/MADE provide a detailed picture of the global distribution and physical and chemical charac-teristics of atmospheric submicrometer particles. In addition
to chemical composition, aerosol number concentration and size-distribution are calculated. Furthermore, mass concen-tration, global burden and average residence time of each aerosol component are computed for the two size-ranges Aitken and accumulation mode.
For the present study, the GCM has been run in quasi-equilibrium mode with sea surface temperatures (SST), greenhouse gas concentrations and other boundary condi-tions prescribed according to measurements taken around the year 1990. (Such a simulation is usually called “1990 time slice-experiment”). The 10 years analyzed here were preceded by a 4-year spin-up period, which has been dis-carded. The majority of the emission data used for character-istic global aerosol precursor and primary particle emissions are representative for the mid 1980s to early 1990s. Details and references on the emission data and the size-distributions used for the emissions of primary particles are given in Lauer et al. (2005).
3.1 Particle mass concentration
Global distributions of particle mass concentrations have been simulated in numerous previous GCM studies (e.g. Fe-ichter et al., 1996; Adams et al., 1999; Chin et al., 2000; Takemura et al., 2000; Chung and Seinfeld, 2002). As parti-cle mass concentrations are closely related to partiparti-cle number concentration and size-distribution, we will also present par-ticle mass concentrations of selected species simulated with ECHAM4/MADE to provide a complete picture of the char-acteristics of the global submicrometer aerosol. Figures 1– 4 show the climatological annual means of the near surface mass concentrations of selected species as well as corre-sponding zonal mean vertical cross sections obtained from the 10-year integration. As a new feature results obtained for both individual submicrometer modes are presented, rather than total concentrations. In order to facilitate the analysis of the altitudinal variation, all aerosol mass concentrations pre-sented in this section are transformed to standard temperature and pressure (STP) conditions, i.e. 273 K, 1013 hPa.
3.1.1 Sulfate and ammonium
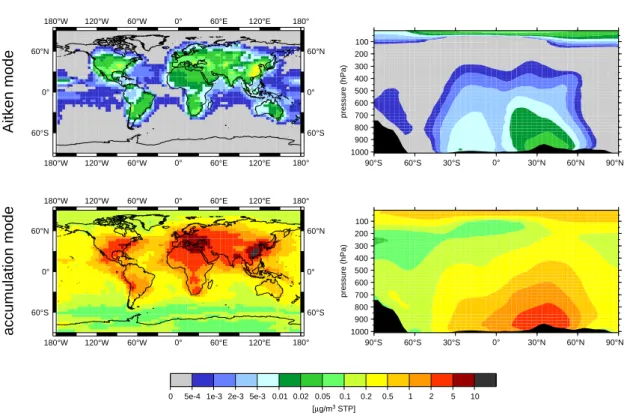
Figure 1 shows the global distributions of the annual mean sulfate mass concentrations of the Aitken and accumulation mode in the lowest model layer and corresponding vertical distributions. In general, the total sulfate mass concentration is dominated by the accumulation mode, whereas the Aitken mode has only a small contribution.
The geographical distribution shows sulfate maxima in Central Europe, the eastern United States, and Southeast Asia. These regions correspond with areas of high SO2
emis-sions from fossil fuel combustion. In contrast to, for instance, BC, sulfate is a secondary aerosol, i. e. almost no sulfate is emitted by the sources directly, but results from gaseous pre-cursors which are transformed to SO4by chemical reactions.
180°W 180°W 120°W 120°W 60°W 60°W 0° 0° 60°E 60°E 120°E 120°E 180° 180° 60°S 60°S 0° 0° 60°N 60°N
SO
4concentration
Aitken mode 100 200 300 400 500 600 700 800 900 1000 pressure (hPa) 90°S 60°S 30°S 0° 30°N 60°N 90°N 180°W 180°W 120°W 120°W 60°W 60°W 0° 0° 60°E 60°E 120°E 120°E 180° 180° 60°S 60°S 0° 0° 60°N 60°N accumulation mode 100 200 300 400 500 600 700 800 900 1000 pressure (hPa) 90°S 60°S 30°S 0° 30°N 60°N 90°N0 5e-4 1e-3 2e-3 5e-3 0.01 0.02 0.05 0.1 0.2 0.5 1 2 5 10 [µg/m3 STP]
Fig. 1. Climatological annual means of simulated SO4mass concentration for Aitken (top) and accumulation mode (bottom) obtained from a 10-year integration. For each mode, the geographical distribution of the lowermost model layer (left), which is about 60 m thick, and the zonally averaged vertical cross section (right) are shown. The concentrations are given at STP conditions (see text for details).
Thus, the maxima in the geographical distribution have a larger extent than in the case of primary aerosols (e.g. Fig. 2). Overall, the basic characteristics of the patterns of the geo-graphical SO4distribution follow the distribution of the SO2
emissions. These basic characteristics of the geographical distribution of total SO4mass (sum of Aitken and
accumu-lation mode) obtained in our simuaccumu-lations are similar to the results of other model simulations (e.g. Feichter et al., 1996; Adams et al., 1999; Takemura et al., 2000). Compared to
measurements, ECHAM4/MADE reproduces the SO4
con-centrations reasonably well. However, sulfate mass is over-estimated compared to measurements for European summer conditions (see Lauer et al. (2005) for details).
As a direct result of the smaller average residence time of Aitken particles compared to accumulation mode parti-cles, the pattern of the Aitken mode is spread out less around the areas of maximum emissions than the one of the accu-mulation mode. (For a detailed analysis of the efficiency of the major sinks of sulfate in the different modes, we refer to Sect. 4.2.)
The zonal mean cross sections of both modes show highest sulfate concentrations in the boundary layer of the northern hemisphere between 20°N and 50°N (Central Europe, USA,
and Asia). With increasing height, the SO4mass
concentra-tions decrease. This results from sink processes, in particular wet deposition, which compensate the source processes for sulfate (gas and liquid phase production of SO4) at higher
al-titudes. The tropopause region shows no enhanced SO4mass
concentrations, although strong nucleation of the binary sys-tem H2SO4-H2O takes place in these altitudes (Sect. 3.4).
The newly formed particles tend to remain small on average due to the limited availability of SO4precursors.
In the model, the geographical distribution of ammonium (not shown) closely follows the one of sulfate, since most NH4is associated with SO4.
3.1.2 Black carbon and organic matter
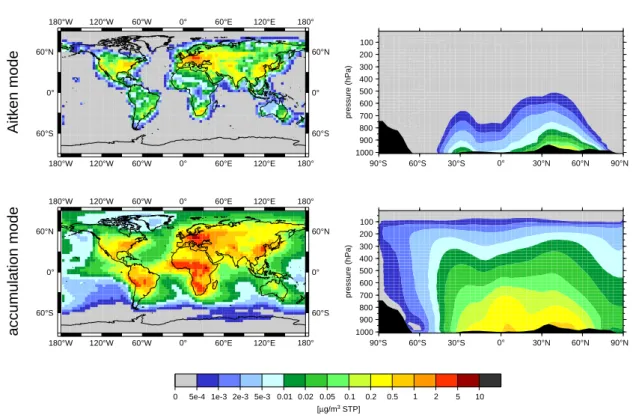
In contrast to the geographical distribution of sulfate, the an-nual mean black carbon mass concentration does not only show maxima in Central Europe, the eastern United States and Southeast Asia, but also in central parts of South Amer-ica and AfrAmer-ica (Fig. 2). The maxima in the highly polluted areas of the northern hemisphere are mainly due to fossil fuel combustion, whereas enhanced BC concentrations in South America and Africa are caused by biomass burning activi-ties. As for sulfate, the geographical distribution of BC in
180°W 180°W 120°W 120°W 60°W 60°W 0° 0° 60°E 60°E 120°E 120°E 180° 180° 60°S 60°S 0° 0° 60°N 60°N
BC concentration
Aitken mode 100 200 300 400 500 600 700 800 900 1000 pressure (hPa) 90°S 60°S 30°S 0° 30°N 60°N 90°N 180°W 180°W 120°W 120°W 60°W 60°W 0° 0° 60°E 60°E 120°E 120°E 180° 180° 60°S 60°S 0° 0° 60°N 60°N accumulation mode 100 200 300 400 500 600 700 800 900 1000 pressure (hPa) 90°S 60°S 30°S 0° 30°N 60°N 90°N0 5e-4 1e-3 2e-3 5e-3 0.01 0.02 0.05 0.1 0.2 0.5 1 2 5 10 [µg/m3 STP]
Fig. 2. As Fig. 1, but for black carbon (BC).
the Aitken mode reveals a less distinctive long-range trans-port than the accumulation mode. As in the case of sulfate, this is due to the shorter average residence time of Aitken mode particles compared to particles in the size-range of the accumulation mode. (For a detailed analysis of the efficiency of the major sinks of BC in the different modes, we refer to Sect. 4.3.) The geographical distribution as well as abso-lute values of the total BC mass concentration simulated by ECHAM4/MADE are within the range spanned by the re-sults of other model studies (e.g. Chung and Seinfeld, 2002; Cook et al., 2002; Jacobson, 2002). Nevertheless, the abso-lute values simulated by ECHAM4/MADE tend to be at the upper end of this range. Comparisons of measured BC mass concentrations with the ECHAM4/MADE results reveal that the model tends to overestimate BC by a factor of about 2-3 in regions of high emissions. This is mainly caused by the relatively high emission rates (mid 1980s) considered in the model. For further details of the comparison we refer to Lauer et al. (2005).
The zonal mean cross sections also shown in Fig. 2 reveal that the highest accumulation mode BC concentrations are simulated for the lowermost boundary layer at the northern mid-latitudes (resulting in particular from European emis-sions) and near the equator (mainly caused by emissions in Central Africa). Due to tropical convection,
accumula-tion mode BC particles emitted near the equator can reach higher altitudes than particles emitted at mid-latitudes. The BC mass concentration decreases with increasing height and with increasing distance to the source regions. Aitken mode BC shows maximum concentrations near the surface at northern mid-latitudes, but not in the tropical latitudes. This is a consequence of assuming different size-distributions of BC particles emitted by fossil fuel combustion in the mid-latitudes and biomass burning in the tropics. Fossil fuel combustion results in a much larger fraction of primary BC particles emitted in the size-range of the Aitken mode than biomass burning (for details, see Lauer et al. (2005)). Due to the relatively short average residence time of Aitken mode particles, the Aitken mode mass concentration decreases more rapidly with increasing distance to the source regions at the surface than the accumulation mode mass concentration. The most basic features of the geographical distribution of organic matter (not shown) follow the distribution of black carbon with the exception of South America. Here organic matter is also produced from Terpene emissions, which do not alter the BC distribution.
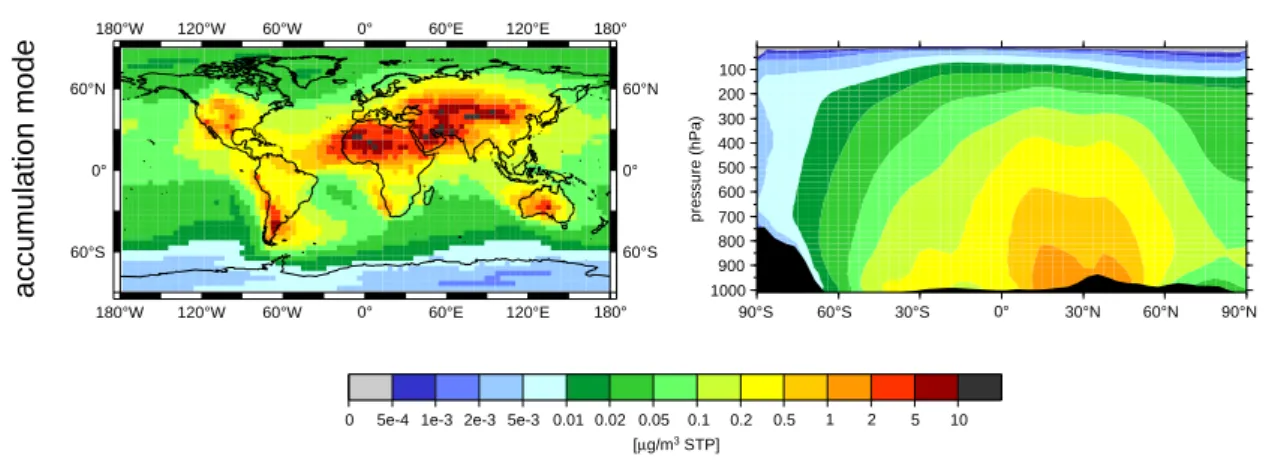
3.1.3 Mineral dust
Currently, the submicrometer fraction of mineral dust in ECHAM4/MADE is represented by the accumulation mode
180°W 180°W 120°W 120°W 60°W 60°W 0° 0° 60°E 60°E 120°E 120°E 180° 180° 60°S 60°S 0° 0° 60°N 60°N
dust concentration
accumulation mode 100 200 300 400 500 600 700 800 900 1000 pressure (hPa) 90°S 60°S 30°S 0° 30°N 60°N 90°N0 5e-4 1e-3 2e-3 5e-3 0.01 0.02 0.05 0.1 0.2 0.5 1 2 5 10 [µg/m3 STP]
Fig. 3. As Fig. 1, but for mineral dust (accumulation mode only).
only. As discussed in Sect. 2.2, the coarse fraction has not been taken into account to reduce the overall computational burden of the model. Since most of the total mass of min-eral dust is associated with particles in the size-range of the coarse mode, the omission of these particles complicates a reasonable comparison with results of other model studies simulating mineral dust. (For a comparison of the total at-mospheric burden of submicrometer dust simulated here and in another study, see Sect. 3.3).
The main source regions for mineral dust are the Sa-hara (North Africa), Arabian deserts (Arabian Peninsula and Asia), Gobi (Asia), the Great Victoria Desert (Australia) and the Atacama (South America). In addition, mineral dust is also emitted at the Great Plains in the western United States (Fig. 3).
The vertical cross section of simulated accumulation mode mineral dust concentrations shows maxima in the boundary layer around 30◦N, where the major source regions are lo-cated. As mineral dust is emitted at the surface only, mass concentrations decrease with increasing height. As for all other aerosol compounds simulated, the mineral dust con-centration south of 75◦S is very low. The calculated dust
concentration does not exceed 0.01 µg/m3 at all heights at these latitudes. This is a result of the, on climatological aver-age, weak airmass exchange of the southern polar zone with the circumventing atmosphere, preventing mineral dust par-ticles from being transported into these latitudes.
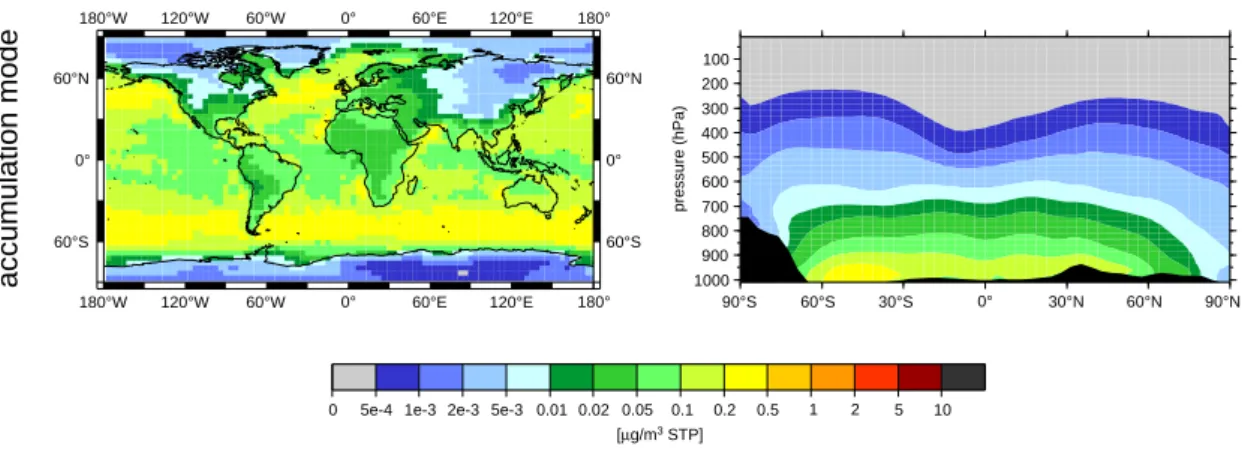
3.1.4 Sea salt
As discussed for mineral dust and in Sect. 2.2, the coarse par-ticle mode is not considered in the present study. Therefore only sea salt particles in the size-range of the accumulation mode are taken into account. Maximum accumulation mode sea salt concentrations are simulated for the marine
bound-ary layer of the mid-latitudes (Fig. 4), a well known feature of the geographical distribution of sea salt particles.
Inspecting the modeled vertical distribution of sea salt, the highest mass concentrations are found in the boundary layer of the main source regions, in particular between 30◦S and
60◦S. The sea salt mass concentration decreases rapidly with
height. This is a direct consequence of the hygroscopicity and the large diameters of the primary sea salt particles emit-ted, facilitating a very effective removal by wet deposition. 3.2 Particle composition
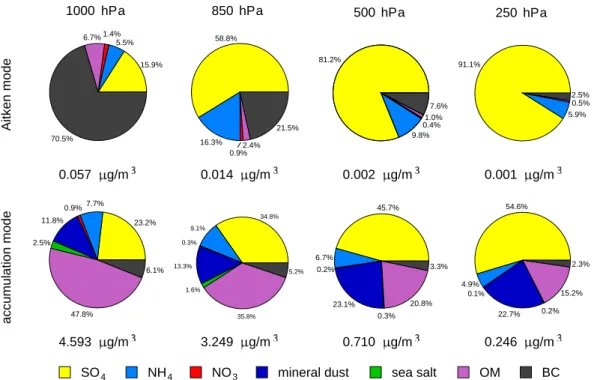
Figure 5 shows the climatological global average (dry) par-ticle composition of submicrometer aerosols obtained from the 10-year model simulation with ECHAM4/MADE on four different model levels (≈1000 hPa, 850 hPa, 500 hPa and 250 hPa). In the lowermost boundary layer (1000 hPa), par-ticle mass in the size-range of the accumulation mode is dom-inated by organic matter (48%), followed by sulfate (23%), mineral dust (12%), ammonium (8%), black carbon (6%), sea salt (3%), and nitrate (1%). This shows that the sur-face emissions play a dominant role determining the parti-cles main components near the surface, as the composition of the emissions of particulate matter is similar to the com-position of the accumulation mode particles at this altitude. The average mass concentration of accumulation mode parti-cles decreases from about 4.6 µg/m3in the lowermost model level to 0.25 µg/m3 (STP conditions) at 250 hPa. The sul-fate fraction increases with height to about 55% at 250 hPa. This is a consequence of sulfate gain due to gas phase oxi-dation of SO2followed by condensation of the sulfuric acid
vapor formed and in-cloud production of SO4throughout the
atmosphere. As long as free excess ammonia is present in the atmosphere, the increase in sulfate causes an increase in ammonium (7.7% in the accumulation mode at 1000 hPa to 9.1% at 850 hPa) as additional ammonium sulfate is formed.
180°W 180°W 120°W 120°W 60°W 60°W 0° 0° 60°E 60°E 120°E 120°E 180° 180° 60°S 60°S 0° 0° 60°N 60°N
sea salt concentration
accumulation mode 100 200 300 400 500 600 700 800 900 1000 pressure (hPa) 90°S 60°S 30°S 0° 30°N 60°N 90°N
0 5e-4 1e-3 2e-3 5e-3 0.01 0.02 0.05 0.1 0.2 0.5 1 2 5 10 [µg/m3 STP]
Fig. 4. As Fig. 1, but for sea salt (accumulation mode only).
If no excess ammonia is left, the relative contribution of am-monium decreases again (6.7% in the accumulation mode at 500 hPa and 4.9% at 250 hPa). The increasing sulfate fraction corresponds with increasing acidity of the aerosol. Aerosol nitrate plays only a minor role on global annual av-erage. The contribution in the near surface layer is rather low (about 1% in the accumulation mode) and further decreases with height.
Also the average composition of Aitken mode particles in the lowermost boundary layer is controlled by the emissions at the surface. Here, the composition is dominated by black carbon (70.5%), followed by sulfate (15.9%), organic mat-ter (6.7%), ammonium (5.5%), and nitrate (1.4%). The very high fraction of BC is caused by fossil fuel combustion. It is assumed that particles emitted by fossil fuel combustion mostly have sizes in the range of the Aitken mode (for details and references see Lauer et al. (2005)). As for accumulation mode particles, the sulfate fraction increases with height as a consequence of sulfate production due to oxidation of SO2
and other precursors.
This increase in relative contribution of SO4 to the
to-tal particle mass in the Aitken mode with height is much stronger than in the accumulation mode. Condensation is proportional to the surface area of the pre-existing particles. Since Aitken particles are smaller than accumulation mode particles, they show a larger surface area to particle volume ratio, which facilitates a more efficient increase in relative contribution of SO4 due to condensation than in the case
of larger particles. The average total mass concentration of Aitken mode particles decreases from 57 ng/m3at 1000 hPa to 1 ng/m3(STP conditions) at 250 hPa. The contribution of the Aitken mode to the total mass of submicrometer particles decreases from 1.2% in the boundary layer to about 0.1% in the tropopause region.
3.3 Atmospheric residence time and global burden The average atmospheric residence time of each aerosol component can easily be estimated from Eq. (1) assuming steady state of sources and sinks:
residence time [days] = P burden [Tg]
sources [Tg/day] (1)
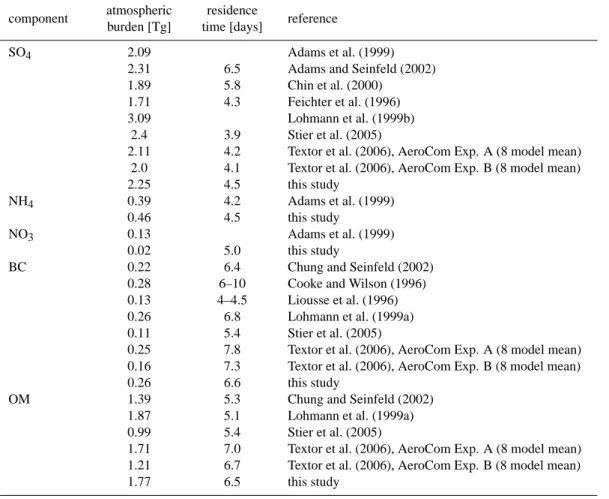
The main component of submicrometer aerosols is sulfate with an average burden of 2.25 Tg, followed by organic mat-ter (1.77 Tg), mineral dust (0.83 Tg), ammonium (0.46 Tg), and black carbon (0.26 Tg) (Table 1). Sea salt (0.08 Tg) and nitrate (0.02 Tg) are only of minor importance for the average global burden of submicrometer particles. The sim-ulated burdens of the aerosol compounds dominated by sub-micrometer particles are within the range spanned by the re-sults of other model studies (Table 2). For the aerosol com-ponents mineral dust and sea salt, most of the mass is asso-ciated with coarse particles, which are not included in this model study. Thus, it is not reasonable to compare the atmo-spheric burden of the submicron fraction of these two com-ponents with the total burdens simulated in other model stud-ies. However, for mineral dust Tegen and Lacis (1996) give size-dependent global average mass loadings, which amount to 0.2 mg/m2for the radius range 0.1–0.18 µm, 1.5 mg/m2 for the radius range 0.18–0.3 µm, and 4.2 mg/m2 for the radius range 0.3–0.6 µm. These mass loadings correspond to global burdens of 0.10 Tg, 0.77 Tg, and 2.14 Tg respec-tively. According to the size of the mineral dust particles emitted in ECHAM4/MADE (d=0.14 µm, σ =1.95), only the two smallest size-ranges reported by Tegen and Lacis (1996) seem appropriate for comparison. Summing up these two size intervals of particles smaller than 0.6 µm in diame-ter results in a burden of 0.87 Tg. This value compares well to the ECHAM4/MADE burden for accumulation mode min-eral dust (0.83 Tg).
Aitken mode 1000 hPa 15.9% 5.5% 1.4% 6.7% 70.5% 0.057 g/m 850 hPa 58.8% 16.3% 0.9% 2.4% 21.5% 0.014 g/m 500 hPa 81.2% 9.8% 0.4% 1.0% 7.6% 0.002 g/m 250 hPa 91.1% 5.9% 0.5% 2.5% 0.001 g/m accumulation mode 23.2% 7.7% 0.9% 11.8% 2.5% 47.8% 6.1% 4.593 g/m 34.8% 9.1% 0.3% 13.3% 1.6% 35.8% 5.2% 3.249 g/m 45.7% 6.7% 0.2% 23.1% 0.3% 20.8% 3.3% 0.710 g/m 54.6% 4.9% 0.1% 22.7% 0.2% 15.2% 2.3% 0.246 g/m
SO4 NH4 NO3 mineral dust sea salt OM BC
Fig. 5. Average composition and total mass concentration (STP conditions) of the global (dry) aerosol of the Aitken and accumulation mode
for the pressure levels 1000 hPa, 850 hPa, 500 hPa and 250 hPa.
Table 1. Average global atmospheric burden and residence time (Eq. 1) of the submicrometer aerosol components calculated by ECHAM4/MADE for the Aitken mode, the accumulation mode and the total submicrometer aerosol.
component atmospheric burden [Tg] average residence time [days] Aitken mode accumulation mode total Aitken mode accumulation mode total
SO4 0.02 2.23 2.25 1.7 4.6 4.5 NH4 0.003 0.46 0.46 0.7 4.7 4.5 NO3 <0.001 0.02 0.02 0.4 5.2 5.0 BC 0.01 0.25 0.26 0.4 8.9 6.6 OM 0.001 1.77 1.77 0.5 6.6 6.5 sea salt – 0.08 0.08 – 1.6 1.6 mineral dust – 0.83 0.83 – 18.0 18.0
Mineral dust has the longest residence time of all aerosol components in the accumulation mode (18 d), followed by accumulation mode black carbon (8.9 d), organic matter (6.6 d), sulfate, ammonium, and nitrate (4.6–5.2 d) and sea salt (1.6 d) (Table 1). The longer residence time of mineral dust in the accumulation mode, BC, and OM is caused by the reduced scavenging efficiency of these particles by cloud droplets due to partly hydrophobic properties. The short res-idence time of sea salt is caused by an efficient wet scaveng-ing due to large particle sizes and high solubility (for details, see Lauer et al. (2005)). On average, the atmospheric res-idence time of Aitken mode particles is shorter than of ac-cumulation mode particles. It amounts to around 0.5 d for Aitken mode NH4, NO3, BC and OM and about 1.7 d for
Aitken mode SO4. This reduced residence time is caused
by additional sinks such as intermodal coagulation or growth of Aitken particles into the size-range of the accumulation mode as well as a very effective dry deposition of Aitken mode particles. The average residence time of the total parti-cle mass (sum of Aitken and accumulation mode) simulated by ECHAM4/MADE is also in the range spanned by the re-sults of other model studies. This is summarized in Table 2. 3.4 Particle number concentration
In contrast to many current climate models,
ECHAM4/MADE calculates particle number
concen-tration and particle size-distribution. This allows a more detailed view on the global aerosol characteristics than
Table 2. Atmospheric burden and residence time for the aerosol compounds SO4, NH4, NO3, BC and OM from various global aerosol modeling studies.
component atmospheric burden [Tg]
residence
time [days] reference
SO4 2.09 Adams et al. (1999)
2.31 6.5 Adams and Seinfeld (2002) 1.89 5.8 Chin et al. (2000)
1.71 4.3 Feichter et al. (1996)
3.09 Lohmann et al. (1999b)
2.4 3.9 Stier et al. (2005)
2.11 4.2 Textor et al. (2006), AeroCom Exp. A (8 model mean) 2.0 4.1 Textor et al. (2006), AeroCom Exp. B (8 model mean)
2.25 4.5 this study
NH4 0.39 4.2 Adams et al. (1999)
0.46 4.5 this study
NO3 0.13 Adams et al. (1999)
0.02 5.0 this study
BC 0.22 6.4 Chung and Seinfeld (2002)
0.28 6–10 Cooke and Wilson (1996) 0.13 4–4.5 Liousse et al. (1996) 0.26 6.8 Lohmann et al. (1999a) 0.11 5.4 Stier et al. (2005)
0.25 7.8 Textor et al. (2006), AeroCom Exp. A (8 model mean) 0.16 7.3 Textor et al. (2006), AeroCom Exp. B (8 model mean)
0.26 6.6 this study
OM 1.39 5.3 Chung and Seinfeld (2002)
1.87 5.1 Lohmann et al. (1999a) 0.99 5.4 Stier et al. (2005)
1.71 7.0 Textor et al. (2006), AeroCom Exp. A (8 model mean) 1.21 6.7 Textor et al. (2006), AeroCom Exp. B (8 model mean)
1.77 6.5 this study
most previous studies, in which particle number concen-tration had to be calculated diagnostically using prescribed size-distributions.
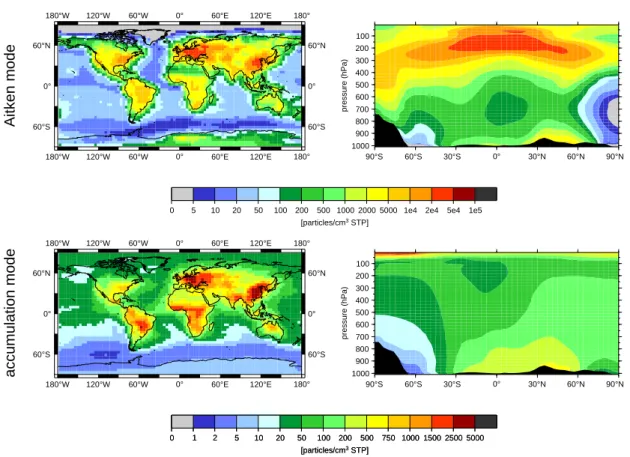
Figure 6 shows the climatological annual mean parti-cle number concentration simulated for the two size-ranges Aitken and accumulation mode. The geographical distribu-tion in the near-surface layer follows the emission-patterns of primary particles and particle precursors (SO2), resulting
in regions of high particle number concentrations due to fos-sil fuel combustion (Central Europe, Southeast Asia, eastern USA) and biomass burning (Central Africa, South America). There are no significant sources of primary particles at the surface south of 30°S other than sea salt.
The largest emission rates of primary particles are usually found over the continents. These include emissions of BC and OM by industry, traffic, burning of domestic fuel and biomass burning as well as emission of mineral dust over the continental deserts. In contrast, sea salt particles are the only important primary particles emitted over the oceans (not taking into account emissions from international shipping). Nevertheless, due to its large particle sizes, sea salt shows comparatively small particle number concentrations.
The highest particle number concentrations in the Aitken mode are simulated for Central Europe, Southeast Asia and the eastern United States. Here, typical annual mean num-ber concentrations of Aitken mode particles range between 10,000 and 50,000 particles per cm3. Above the central re-gions of North and South America, typical annual mean par-ticle number concentrations between 2000 and 5000 cm−3 are simulated. The lowest particle numbers in the Aitken mode are obtained above the oceans, far away from any strong source of primary particles. Here, particle composi-tion is dominated by sea salt and typical annual mean num-ber concentrations do not exceed 100 particles per cm3. The vertical structure of the Aitken mode particle number con-centration simulated for latitudes north of 30◦S shows de-creasing concentrations from the surface up to about 700 to 600 hPa, where the minimum particle number concentrations are reached. This reduction of particle number is mainly caused by coagulation (particularly intermodal coagulation), which is much more effective than wet deposition of Aitken mode particles. The formation of new particles by nucleation is very weak in this altitude range, resulting in a net deple-tion of particle number. There are no significant sources of
180°W 180°W 120°W 120°W 60°W 60°W 0° 0° 60°E 60°E 120°E 120°E 180° 180° 60°S 60°S 0° 0° 60°N 60°N
number concentration
Aitken mode 100 200 300 400 500 600 700 800 900 1000 pressure (hPa) 90°S 60°S 30°S 0° 30°N 60°N 90°N0 5 10 20 50 100 200 500 1000 2000 5000 1e4 2e4 5e4 1e5 [particles/cm3 STP] 180°W 180°W 120°W 120°W 60°W 60°W 0° 0° 60°E 60°E 120°E 120°E 180° 180° 60°S 60°S 0° 0° 60°N 60°N accumulation mode 100 200 300 400 500 600 700 800 900 1000 pressure (hPa) 90°S 60°S 30°S 0° 30°N 60°N 90°N 0 1 2 5 10 20 50 100 200 500 750 1000 1500 2500 5000 [particles/cm3 STP] 0 1 2 5 10 20 50 100 200 500 750 1000 1500 2500 5000 [particles/cm3 STP]
Fig. 6. As Fig. 1, but for total particle number concentration.
primary particles at the surface south of 30◦S. This results
in very low number concentrations of Aitken mode particles in this region in the lower troposphere. Above 600 hPa, par-ticle number concentrations increase rapidly with altitude at all latitudes. Maximum particle numbers are found in the tropopause region, where zonally averaged annual mean con-centrations range between 20 000 and 50 000 particles per cm3(STP). This strong increase in particle number concen-tration is caused by nucleation of sulfuric acid vapor. The low ambient temperatures and the low aerosol surface area available for condensation (which competes with nucleation for the condensable gas) favors efficient nucleation. This basic vertical structure of the mean number concentration of small particles, showing highest number concentrations in the tropopause region and only small number concentra-tions near the surface, is also supported by other recent model studies (e.g. Stier et al., 2005) and measurements (e.g. Clarke and Kapustin, 2002).
The most important source for accumulation mode parti-cle number concentration is the emission of primary partiparti-cles at the surface (see Sect. 4.1). Thus, the highest annual mean number concentrations of particles in the accumulation mode are simulated for the areas around the continental source
re-gions of primary particles in Central Europe, Southeast Asia, the eastern United States and central regions of South Amer-ica and AfrAmer-ica. TypAmer-ical values of 1000 to 2500 cm−3 are simulated for these regions. In Central Europe and South-east Asia the concentrations even exceed 2500 cm−3. The simulation reveals that emissions of BC and OM by fos-sil fuel combustion are the dominant sources in the highly industrialized countries of the northern hemisphere. Emis-sions of BC and OM by biomass burning are dominant in South America and Africa. Because of their large sizes, min-eral dust and sea salt particles are of minor importance for particle number concentration, even though they might tribute significantly to the total particle mass. For the con-tinental regions not discussed above, typical annual mean near-surface particle number concentrations around 100 to 500 cm−3 are simulated. Above the oceans in the northern
hemisphere, the simulation shows typical particle numbers of about 20 cm−3. These northern hemispheric oceanic concen-trations are slightly larger than typical accumulation mode concentrations simulated above the oceans in the southern hemisphere (<20 cm−3) and Antarctica (<10 cm−3). The zonally averaged vertical profile shows maximum annual mean accumulation mode particle number concentrations in
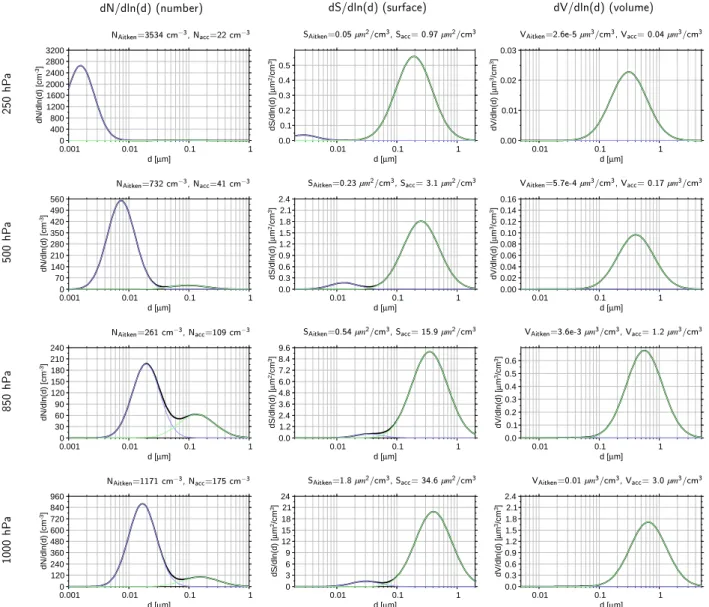
250 hP a dN/dln(d)(number) NAitken=3534 m 3 ,Na =22 m 3 0 400 800 1200 1600 2000 2400 2800 3200 dN/dln(d) [cm -3] 0.001 0.01 0.1 1 d [µm] dS/dln(d)(surfa e) SAitken=0.05µm 2 / m 3 ,Sa =0.97µm 2 / m 3 0.0 0.1 0.2 0.3 0.4 0.5 dS/dln(d) [ µ m 2/cm 3] 0.01 0.1 1 d [µm] dV/dln(d)(volume) VAitken=2.6e-5µm 3 / m 3 ,Va =0.04µm 3 / m 3 0.00 0.01 0.02 0.03 dV/dln(d) [ µ m 3/cm 3] 0.01 0.1 1 d [µm] 500 hP a N Aitken =732 m 3 ,N a =41 m 3 0 70 140 210 280 350 420 490 560 dN/dln(d) [cm -3] 0.001 0.01 0.1 1 d [µm] SAitken=0.23µm 2 / m 3 ,Sa =3.1µm 2 / m 3 0.0 0.3 0.6 0.9 1.2 1.5 1.8 2.1 2.4 dS/dln(d) [ µ m 2/cm 3] 0.01 0.1 1 d [µm] VAitken=5.7e-4µm 3 / m 3 ,Va =0.17µm 3 / m 3 0.00 0.02 0.04 0.06 0.08 0.10 0.12 0.14 0.16 dV/dln(d) [ µ m 3/cm 3] 0.01 0.1 1 d [µm] 850 hP a N Aitken =261 m 3 ,N a =109 m 3 0 30 60 90 120 150 180 210 240 dN/dln(d) [cm -3] 0.001 0.01 0.1 1 d [µm] SAitken=0.54µm 2 / m 3 ,Sa =15.9µm 2 / m 3 0.0 1.2 2.4 3.6 4.8 6.0 7.2 8.4 9.6 dS/dln(d) [ µ m 2/cm 3] 0.01 0.1 1 d [µm] VAitken=3.6e-3µm 3 / m 3 ,Va =1.2µm 3 / m 3 0.0 0.1 0.2 0.3 0.4 0.5 0.6 dV/dln(d) [ µ m 3/cm 3] 0.01 0.1 1 d [µm] 1000 hP a N Aitken =1171 m 3 ,N a =175 m 3 0 120 240 360 480 600 720 840 960 dN/dln(d) [cm -3] 0.001 0.01 0.1 1 d [µm] SAitken=1.8µm 2 / m 3 ,Sa =34.6µm 2 / m 3 0 3 6 9 12 15 18 21 24 dS/dln(d) [ µ m 2/cm 3] 0.01 0.1 1 d [µm] VAitken=0.01µm 3 / m 3 ,Va =3.0µm 3 / m 3 0.0 0.3 0.6 0.9 1.2 1.5 1.8 2.1 2.4 dV/dln(d) [ µ m 3/cm 3] 0.01 0.1 1 d [µm]
Fig. 7. Climatological annual means of the global average size distributions (lognormal) of particle number, dry surface area and dry volume
for the pressure levels 1000 hPa, 850 hPa, 500 hPa and 250 hPa. The Aitken mode is drawn in blue, the accumulation mode in green and the total size-distribution in black. Total number concentration (N), surface area (S), and volume (V) of the Aitken and accumulation mode (acc) are listed above the individual plots. The concentrations shown refer to ambient (not STP) conditions.
the boundary layer above the continents north of 30◦S. Due to weak sources at the surface, accumulation mode particle number concentrations are very low (below 10 cm−3) in the
boundary layer south of about 45◦S. With increasing height,
accumulation mode particle number concentration decreases at all latitudes north of 30◦S. With the exception of a minor source resulting from Aitken mode particles growing into the accumulation mode size-range, no further sources of accu-mulation mode particle number exist but sources at the sur-face. Overall, this results in a net loss of particle number due to wet deposition and coagulation with increasing distance (height) to the surface sources.
3.5 Size-distribution
Figure 7 shows the climatological annual mean of the glob-ally averaged particle number, dry particle surface and dry particle volume size-distribution simulated for different al-titudes. The figure presents results obtained for the low-est model layer (≈1000 hPa), for about 1.5 km altitude (≈850 hPa), as well as the middle (≈500 hPa) and upper troposphere (≈250 hPa).
Near the surface, the simulated size-distribution is strongly influenced by the prescribed size-distributions of primary particles emitted. The median diameters of the Aitken and the accumulation mode are about 17 nm and 155 nm respec-tively. The ratio of total particle number of Aitken and
accu-mulation mode is about 7:1. The ratio amounts to 1:19 in the case of surface area and 1:285 in the case of total volume.
Compared to the near surface conditions, the median di-ameter of the Aitken mode simulated for 850 hPa is slightly larger (19 nm). This is caused by the growth of Aitken parti-cles due to intramodal coagulation and condensation of sul-furic acid vapor occurring during vertical transport from the surface to upper levels. The increase of the Aitken mode me-dian diameter is also caused by intermodal coagulation and dry deposition which both are significant sink processes for Aitken mode particles. The efficiencies of both processes increase with decreasing particle size which results in a re-duced residence time of smaller Aitken particles. Thus, the probability of larger Aitken particles to be transported up-wards is higher than for smaller particles. In contrast to the Aitken mode, the average median diameter of the accumula-tion mode (about 134 nm) at 850 hPa is smaller compared to the 1000 hPa level. This is caused in particular by wet de-position, which removes large particles more efficiently than smaller ones. Another reason can be the transformation of growing Aitken particles into the accumulation mode, which also benefits the decrease in accumulation mode median di-ameter. The efficiencies of processes such as condensational growth or coagulation of accumulation mode particles caus-ing an increase of particle size, are exceeded in particular by wet deposition efficiency, resulting in an overall decrease of the modal median diameter. Due to the sink processes described, particle number concentrations in both modes are smaller at 850 hPa than in the boundary layer (1171 cm−3vs. 261 cm−3in the Aitken mode and 175 cm−3vs. 109 cm−3 in the accumulation mode). The ratio of particle numbers of Aitken and accumulation mode is 2.4:1 at 850 hPa. The corresponding ratios of total surface area and volume con-centration amount to 1:29 and 1:332.
In the middle troposphere (500 hPa), the average median diameter of the simulated accumulation mode amounts to only 96 nm, which is considerably smaller than the values simulated for lower altitudes. As discussed above, an impor-tant reason for this reduction is that the efficiency of wet de-position increases with particle size. The resulting reduction in residence time of larger particles counteracts an efficient upward transport. Compared to the lower troposphere, the median diameter of the modeled Aitken mode is smaller, too. It amounts to only 7.5 nm at 500 hPa. Since the nucleation activity increases with altitude and the newly formed nucle-ation particles are very small (wet diameter 3.5 nm (Lauer et al., 2005)), the total size-distribution of the Aitken mode is shifted towards smaller median diameters and the Aitken particle number concentration increases. The number ratio of Aitken and accumulation mode is about 18:1. The corre-sponding surface and volume ratios amount to 1:14 and to 1:295, respectively.
The average median diameters of both modes further de-crease with altitude. In the upper troposphere (250 hPa), they amount to only 1.6 nm and 74 nm in the case of the
Aitken and accumulation mode, respectively. Particle num-ber concentration in the Aitken mode is larger than simulated for lower altitudes. The ratio of particle number in Aitken and accumulation mode in the upper troposphere amounts to 162:1, which is about one order of magnitude higher than in the middle troposphere. This is mainly caused by strong nucleation, which reaches its maximum activity in the tropopause region. The ratio of the modal surface area concentrations of Aitken and accumulation mode amounts to 1:20 at 250 hPa. The corresponding ratio of the modal vol-umes is 1:1540. In case of strong nucleation, the formation of new very small particles might lead to an underestimation of the median diameter of the Aitken mode compared to ob-servations. This has been identified as a principle limitation of the bimodal representation of the submicrometer aerosol as discussed in Lauer et al. (2005). Thus, the modal median diameter of the Aitken mode should be regarded as a lower limit rather than a typical value for this altitude range. Fu-ture modifications of the model towards the representation of a trimodal size distribution including separated Aitken and nucleation modes will enable a more sufficient representa-tion of the upper tropospheric aerosol.
4 The role of aerosol microphysics on the global scale
To assess the relevance of aerosol microphysics (i.e., nucle-ation and condensnucle-ation of gaseous precursors, coagulnucle-ation of particles) for the simulation of submicrometer particles on the global scale, the roles of individual sources and sinks in the mean budgets of different aerosol compounds and parti-cle number are analyzed for both aerosol modes considered. The specific role of the individual processes can be easily judged from the intercomparison of the strength of the dif-ferent sources and sinks. To realize this, we saved the ac-tual concentration changes induced by each individual pro-cess considered in the model. These changes can be inte-grated over time to calculate the total change and, hence, the corresponding contributions of the individual processes to the global budgets. This technique offers the possibility to gain new insights in the role of individual microphysi-cal processes in the global aerosol cycles. Such detailed in-sights cannot be gained by observations alone, as measure-ments spanning the whole globe, covering at least one full seasonal cycle, and resolving each individual process would be required to obtain balanced data on all relevant sources and sinks. Such measurements are currently not available. Hence, various model studies have addressed the contribu-tion of different sources and sinks to the global aerosol bur-den in the past (e.g. Feichter et al., 1996; Chin et al., 2000; Stier et al., 2005). The budgets provided by these studies considered aerosol mass cycles, but do not resolve particle number, size-dependencies, and aerosol microphysical pro-cesses. The first steps have been done investigating sources and sinks of particle number concentration including aerosol
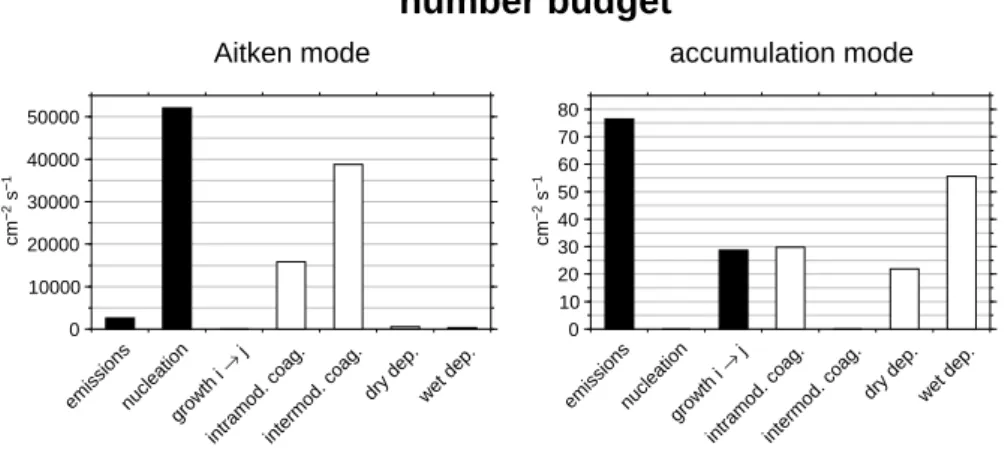
0 10000 20000 30000 40000 50000 cm −2 s −1
number budget
emissionsnucleation growth i → jintramod. coag.intermod. coag.
dry dep. wet dep.
Aitken mode 0 10 20 30 40 50 60 70 80 cm −2 s −1
intramod. coag.intermod. coag.
dry dep. wet dep. growth i
→ j nucleation emissions
accumulation mode
Fig. 8. Contributions of different processes to the global aerosol particle number budget. Mean column changes (particles cm−2s−1) due to sources (black) and sinks (white) calculated from a 10-year model simulation with ECHAM4/MADE are presented for Aitken mode (left) and accumulation mode (right) particles.
microphysics by Adams and Seinfeld (2002). However, their study is limited to pure sulfate aerosols only. The present study addresses both aerosol mass concentrations and parti-cle number concentrations. Different partiparti-cle size-ranges are analyzed separately taking into account aerosol microphysi-cal processes. Budgets of particle number concentrations as well as of the masses of sulfate (secondary aerosol) and black carbon (exemplary for primary aerosol) are investigated. 4.1 Particle number
The emission of primary particles is a source for both modes in the model, whereas new particle formation by nucleation of sulfuric acid vapor is a source for the Aitken mode only. The growth of Aitken mode particles into the size-range of the accumulation mode acts as sink of the Aitken mode par-ticle number and as source of accumulation mode parpar-ticles. The following sinks reduce particle number concentration in the model: intramodal coagulation (coagulation of particles within the same mode), intermodal coagulation (coagulation of particles from different modes; reduces Aitken mode par-ticle number concentration here), as well as dry and wet de-position. Figure 8 depicts the global climatological annual mean, vertically integrated changes in particle number in-duced by the individual sources and sinks as calculated from the 10-year model simulation with ECHAM4/MADE.
On global annual average, the most important source of Aitken mode particles in the simulation is the formation of new particles by nucleation of sulfuric acid vapor in the tropopause region. Since a high production rate of sulfuric acid vapor in the lower troposphere usually coincides with a high particle surface concentration, condensation prevents efficient nucleation in the model. However, due to the coarse spatial and temporal resolution of the model, potentially oc-curring local nucleation bursts cannot be resolved resulting in a potential underestimation of nucleation at these altitudes. It should also be noted, that comparisons with observations
show, that the model tends to underestimate particle sizes in the tropopause region, where the particle formation rate due to nucleation reaches its maximum (Lauer et al., 2005). This might indicate that the newly formed particles grow too slowly or that nucleation might be generally overestimated. Nevertheless, we do expect nucleation being the most impor-tant source of new particles in the size-range of the Aitken mode, since the emission of primary particles at the surface does not contribute very much to the total sources although emissions dominate near the surface. Since the Aitken mode generally dominates particle number concentration, nucle-ation in the tropopause region should be the most impor-tant source of particle number concentration in terms of the global mean. This finding agrees with Adams and Sein-feld (2002), who also found that nucleation is the dominant source of particle number on global annual average. In con-trast, emission of primary particles is the dominating source for accumulation mode particles. In addition, also the growth of Aitken mode particles into the size-range of the accumu-lation mode (“growth i→j”) provides an important contribu-tion to the global sources of accumulacontribu-tion mode particles. Due to the comparatively high particle number concentration of the Aitken mode, the corresponding contribution to the sinks of Aitken mode particle number is negligibly small.
While wet deposition is the most important sink for accu-mulation mode particle number, coagulation is the dominant sink for Aitken mode particles. Here, intermodal coagula-tion is more effective than intramodal coagulacoagula-tion. Dry and wet deposition have only a small impact on particle number concentration in the Aitken mode. Coagulation (intramodal) is an important sink for accumulation mode particle number, too. Besides this, also the removal of particles by dry depo-sition is relevant for the accumulation mode. Again, this is in accordance with the study of Adams and Seinfeld (2002), who also found that coagulation is the dominant sink of par-ticle number concentration on global annual average.
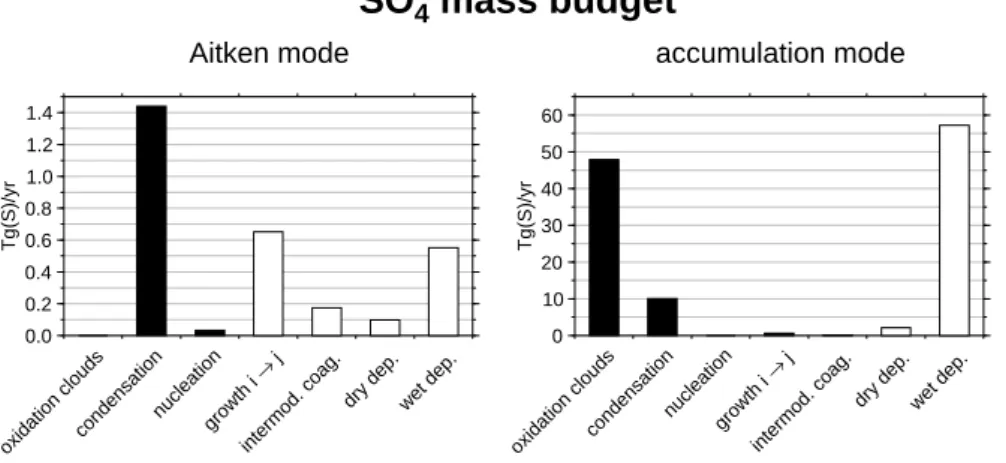
0.0 0.2 0.4 0.6 0.8 1.0 1.2 1.4 Tg(S)/yr
SO
4mass budget
dry dep. wet dep. intermod. coag. growth i → j condensation nucleation oxidation clouds Aitken mode 0 10 20 30 40 50 60 Tg(S)/yr
dry dep. wet dep. intermod. coag. growth i → j condensation nucleation oxidation clouds accumulation mode
Fig. 9. As Fig. 8, but for the aerosol sulfate mass budget.
4.2 Sulfate mass
For the investigation of the budgets of particle mass concen-tration further processes such as condensation or sulfate pro-duction in cloud droplets, need to be analyzed, which change the mass concentration, whereas the number concentration remains unchanged. To assess differences between primary and secondary aerosol components, the budgets are not pre-sented for total mass, but for sulfate and black carbon, which are representative for both classes of aerosol components in the model. Figure 9 shows the budgets of Aitken and accu-mulation mode sulfate for all individual sources and sinks.
Source processes of the secondary aerosol component sul-fate are condensation of sulfuric acid vapor (both modes), formation of new particles by nucleation (Aitken mode only) and sulfate production in cloud droplets by oxidation of SO2
(accumulation mode only). Most of the Aitken mode sul-fate is produced by condensation of H2SO4. Nucleation
con-tributes only about 2% to the sources of Aitken mode sulfate. In the accumulation mode, sulfate production by oxidation of SO2in cloud droplets (82%) dominates all other sources.
In-cloud production contributes about 81% to the total sulfate mass (sum of both modes). This is within the range spanned by the results of other model studies assessing the global at-mospheric sulfate budget. These studies suggest a contribu-tion of in-cloud oxidacontribu-tion of SO2to the total SO4 sources
of, for instance, 77% (Berglen et al., 2004), 64%–83% (Chin et al., 2000), 55% (Koch et al., 2006), and 90% (Takemura et al., 2000). The aerosol model comparison initiative Ae-roCom calculated an average contribution of chemical sul-fate production in the aqueous phase to the total SO4sources
from 11 global models of 74% (Textor et al., 2006). In the present study, the contribution of condensation to the sources of accumulation mode mass amounts to about 17%. The cor-responding contribution of the growth of Aitken particles into the accumulation mode size-range is negligibly small.
In both modes, sulfate is removed by wet and dry deposi-tion. Intermodal coagulation and the growth of Aitken mode particles into the accumulation mode act as sinks for sulfate in the Aitken mode size-range. Wet deposition is the most important sink of accumulation mode sulfate, whereas dry deposition is only of minor importance. In the Aitken mode, besides wet deposition, also the loss of sulfate mass due to particle growth into the accumulation mode size-range is of major importance. But also coagulation and dry deposition must not be neglected when considering the sinks of Aitken mode sulfate. Considering total sulfate mass (sum of Aitken and accumulation mode), wet (dry) deposition contributes about 96% (4%) to the total sinks of sulfate. This is at the high (low) end of the range given by other model studies for the contribution of wet (dry) deposition to the sinks of sulfate: 85% (15%) (Berglen et al., 2004), 80%–93% (20%– 7%) (Chin et al., 2000), 89% (11%) (Koch et al., 2006), 88% (12%) (Takemura et al., 2000), and 95% (5%) Stier et al. (2005). The AeroCom multi model mean suggests a contri-bution of wet (dry) deposition of 89% (11%) to the total sinks of SO4(Textor et al., 2006).
Thus, aerosol microphysics are only of minor importance for the simulation of accumulation mode sulfate burden on the global scale, but are essential for simulating sulfate mass concentration in the size-range of the Aitken mode.
4.3 Black carbon mass
Figure 10 shows the contributions of the individual sources and sinks to the modeled climatological global mean black carbon mass budget.
Emissions are the only source of BC in the Aitken mode size-range. The simulations suggest that emissions of pri-mary particles constitute also the main source (74%) of ac-cumulation mode BC, whereas the growth of Aitken particles into the accumulation mode and intermodal coagulation con-tribute only 17% and 9%, respectively. For both modes, wet
0 2 4 6 8 10 Tg(C)/yr
BC mass budget
emissions growth i → j intermod. coag.dry dep. wet dep.
Aitken mode 0 2 4 6 8 10 Tg(C)/yr emissions growth i → j intermod. coag.
dry dep. wet dep.
accumulation mode
Fig. 10. As Fig. 8, but for the black carbon mass budget.
deposition is the most important sink for BC (Aitken mode: 44% of total sinks, accumulation mode: 86% of total sinks). The reduced efficiency of wet deposition compared to SO4
results from the hydrophobic properties of the primary par-ticles at emission. Only aged (hydrophilic) BC parpar-ticles are subject to activation scavenging. The growth of Aitken par-ticles into the accumulation mode (27%), intermodal coagu-lation (14%), and dry deposition (15%) have important con-tributions to the sinks of the Aitken mode BC. For the ac-cumulation mode, dry deposition cannot be neglected, too (contribution about 14%). Considering the total BC mass budget (sum of Aitken and accumulation mode), the contri-bution of wet (dry) deposition to the total sinks calculated by ECHAM4/MADE amounts to 81% (19%). Stier et al. (2005) calculated a corresponding contribution of 92% (8%). Koch (2001) simulated contributions ranging from 58% to 63% (42% to 37%). Takemura et al. (2000) obtained 82% (18%), the AeroCom multi model mean (Textor et al., 2006) amounts to 78% (22%).
Overall, aerosol microphysics play an important role for the simulation of BC particles on the global scale, particu-larly for the Aitken mode. Although the budget of accumula-tion mode BC is dominated by emission of primary particles and wet and dry deposition, the contribution of aerosol mi-crophysics should not be neglected.
4.4 Net production/depletion
In addition to the total budgets discussed in the previous sec-tion, the vertical distributions of the microphysical change rates (sum of sources and sinks discussed above) of particle number and mass are analyzed and the dominant processes are identified for different altitudes. For particle mass, we selected black carbon and sulfate as representative primary and secondary aerosol components, respectively. Figures 11, 12 and 13 depict the vertical distributions of the
climatolog-ical zonal mean net change rates of particle number, sulfate and black carbon mass concentrations. Sources are consid-ered as positive change rates, sinks as negative change rates. The results allow the identification of regions with net pro-duction and net depletion of particle number and sulfate or black carbon mass.
4.4.1 Particle number concentration
Net production of Aitken mode particles near the surface above the continents between about 45◦S and 75◦N is caused particularly by emission of primary particles from sources at the surface. The analysis of the contribution of the individual sources (not shown) reveals, that formation of new particles by nucleation is of minor importance in the near surface layer. Above this layer, intra- and intermodal coagulation effectively remove particles due to the high num-ber concentrations resulting in a strong net depletion of par-ticle number concentration in the Aitken mode. With in-creasing height this net depletion decreases as particle num-ber concentration in the Aitken mode decreases up to alti-tudes around 600 hPa. Above 600 hPa, in particular in the tropopause region, very effective formation of new Aitken mode particles due to nucleation occurs. Just below this re-gion of strong net production newly formed Aitken particles are efficiently removed by coagulation leading to a net deple-tion in the altitude range of about 300–400 hPa where coag-ulation is not compensated by nucleation.
In terms of annual means, efficient net production of ac-cumulation mode particles takes place in the boundary layer only. In contrast to Aitken mode particles, strong emissions of accumulation mode particles lead to a net production even south of 45◦S above the oceans. This is mainly caused by emissions of sea salt particles. The maximum net depletion of accumulation mode particle number takes place in the al-titude range between 700 and 900 hPa. Here, the reduction
100 200 300 400 500 600 700 800 900 1000 pressure (hPa)
number change rate
90°S 60°S 30°S 0° 30°N 60°N 90°N Aitken mode 100 200 300 400 500 600 700 800 900 1000 pressure (hPa) 90°S 60°S 30°S 0° 30°N 60°N 90°N accumulation mode −100−50 −20 −10 −5 −2 −1 −0.5−0.2 −0.1 0 0.1 0.2 0.5 1 2 5 10 20 50 100 [#/(cm3 h)]
Fig. 11. Zonal mean annual averages of the net microphysical change rate (ambient values, not STP) of particle number in the Aitken (left)
and the accumulation mode (right). Positive values (red/yellow) correspond to a net production of new particles, negative values (blue) to a net depletion of particles.
of particle number by wet deposition is most efficient. Only small net depletion occurs above about 600 hPa. Hence, in contrast to the Aitken mode, the particle number concentra-tion of the accumulaconcentra-tion mode experiences only very small changes due to microphysical processes at these altitudes. This results in a comparatively small altitudinal variation of the accumulation mode particle number concentration (see also Fig. 6).
4.4.2 Sulfate mass
Aitken mode sulfate is very efficiently removed by dry depo-sition at the surface resulting in a strong net depletion in the near surface layer (Fig. 12). In the lower troposphere above the surface layer, net production of sulfate takes place. In this region, large amounts of sulfuric acid vapor condense on the surfaces of the abundantly existing Aitken particles. In addition, a small net production of Aitken mode sulfate takes place in the tropopause region due to new particle formation by nucleation, which compensates the weak sinks in this al-titude. In most other regions, a net depletion of Aitken mode sulfate occurs. The maximum of the net depletion occurs be-tween about 700 and 900 hPa. Here the transfer of Aitken mode sulfate into the accumulation mode due to continued growth of the particles is very efficient.
Sulfate in the accumulation mode is produced particularly in the lower troposphere. Here, condensation of sulfuric acid vapor and sulfate production by oxidation of SO2 in cloud
droplets are most efficient. About 100 hPa above this layer of net production, net depletion reaches its maximum. The most important sink in this region is removal of sulfate by wet deposition. With increasing height, the net depletion de-creases.
In the lower troposphere over Antarctica, a net production of accumulation mode sulfate is simulated, which is mainly caused by in-cloud oxidation of SO2 during summer. The
cloud formation in this region is driven by the meridional circulation called polar cell. SO2oxidized in cloud droplets
is likely produced from DMS emitted from the ocean, in par-ticular during Antarctic summer.
4.5 Black carbon mass
In contrast to sulfate, black carbon is released exclusively by emissions of primary particles at the surface. The net production of BC is limited to the boundary layer above the source regions (Fig. 13). In the Aitken mode, net depletion takes place in all layers above the lowermost model level, which decreases with height due to decreasing particle con-centrations. The vertical structure of the accumulation mode change rate features a slightly thicker layer of net production in the lower boundary layer, which is related to emissions at the surface in the lowermost model level and Aitken parti-cles growing into the size-range of the accumulation mode. In the tropics and in the northern mid-latitudes, strong net depletion takes place at about 750–800 hPa and about 800-950 hPa, respectively. These maximum net depletion rates are related to efficient wet deposition. Because of the lower scavenging efficiency of Aitken particles, these features are only prominent in the vertical distribution of the accumula-tion mode. With increasing height, the net depleaccumula-tion rates in the accumulation mode decrease due to decreasing particle concentrations.
100 200 300 400 500 600 700 800 900 1000 pressure (hPa)
SO
4mass change rate
90°S 60°S 30°S 0° 30°N 60°N 90°N Aitken mode 100 200 300 400 500 600 700 800 900 1000 pressure (hPa) 90°S 60°S 30°S 0° 30°N 60°N 90°N accumulation mode −100−50 −20 −10 −5 −2 −1 −0.5−0.2 −0.1 0 0.1 0.2 0.5 1 2 5 10 20 50 100 [µg/(m3 a)]
Fig. 12. As Fig. 11, but for sulfate mass concentration.
100 200 300 400 500 600 700 800 900 1000 pressure (hPa)
BC mass change rate
90°S 60°S 30°S 0° 30°N 60°N 90°N Aitken mode 100 200 300 400 500 600 700 800 900 1000 pressure (hPa) 90°S 60°S 30°S 0° 30°N 60°N 90°N accumulation mode −100−50 −20 −10 −5 −2 −1 −0.5−0.2 −0.1 0 0.1 0.2 0.5 1 2 5 10 20 50 100 [µg/(m3 a)]
Fig. 13. As Fig. 11, but for black carbon mass concentration.
5 Conclusions
In this study, we analyzed a multiannual simulation of the global submicrometer aerosol performed with the new model system ECHAM4/MADE. Detailed aerosol physics such as coagulation, condensation and nucleation of sulfuric acid va-por, size-dependent wet and dry deposition and cloud pro-cessing of aerosols have been taken into account. Thus, in contrast to most current climate models using aerosol clima-tologies or simulating particle mass only, ECHAM4/MADE allows the calculation of the particle number concentration and aerosol size-distribution. This allows a more detailed in-sight into the global aerosol cycles than previous model stud-ies. The climatological model data have been used to char-acterize the properties of submicrometer particles in terms of a global assessment. Aerosol properties such as chemi-cal composition, number concentration, size-distribution and
atmospheric residence time have been assessed. The model results reveal the following major features of the global sub-micrometer aerosol:
High aerosol mass and number concentrations are found in particular over the highly populated continental areas in the northern hemisphere where aerosol sources are domi-nated by emissions from fossil fuel combustion. In addition, high aerosol loadings occur over Africa and South America where biomass burning is the major source of submicrome-ter particles. Also mineral dust and sea salt particles have an important contribution to the aerosol mass loading of submi-crometer particles. Nevertheless, due to large particle sizes, their impact on the number concentration of the submicrom-eter aerosol is comparably small. Overall, the simulated ge-ographical patterns of aerosol mass corroborate the results of previous studies, including those considering aerosol mass only. The simulation of different particle size-ranges