HAL Id: hal-00296226
https://hal.archives-ouvertes.fr/hal-00296226
Submitted on 14 May 2007
HAL is a multi-disciplinary open access
archive for the deposit and dissemination of
sci-entific research documents, whether they are
pub-lished or not. The documents may come from
teaching and research institutions in France or
abroad, or from public or private research centers.
L’archive ouverte pluridisciplinaire HAL, est
destinée au dépôt et à la diffusion de documents
scientifiques de niveau recherche, publiés ou non,
émanant des établissements d’enseignement et de
recherche français ou étrangers, des laboratoires
publics ou privés.
On the diurnal variability of particle properties related
to light absorbing carbon in Mexico City
D. Baumgardner, G. L. Kok, G. B. Raga
To cite this version:
D. Baumgardner, G. L. Kok, G. B. Raga. On the diurnal variability of particle properties related to
light absorbing carbon in Mexico City. Atmospheric Chemistry and Physics, European Geosciences
Union, 2007, 7 (10), pp.2517-2526. �hal-00296226�
Atmos. Chem. Phys., 7, 2517–2526, 2007 www.atmos-chem-phys.net/7/2517/2007/ © Author(s) 2007. This work is licensed under a Creative Commons License.
Atmospheric
Chemistry
and Physics
On the diurnal variability of particle properties related to light
absorbing carbon in Mexico City
D. Baumgardner1, G. L. Kok2, and G. B. Raga1
1Centro de Ciencias de la Atm´osfera, Universidad Nacional Aut´onoma de M´exico, Mexico 2Droplet Measurement Technologies, Boulder, Colorado, USA
Received: 8 January 2007 – Published in Atmos. Chem. Phys. Discuss.: 31 January 2007 Revised: 5 April 2007 – Accepted: 18 April 2007 – Published: 14 May 2007
Abstract. The mass of light absorbing carbon (LAC) in
indi-vidual, internally mixed aerosol particles was measured with the Single Particle Soot Photometer (SP2) in April of 2003 and 2005 and evaluated with respect to concentrations of carbon monoxide (CO), particle bound polycyclic aromatic hydrocarbons (PPAH) and condensation nuclei (CN). The LAC and CO have matching diurnal trends that are linked to traffic patterns and boundary layer growth. The PPAH reaches a maximum at the same time as CO and LAC but returns rapidly back to nighttime values within three hours of the peak. The number of particles containing LAC ranges between 10% to 40% of all particles between 150 nm and 650 nm and the mass is between 5% and 25% of the total mass in this size range. The average LAC equivalent mass diameter varies between 160 and 230 nm and the thinnest coating of non-light absorbing material is observed during periods of maximum LAC mass. The coating varies between 10 nm and 30 nm during the day, but is a strong function of particle size. The mass absorption cross sections, σabs, de-rived from the SP2, are 5.0±0.2 m2g−1and 4.8±0.2 m2g−1, dependent on the optical model used to describe LAC mix-tures. The LAC contributes up to 50% of the total light ex-tinction in the size range from 100 nm to 400 nm. The esti-mated emission rate of LAC is 1200 metric tons per year in Mexico City, based upon the SP2 measurements and correla-tions between LAC and CO.
1 Background
The environmental impact of atmospheric aerosols is multi-faceted as a result of the wide range in concentration and size, complexity of chemical composition and optical properties that contribute to their role in global climate change (Charl-Correspondence to: D. Baumgardner
(darrel@servidor.unam.mx)
son et al., 1992), photochemistry (Dickerson et al., 1997; Ja-cobson, 1998; Raga and Raga, 2000) and cloud processes (Hobbs, 1991). Light absorbing carbon (LAC) often referred to as black carbon or soot1 is an anthropogenic component of atmospheric particles whose environmental impact has been recognized for more than 100 years (Novakov, 1982). These ubiquitous particles found throughout the world’s at-mosphere and produced primarily by incomplete combustion of fossil fuel and biomass burning (Ghan and Penner, 1992), may have much longer lifetimes than other types of aerosol particles.
The climatic importance of LAC is a result of the high ef-ficiency with which it scatters and absorbs light over a wide range of solar and infrared wavelengths. This is highlighted by comparing the efficiency with which radiant energy is removed by LAC and ammonium sulfate. This latter com-pound is commonly found mixed with LAC (Johnson et al., 2005). Figure 1 illustrates the difference in extinction effi-ciency between these two types of particles at 550 nm, the wavelength of maximum solar radiance. The extinction was calculated incorporating Mie theory (Bohren and Huffman, 1983) and assuming spherical particles with the refractive indices of ammonium sulfate (1.43–0.0i) and LAC (1.95– 0.79i) at this wavelength (Volz, 1972; Bond and Bergstrom, 2006).
For diameters smaller than 300 nm, LAC has an extinc-tion efficiency that is larger than sulfate by several orders of magnitude and is comparable at larger diameters. Although the number concentration of LAC in the free troposphere 1Bond and Bergstrom (2006) evaluate in detail the light
absorp-tion by carbonaceous particles and discuss the various terminolo-gies that have been used to describe particles that contain carbon. Given that the measurements discussed in the current manuscript are made with an instrument that utilizes the property of light ab-sorption by some forms of carbon, we will use the term suggested by Bond and Bergstrom, light absorbing carbon (LAC), throughout the remainder of this article.
0.001 0.01 0.1 1 Diameter (µm) 1E-009 1E-008 1E-007 1E-006 1E-005 1E-004 1E-003 1E-002 1E-001 1E+000 1E+001 S in g le P a rt ic le E x ti n c to n E ff ic ie n c y λ = 550 nm Sulfate (m = 1.43 -0.0i) LAC (m = 1.95 - 0.79i)
Fig. 1. The extinction efficiency of LAC (solid) is compared with
that of ammonium sulfate (dashed).
is generally less than that of sulfate aerosols its impact on radiative fluxes can be similar. Furthermore, as shown by recent modeling and laboratory studies (Bond et al., 2006; Mikhailov et al., 2006) coatings of non-light absorbing ma-terial on the surface of LAC will enhance the absorption ef-ficiency by factors of 1.5 to 2.5.
The optical properties of LAC must be taken into account when interpreting measurements by remote sensors such as lidars, sun photometers and satellites. The algorithms that are applied for extracting information from these measurements incorporate assumptions about the shape of the size distri-bution, the composition and optical characteristics. In some cases the objective is to derive particle properties whereas in other applications aerosols are a source of interference to be removed. Many years of airborne and ground based measure-ments have contributed to the parameterization of aerosol properties to use in these algorithms; however, until recently, very few measurements had been made of the size differenti-ated LAC characteristics.
The study described herein is a particle by particle evalua-tion of LAC properties in Mexico City, the diurnal trends and the links to other related anthropogenic gases and aerosols. The remainder of the paper describes the instrumentation, evaluates the physical and optical characteristics of LAC and discusses the relationships between primary emissions and meteorological processes with respect to the aerosol proper-ties.
2 Measurement and analysis methodology
The measurements were made with a Single Particle Soot Photometer2 (SP2), a nephelometer and Particle Soot Aerosol Photometer3(PSAP), a Photoelectric Aerosol Sen-sor4 (PAS-2000) and a condensation nucleus (CN) counter (TSI Model 30105).
2.1 LAC physical properties
The SP2 employs a patented technique (Stephens et al., 2003) that combines the principles of light scattering, absorp-tion and emission to derive the diameter, mass and incandes-cence temperature of individual aerosol particles in the diam-eter range (for the current study) from 150 to 600 nm (Baum-gardner et al., 2004; Schwarz et al., 2006; Moteki and Kondo, 2006). Particles enter the sample cavity of the SP2 (the typ-ical sample flow rate for the instrument is 2 cm3s−1) and while passing through the beam of a diode-pumped Nd:YAG laser (1.064 µm wavelength) they scatter and absorb light. Two cones of scattered light, 30◦–60◦ and 120◦–150◦, are collected by the optics and focused on a photodetector that produces a voltage signal proportional to the scattering in-tensity. Particle diameter is derived from the scattered light using classical Mie theory.
Particles that contain material that absorbs light at the wavelength of the laser are heated and reach a temperature at which they incandesce and emit light at a wavelength that is a function of the temperature. Two detectors, each with filters for passing different wavelengths, measure the emitted light. The temperature is derived from the ratio of signals from these detectors (Baumgardner et al., 2004; Schwarz et al., 2006; Moteki and Kondo, 2006). The intensity of the emitted light is proportional to the mass of the light absorb-ing material and the temperature of incandescence identifies the composition.
Calibration of the SP2 is carried out with commercially available spherical particles. Monodispersed, polystyrene la-tex spheres are used to calibrate the scattering signals and glassy carbon spheres of known density were size-selected with an electrostatic classifier for calibration of the incandes-cence signals. Incandescing particles are sized in the range of 3–300 fg/particle (120 to 650 nm mass equivalent diameter at 1.42 g cm−3density). The optical diameter is derived from the scattering signal and ranges from 100 to approximately 400 nm, depending on the assumed refractive index. The scattering and incandescence signals are recorded particle-by-particle such that the instrument is sensitive to very low concentrations of LAC.
The thickness of the non-light absorbing coating on each LAC containing particle is estimated by comparing the mass
2Droplet Measurement Technologies (DMT), Boulder, CO. 3Radiance Research, Seattle, WA
4Ecochem Analytic, West Hills, CA
D. Baumgardner et al.: Particle properties related to black carbon in Mexico City 2519 equivalent diameter, Dmass eqv, of the LAC with the optical
diameter, Doptical, of the coated particle. The mass equivalent diameter is derived from
Dmass eqv= (6MLAC/πρ)1/3 (1)
And the layer thickness, W, is
W = (Doptical− Dmass eqv)/2 (2)
where MLAC is the LAC mass, ρ is the assumed density of the LAC in the particle, taken here to be 1.90 g cm−3(Bond and Bergstrom, 1999), and Doptical is the diameter of the coated particle estimated from the light scattering signal.
An advantage of the SP2’s optical design is that the collec-tion of scattered light over a wide solid angle decreases the sensitivity of the derived optical diameter to variations in the refractive index. As seen in Fig. 2, using the ammonium sul-fate and LAC particles as an example, the scattering cross sections are similar even though the refractive indices are quite different. In the current study, the derivation of Doptical from the scattering signal assumes ammonium sulfate when there is no incandescence and an average mixture of 50% LAC and 50% ammonium sulfate by mass when there is in-candescence. The components of the assumed mixture are based upon an analysis by Johnson et al. (2005) who found that a large majority of the LAC were mixed with ammo-nium sulfate. The 50% mixture is an estimate based upon the average mixing fraction, Dmass eqv/Doptical, derived from the SP2. As will be discussed below, this fraction varied between 30 and 60%. The average refractive index for this mixture is 1.72–.40i. The choice of this refractive index limits the un-certainty in derived diameter to a maximum of ±30 nm as shown by the box drawn in Fig. 2. It is important to note that the measured MLAC is insensitive to the depth of the non-light absorbing coating (Slowik et al., 2006; Moteki and Kondo, 2006).
In addition to the uncertainty in Dopticaldue to the assump-tion of refractive index, an addiassump-tional error arises due to the heating of the particle by light absorption when it contains LAC. As pointed out by Gao et al. (2007), the diameter de-rived from the scattering peak measured by the SP2 will be an underestimate when the particle has a core of LAC. This is because the particle will begin heating as it enters the beam and the size will begin to decrease as the material evaporates. The rate at which it evaporates will depend on the amount of LAC and the volatility of the non-LAC material. There is a technique for obtaining a more accurate estimate of the parti-cle size prior to the point at which it begins to evaporate (Gao et al., 2007) but it requires a hardware modification that the SP2 in the present study did not have. Hence, although it is likely that the Doptical for particles containing LAC will be an underestimate, and the subsequent thickness of the layer that is derived from Eq. (2) will also be an underestimate, we can only estimate the magnitude of the error.
0.1 0.2 0.3 0.4 0.5 0.6 0.7 0.8 Diameter (µm) 1E-014 1E-013 1E-012 1E-011 1E-010 1E-009 1E-008 Sc a tt e ri n g C ro s s Se c ti o n (c m 2) λ = 1064 nm Sulfate (m = 1.48 -0.0i) LAC (m = 1.95 - 0.79i) sulfate-LAC mixture (50/50)
Figure 2 Scattering cross sections for sulfate (red) and LAC (black) and a 50/50 Fig. 2. Scattering cross sections for sulfate (red) and LAC (black)
and a 50/50 mixture of sulfate and LAC (orange) particles as a func-tion of particle size for the collecfunc-tion angles (30◦–60◦and 120◦– 150◦) and wavelength of the SP2 laser.
A detailed description of the theory of operation, uncer-tainties in determining the size and mass of LAC and mea-surement limitations are documented elsewhere (Schwarz et al., 2006; Moteki and Kondo, 2006). For the interpretation of the measurements presented in the present study, the es-timated uncertainties in LAC mass, Doptical, Dmass eqv and coating thickness are ±20%, ±50%, ±30% and ±58%, re-spectively.
2.2 LAC optical properties
The scattering, absorption and extinction coefficients, Bscat, Babs and Bext, at an incident wavelength of λ=550 nm, are derived for individual particles measured by the SP2 using optical efficiencies calculated from Mie theory (Bohren and Huffman, 1983) and assuming that the particles are spheri-cal. Two approaches were taken to calculate the optical pa-rameters based upon the fraction of LAC in a particle. The first approach that is designated “mixed”, assumes a homo-geneous mixture of LAC with the non-light absorbing mate-rial. A look-up table was generated that contains refractive indices for particles in the size range of the SP2 and with 21 mixtures of LAC with a refractive index of 1.95–0.79i and ammonium sulfate with refractive index of 1.48–0.00i. The volumetric fraction of LAC in a particle is varied between 0 and 1 in 0.05 steps and the refractive index of the mixture is computed using the volume mixing rule (Bohren and Huff-man, 1983). For example a particle containing 10% LAC by volume will have a refractive index of (0.9*1.48+0.1*1.95)– 0.1*0.79i. The second approach, following the suggestion of
Bond and Bergstrom (2006) assumes that all LAC in a parti-cle is concentrated in a core that is encapsulated with a layer of ammonium sulfate. In this case, the look-up table has the same number of categories with LAC fraction varying be-tween 0 and 1, but the optical properties are calculated using the optical shell model of Bohren and Huffman (1983). The results from this second approach are labeled “coated” in the later discussions.
The scattering, absorption and extinction coefficients and the single scattering albedo are computed by determining the fraction of LAC in each particle and finding the opti-cal parameters associated with this fraction in the “mixed” and “coated” lookup table. The LAC fraction is computed from the cube of the ratio of Dmass eqv to Doptical. The ab-sorption coefficient, normalized by the LAC mass, is calcu-lated and referred to here as the mass absorption cross section (MAC), σabs, following the terminology suggested by Bond and Bergstrom (2006).
An independent measurement of Babswas made with the PSAP, an instrument that uses the integrating plate technique (Bond et al., 1999). Particles are collected on a filter and the transmission of green light through this filter is measured in real time. By definition, the value of Babsis
Babs= (A/V ) ln(I /I0) (3)
where I and I0are the transmitted and incident light inten-sities, A is the area of the filter covered by aerosol particles and V is the volume of air that passed through the filter to deposit a given layer of particles. The source of incident ra-diation in the PSAP is a light emitting diode (λ=550 nm) and particles are collected on a 10 mm diameter quartz filter. The light is transmitted through a second filter, unexposed to am-bient air, and is the reference for the incident radiation, I0. Detailed laboratory studies of these instruments (Bond et al., 1999) have arrived at an empirical correction to Eq. (3) that accounts for the scattering of the aerosol on the collection filter.
Babs= (Babs measured− 0.40Bscat mreasured)/2.2 (4) Babs measured is the absorption coefficient derived from (3) and Bscat mreasuredis the scattering coefficient measured with a nephelometer. This equation corrects for the effects of light scattering from particles on the filter, an interference that de-creases the transmission through the filter, and for matrix ef-fects of the quartz fibers that also enhance the measured at-tenuation and lead to overestimates of Babs. Additional cor-rections are made for variations in the diameter of the aerosol deposit and changes in flow volume related to the differences in the altitude of Mexico City and Seattle, Wa, where the in-strument flow meter was calibrated.
2.3 Particle chemistry
Particle-bound polycyclic aromatic hydrocarbon (PPAH) was measured with the PAS 2000 that uses 207 nm light from
an Excimer lamp with energies of 6.7 eV. Compounds on the surface of particles that have ionization potentials below the energy of the incident photons will release an electron that is subsequently removed with an ion trap. The positively charged particle is collected on a filter that is connected to an electrical ground and the electrical potential between the ion trap and positively charged filter creates an electrical cur-rent, proportional to the number of ions that reach the filter per unit time and is measured with an electrometer. The ion-ization potentials of PPAH on the surfaces of particles are generally below the energy of the incident photons; however, the PAS is also sensitive to elemental carbon that has a work function of 4.4 eV. Some other organic compounds can also be ionized (Matter et al., 1999) and contribute to the signal from the PAS; hence, the signal from the PAS should be sidered a relative, rather than absolute, indicator of the con-centration of mixtures of PPAH, elemental carbon and some trace amounts of other organics. The manufacturer cautions that the PAS must be carefully calibrated with the aerosol mixture being studied if the results are to be interpreted quan-titatively. This type of calibration is difficult, if not impos-sible, for an urban environment where the aerosol mixture will change significantly depending on the relative fractions of elemental carbon and organics. Given the uncertainties in absolute value, the results from the PAS will be reported as a mass concentration of PPAH∗, where the asterisk indicates that this quantity is only a relative indicator of PPAH.
Carbon monoxide was not part of the instrument package used in the current study; however, it is a useful tracer for pri-mary emissions and can also indicate changes in the height of the boundary layer (Baumgardner et al., 2003). The CO used in the following analysis is from measurements made with the Mexico City pollution monitoring network, Red Auto-matica de Monitoreo Ambiental (RAMA). Two RAMA sta-tions are within five kilometers of the measurement site dis-cussed below. The hourly CO values from these stations were averaged to obtain the data reported here.
3 Results
The measurement site is on the roof of the building of the Centro de Ciencias de la Atm´osfera (CCA) inside the campus of the Universidad Nacional Aut´onoma de M´exico (UNAM). The university is located in the southwest quad-rant of the Mexico City basin and the CCA building (19.6◦N,
99.10◦W) is 2288 m above sea level. The university campus
is in a residential area with no significant industrial or com-mercial activities; however, nearby there is a steady flow of auto and bus traffic related to the circulation of university staff and students. Approximately 400 m to the southeast is the subway terminal where more than 400 buses collect pas-sengers daily (Peralta et al., 2006).
The particle instrumentation was connected to a common manifold that draws its air from a fifteen meter chimney
D. Baumgardner et al.: Particle properties related to black carbon in Mexico City 2521 0 1 2 3 4 C a rb o n Mo n o x id e ( p p m ) 0 10000 20000 30000 40000 C N C o n c e n tr a ti o n ( c m -3) 0 40 80 120 PPA H (n g m -3) (a) (b) (c) 04:00 08:00 12:00 16:00 20:00 24:00 04:00 08:00 12:00 16:00 20:00 24:00 04:00 08:00 12:00 16:00 20:00 24:00
Fig. 3. Typical diurnal evolution derived from averaging all
sam-pling days, for (a) CO, (b) CN, and (c) PPAH∗. The vertical bars indicate one standard deviation and represent an estimate of the day-to-day and year to year variability.
ventilated at a rate of approximately 90 l min−1. All the
in-struments except the SP2 were operated 24 h a day. The data reported here are from 27 April to 1 May 2003 and 2–8 April 2005. The same SP2, CN counter, PSAP and nephelometer were used in both years. The SP2 was only operated from 07:00 to 18:00 LST in 2003 but made measurements 24 h a day in 2005. The PPAH∗results are only from the 2005 cam-paign. Unless noted otherwise, the data discussed below rep-resent a compilation from both years, with the exception of the PPAH∗.
The CN concentration, Bscat, and Babs were output to the data system at 1 Hz and the PPAH∗ measurements are six second averages. The SP2 records information on every par-ticle; however, as a result of the very high data rates and large quantity of data, this instrument was set to record data during a one minute period out of every ten minutes. All of the pa-rameters were averaged over ten minute intervals; however, the RAMA CO data were only available as hourly averages.
Examination of the time series for CN, CO and PPAH∗ (Figs. 3a–c) indicates a reproducible diurnal pattern with the daily maxima occurring at approximately the same time each day. These figures are averages over the entire sampling
pe-160 180 200 220 240 L A C M a s s D ia m e te r( n m ) 0 0.1 0.2 0.3 0.4 0.5 L A C C o n c e n tr a ti o n F ra c ti o n 0 0.05 0.1 0.15 0.2 0.25 L A C M a s s F ra c ti o n 10 15 20 25 30 35 A v e ra g e C o a ti n g T h ic k n e s s ( n m ) 04:00 08:00 12:00 16:00 20:00 (b) (c) (f) (e) 0 1000 2000 3000 4000 L A C Ma s s ( n g m -3) 3 4 5 6 7 8 M a s s A b s o rp ti o n C ro s s S e c ti o n ( m 2g -1) Mixed model Shell model
Bond and Bergstrom (2006)
(a)
(d)
04:00 08:00 12:00 16:00 20:00 04:00 08:00 12:00 16:00 20:00 04:00 08:00 12:00 16:00 20:00
04:00 08:00 12:00 16:00 20:00 04:00 08:00 12:00 16:00 20:00
Figure 4 As in Fig. 4 but for a) LAC mass, b) LAC D , c) LAC concentration Fig. 4. As in Fig. 4 but for (a) LAC mass, (b) LAC Dmass−eqv,
(c) LAC concentration fraction, (d) LAC mass fraction, (e)
Aver-age thickness of coating on the LACC and f) mass absorption cross section assuming either a mixing (red) or shell (blue) optical model for coated LAC. The dashed line in (f) represents the value recom-mended by Bond and Bergstrom (2006).
riod, a total of 14 days from 2003 and 2005. The standard deviation about the averages, indicated by the vertical bars, is a measure of the day to day and year to year variability. Given that these measurements are from 2003 and 2005, the relatively low standard deviation suggests that these diurnal trends did not change significantly between the two years, either in the peak magnitudes or the time of the maxima. Note that the values of CO, CN, PPAH∗all increase rapidly at approximately 06:00 LST from very low and fairly constant nighttime values. Larger day-to-day variability, represented by the standard deviations, is evident in all parameters until sunset (∼19:00 LST) except for PPAH∗which decreases sig-nificantly both in magnitude and variability after 10:00 LST. Figures 4a–f show the daily averages of the LAC mass concentration, Dmass eqv, the ratios of the LAC number and mass concentrations to the total concentrations, the coating thickness of non-light absorbing material on the LAC and the derived mass absorption cross section, MAC. As in Fig. 3, the time series in each panel represent averages over the 14 days. All of the parameters shown in Figs. 3 and 4, ex-cept Dmass eqv, show trends that are dominated by two pro-cesses: 1) primary emissions from fossil fuel combustion and
0.1 0.2 0.3 0.4 Diameter (µm) 0 2000 4000 6000 ∆ N /∆ D - L A C ( c m -3µ m -1) 0.1 0.2 0.3 0.4 Diameter (µm) 0 2000 4000 6000 8000 ∆ N /∆ D - N o L A C (c m -3µ m -1) (a) (b) 0.1 0.2 0.3 0.4 0.5 0.6 0.7
Mass Equivalent Diameter (µm)
0 2 4 6 8 L A C ∆ M/ ∆ D (µ g m -3µ m -1) 0000 - 0400 0400 - 0800 0800 - 1200 1200 - 1600 0.1 0.2 0.3 0.4 Diameter (µm) 20 40 60 80 100 L A C C o a ti n g T h ic k n e s s ( n m ) (c) (d)
Fig. 5. These size distributions are daily averages every four hours,
from midnight until 16:00 LST, for the 14 days of sampling, and show the number concentrations of particles with no LAC (a), with LAC (b), the LAC mass concentration (c) and the thickness of coat-ing on the LAC particles (d).
2) mixing and dilution. Combustion of gasoline and diesel fuel is the primary source of CO and LAC, respectively, in Mexico City (Baumgardner et al., 2002). The onset of major vehicular movement is at 06:00 LST and continues unabated throughout the day until approximately 2000 (PROAIRE, 1997). Figures 3a and 4a show that CO and LAC mass reach their peak at 08:00 LST. Further increase in near-surface con-centration is limited by the growth of the boundary layer after sunrise due to surface heating (Whiteman et al., 2000) that leads to turbulent mixing and dilution of gases and particles (Fast et al., 1998; Raga et al., 1999). The decrease observed in the CO and LAC mass after 09:00 LST is a result of this process.
Although the maximum period of traffic is from 06:00 to 18:00 there is continuing vehicular activity 24 h a day, as is seen by the non-rush hour levels of CO and LAC mass of 0.5 ppm and 1000 ng m−3. The total particle concentration, represented by the CN measurements (Fig. 3b), follows a similar trend as CO and LAC mass. The CN rarely decreases below 10 000 cm−3and only during the nighttime when day-to-day variability is at a minimum. Of all the environmen-tal variables measured only the PPAH∗decreases to values below its detection limit of 5 ng m−3. The PPAH∗reaches a
maximum at the same time as the CN, indicating that the ma-jority of the particles containing PAH are quite small, those that dominate the CN concentration.
The average mass equivalent diameter (Fig. 4b) varies only slightly throughout the day except for a one hour period from 05:00 to 06:00, when there is an abrupt increase from 165 to 230 nm. The source of this shift is unknown at this time. As seen in Figs. 3c and d, the relative fraction of particles that contain LAC and the relative amount of LAC mass in the particles increases during the morning rush hour. The frac-tion of particles that have LAC increases by a factor of four from 10% to 40% from 06:00 to 10:00 LST and the fraction of LAC mass increases by a factor of five from 5% to 25% of the total mass. The thickness of the coating of non-light absorbing material on the LAC reaches its minimum at the hour of maximum LAC mass then increases to its maximum thickness at 16:00 before decreasing in the late afternoon and early evening.
The mass absorption cross sections, derived using both the homogeneous mixture and shell models for the LAC, change only slightly during the day between 4.5±0.2 and 5.0±0.2 m2g−1. The minimum occurs when the LAC mass reaches its peak. These values of MAC are within the range reported in the literature but are somewhat less than the value of 7.5±1.2 m2g−1suggested by Bond and Bergstrom (2006) for fresh LAC. These are also less than the 8–10 m2g−1 es-timated by Barnard et al. (2005) from column measurements made with photometers.
The distributions as a function of diameter for the number concentration with and without LAC, LAC mass concentra-tion and coating thickness are presented in Figs. 5a–d. The measurements were separated into six, four hour time periods and averaged over all days. The four curves in each panel are over the intervals 00:00–04:00, 04:00–08:00, 08:00–12:00 and 12:00–16:00. The time periods from 16:00–24:00 are not shown given that they are similar to the 12:00 to 16:00 spectra. We observe that the size distributions of particles with and without LAC have different diurnal trends. The non-LAC size distributions (Fig. 5a) increase in concentra-tions over all sizes between the first and third time period and the tail of the distribution continues to increase through-out the day, indicating that particles are growing, most likely through condensation. The mode of the distributions is at 160 nm.
The number concentration size distributions of particles containing LAC (Fig. 5b) are narrow from 08:00 to 12:00 with peaks at 130 nm and then broaden during the afternoon and early morning while still maintaining their maxima at 130 nm. This difference in the diameter of maximum concen-tration between the non-LAC and LAC distributions might be a result of the presence of LAC material that could be in-hibiting condensational growth. The alternative explanation is that the sizes, derived as optical diameters, are smaller as a result of the internal heating as the LAC absorbs light, an effect that was described earlier in this paper.
D. Baumgardner et al.: Particle properties related to black carbon in Mexico City 2523 The size distributions of the LAC mass, plotted as a
func-tion of mass equivalent rather than optical diameter (Fig. 5c), suggest that the maximum in mass might be found at a diam-eter smaller than the lower threshold of the SP2. The increas-ing mass concentration with sizes larger than 400 nm indicate that there is LAC mass at diameters larger than the 650 nm upper threshold. The LAC coating thickness (Fig. 5d) is a linear function of the optical diameter with very little sensi-tivity to the time of day. Given that internal heating may lead to an underestimate of Doptical from which the thickness is derived, the layer of the coating may also be underestimated.
4 Discussion
A detailed examination of the diurnal trends provides further insight with respect to the underlying processes that control the evolution of aerosol properties in Mexico City. The in-crease in the thickness of the coating on LAC (Fig. 5c), after its minimum at 08:00, is an indicator of the ageing of LAC as non-light absorbing material condenses on the surface. Sim-ilar thickening of the coating on ageing LAC has been mea-sured with an SP2 downwind of Tokyo (M. Shiraiwa, per-sonal communication).
The rapid decrease of PPAH (Fig. 3c), within four hours of its maximum, suggests a removal process related to pho-tochemical reactions. This behavior has been previously re-ported by Marr et al. (2006) who concluded that the rapid decay in PPAH is a result of secondary organic material that condenses on the PAH-containing particles. This suppresses the response of the PAS 2000; hence, not only is the evolu-tion of PPAH not linked to the diluevolu-tion, as is the case with related primary emission variables, but it also urges caution in using this type of analyzer for analyzing urban PPAH.
Figures 6a–c compare the absorption and scattering coef-ficients and the single scattering albedo determined directly from the nephelometer and PSAP (black curves) with those obtained indirectly from the SP2 measurements (red and blue curves). The Babsfrom the PSAP and SP2 are well correlated but the PSAP values are on average 2.3 times larger than the SP2. This difference is primarily a result of the lower and upper sizing limits of the SP2, as discussed previously. Ac-cording to estimates by Schwarz et al. (2006), the SP-2 loses approximately 40% of the LAC mass that is smaller than the lower size threshold. These estimates were based on log-normal fits to the mass size distribution and did not account for LAC that was larger than the upper size threshold. In ad-dition, the Schwarz et al. (2006) estimates were for LAC in the free troposphere whereas the LAC in the present study is within the highly polluted boundary layer and close to the source of emissions. Hence it is likely that in this environ-ment, more than 50% of the LAC is in particles smaller than 120 nm. Evidence that there are LAC larger than 650 nm is seen by Johnson et al. (2005) who saw clusters of car-bon particles larger than 1000 nm when evaluating Mexico
0 10 20 30 40 50 60 L A C C o n tr ib u ti o n to Ex ti n c ti o n (% ) 0.7 0.75 0.8 0.85 0.9 0.95 Si n g le Sc a tte ri n g A lb e d o PSAP+Neph Mixed Coated 0 10 20 30 40 Ba b s (Mm -1) PSAP Mixed Coated 04:00 08:00 12:00 16:00 20:00 (c) (b) (a) 0 50 100 150 200 250 300 350 400 Bs c a t (Mm -1) Nephelometer Mixed Coated (d) 04:00 08:00 12:00 16:00 20:00 04:00 08:00 12:00 16:00 20:00 04:00 08:00 12:00 16:00 20:00
Fig. 6. The evolution of the particle optical properties, derived from
averaging all sampling days, is compared here for Babs(a), Bscat
(b), and single scattering albedo (c), derived indirectly from the SP2
measurements (red and blue for the mixed and shell optical models) and directly from the nephelometer and PSAP (black). The contri-bution of the LAC to the total extinction is shown in panel (d).
City samples with electron microscopy. These clusters might have a mass equivalent diameter smaller than 1000 nm but their presence in a fairly small number of samples indicate that they might provide a measurable contribution to the to-tal mass of LAC and the light absorption. The difference be-tween the Babsderived from the SP2 using the homogeneous mixture (red curve in Fig. 6a) and the shell (blue curve) mod-els was insignificant. This was also observed in the deriva-tion of σabsusing the two models (Fig. 4f).
The Bscatmeasured by the nephelometer is approximately twice the value derived from the SP2 is due to the truncation of the SP2 measurements above 400 nm for the optical di-ameter. The single scattering albedo (SSA) derived from the PSAP and nephelometer is in much better agreement with that derived from the SP2 because the SSA derived from the SP2 is on a particle by particle basis and is only slightly af-fected by the truncation error.
The fraction of the total light extinction that is contributed by LAC-containing particles is shown in Fig. 6d indicating that these particles contribute as much as 50% of the total extinction in the morning during peak rush hour and approx-imately 10% during the remainder of the day. Figure 7 shows
0.1 0.15 0.2 0.25 0.3 0.35 Diameter (µm) 0 2 4 6 ∆ Be x t /∆ D (M m -1) 0000 - 0400 0400 - 0800 0800 - 1200 1200 - 1600
Figure 7 These size distributions of the extinction coefficient derived from the SP2 Fig. 7. These size distributions of the extinction coefficient derived
from the SP2 measurements are daily averages every four hours for the 14 days of sampling.
the size distributions of the extinction coefficient divided into four time periods. Here we see that the majority of the extinc-tion is from particles larger than 300 nm; however, it is clear that a large fraction of the extinction could be in particles larger than 400 nm. This figure also illustrates how particle growth during the day increases the extinction coefficient.
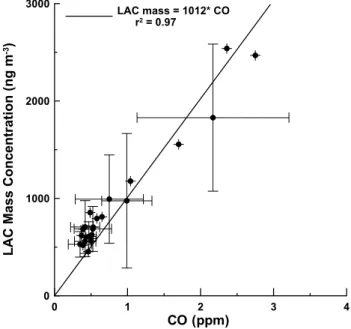
The CO concentrations are useful for inferring LAC when LAC measurements are not available (Baumgardner et al., 2002). As shown in Fig. 8 the LAC in Mexico City, mea-sured by the SP2, is related to the CO by a factor of 1012, one ppm of CO is associated with 1012 ng m−3 of BC. If we assume that the LAC outside of the SP2 measurement range can be estimated from the ratio of Babs measured by the PSAP and SP2, then the LAC to CO relationship is 2226. After adjusting to standard atmospheric pressure and temper-ature, and converting ppm to mg m−3, the LAC to CO rela-tionship is approximately one microgram of LAC for every milligram of CO. This equal to the relationship that was pre-viously derived by Baumgardner et al. (2002) based upon the Babs measured with the same PSAP but with LAC derived from evolved gas analysis of particles on filters. According to the 1999 inventory of emissions (PROAIRE, 1999), Mex-ico City produces approximately 1.2×10⁶metric tons of CO yearly. Using the LAC to CO relationship we predict 1200 metric tons of LAC emitted yearly in Mexico City. This is similar to the value of 1700±200 metric tons predicted by Jiang et al. (2006) who used measurements of Babsmeasured with an aethalometer to estimate black carbon mass.
0 1 2 3 4 CO (ppm) 0 1000 2000 3000 L A C M a s s C o n c e n tr a ti o n (n g m -3) LAC mass = 1012* CO r2 = 0.97
Figure 8 Relationship between BC mass and CO derived from present study, and Fig. 8. Relationship between BC mass and CO derived from present
study, and similar to that obtained in (Baumgardner et al., 2002).
5 Summary
Measurements of the LAC in individual, internally mixed aerosol particles were made with the SP2 in April of 2003 and 2005. The measurement technique uses light scatter-ing and incandescence to derive the optical and LAC mass equivalent diameters from which the coating of non-light ab-sorbing material can be estimated. Particle optical properties were also derived from the SP2 measurements and compared with those directly measured with a nephelometer and soot photometer. The characteristics of the LAC were compared with the CO, CN, and PPAH concentrations, environmental variables that are also linked to primary emissions.
The LAC, CO and CN have matching diurnal trends that are associated with traffic patterns and boundary layer growth. The LAC mass reaches a daily average maximum of 3000±1000 ng m−3but has a nighttime, background level of 1000 ng m−3. The number of particles containing LAC ranges between 10% to 40% of all particles between 100 nm and 400 nm and the LAC contributes between 5% and 25% of the total mass in this size range. The LAC particles have the thinnest coating of non-light absorbing material, about 12 nm, in the morning at 08:00 but increases to a maximum thickness of 30 nm by mid-afternoon as the LAC particles age.
The absorption coefficient derived from the SP2 is less than 50% of the direct measurements made with the PSAP, indicating that more than 50% of the LAC is in particles smaller than 100 nm or larger than 400 nm. LAC con-tributes to 50% of the total light extinction during the 07:00– 08:00 rush hour then decreases to approximately 10% the
D. Baumgardner et al.: Particle properties related to black carbon in Mexico City 2525 remainder of the day. LAC mass is emitted at a rate of 1200
metric tons per year in Mexico City, based upon the SP2 mea-surements and correlations between LAC and CO and taking into account the LAC outside of the size range of the SP2.
Acknowledgements. The SP2 was developed under Navy contract
#N00014-01-C-0335. We would like to thank A. Retama of the Mexico City environmental service for providing the CO data from the RAMA network.
Edited by: L. T. Molina
References
Baumgardner, D., Raga, G. B., Kok, G., Ogren, J., Rosas, I., Baez, A., and Novakov, T.: On the evolution of aerosol properties at a mountain site above Mexico city, J. Geophys. Res., 105, 22 243– 22 253, 2000.
Baumgardner, D., Raga, G., Peralta, O., Rosas, I., Castro, T., Kuhlbusch, T., John, A., and Petzold, A.: Diagnos-ing black carbon trends in large urban areas usDiagnos-ing carbon monoxide measurements, J. Geophys. Res., 107(D21), 8342, doi:10.1029/2001JD000626, 2002.
Baumgardner, D., Kok, G., and Raga, G.: Warming of the Arctic lower stratosphere by light absorbing particles, Geophys. Res. Lett., 31, L06117, doi:10.1029/2003GL018883, 2004.
Barnard, J. C., Kassianov, E. I., Ackerman, T. P., Frey, S., Johnson, K., Zuberi, B., Molina, L. T., Molina, M. J., Gaffney, J. S., and Marley, N. A.: Measurements of black carbon specific absorption in the Mexico City metropolitan area during the MCMA 2003 field campaign, Atmos. Chem. Phys., 7, 1645–1655, 2007 Bohren, C. F. and Huffman, D. R.: Absorption and Scattering of
Light by Small Particles, John Wiley, Hoboken, N.J., 1983. Bond, T. C., Anderson, T. L., and Cambell, D.: Calibration and
intercomparison of filter-based measurements of visible light ab-sorption by aerosols, Aerosol Sci. Technol., 30, 582–600, 1999. Bond, T. C. and Bergstrom, R. W.: Light absorption by
carbona-ceous particles: An investigative review, Aerosol Sci. Technol., 40, 27–67, 2006.
Bond, T. C., Habib, G., and Bergstrom, R. W.: Limitations in the enhancement of visible light absorption due to mixing state, J. Geophys. Res., 111(D20), D20211, doi:10.1029/2006JD007315, 2006.
Charlson, R. J., Scwartz, S. E., Hales, J. M., Cess, R. D., Coakely, J. A., Hanson, J. E., and Hoffmann, D. J.: Climate forcing by anthropogenic aerosols, Science, 255, 423–430, 1992.
Clarke, A. D., Shinozuka, Y., Kapustin, V. N., et al.: Size distribu-tions and mixtures of dust and black carbon aerosol in Asian out-flow: Physiochemistry and optical properties, J. Geophys. Res., 109, D15S09, doi:10.1029/2003JD004378, 2004.
Comisi´on Ambiental Metropolitana: Inventario de Emisiones de la Zona Metropolitana del Valle de M´exico, Secretar´ıa del Medio Ambiente, Gobierno de M´exico, M´exico, 2004.
Dickerson, R., Kondragunta, S., Stenchikov, G., Civerolo, K., and Doddridge, B.: The impact of aerosols on solar UV radiation and photochemical smog. Science, 278, 827–830, 1997.
Fast, J. and Zhong, S.: Meteorological factors associated with inho-mogeneous ozone concentrations within the Mexico City basin, J. Geophys. Res., 103, 18 927–18 946, 1998.
Fuller, K. A., Malm, W. C., and Kreidenweis, S. M.: Effects of mixing on extinction by carbonaceous particles, J. Geophy. Res., 104, 15 941–15 954, 1999.
Gao, R. S., Schwarz, J. P., Kelly, K. K., Fahey, D. W., Watts, L. A., Thompson, T. L., Spackman, J. R., Slowik, J. G., Cross, E. S., Han, J.-H., Davidovits, P., Onasch, T. B., and Worsnop, D. R.: A novel method for estimating light-scattering properties of soot aerosols using a modified single-particle soot photometer, Aerosol Sci. Technol., 41, 125–135, 2007.
Ghan, S. J. and Penner, J. E.: Smoke, effects on climate, in: Ency-clopedia of Earth System Science, Vol. 4, edited by: Nierenberg, W. A., Academic Press, San Diego, CA., 191–198, 1992. Hobbs, P. V.: Aerosol-Cloud-Climate Interactions, Academic Press,
Inc., New York, 480 pp., 1991.
Jacobson, M.: Studying the effects of aerosols on vertical photolysis rate coefficient and temperature profiles over an urban airshed, J. Geophys. Res., 103, 10 593–10 604, 1998.
Jiang, M., Marr, L. C., Dunlea, E. J., Herndon, S. C., Jayne, J. T., Kolb, C. E., Knighton, W. B., Rogers, T. M., Zavala, M., Molina, L. T., and Molina, M.: Vehicle fleet emissions of black carbon, polycyclic aromatic hydrocarbons, and other pollutants measured by a mobile laboratory in Mexico City, Atmos. Chem. Phys., 5, 3377–3387, 2005,
http://www.atmos-chem-phys.net/5/3377/2005/.
Johnson, K. S., Zuberi, B., Molina, L. T., Molina, M. J., Iedema, M. J., Cowin, J. P., Gaspar, J. D., Wang, C., and Laskin, A.: Processing of soot in an urban environment: case study from the Mexico City Metropolitan Area, Atmos. Chem. Phys., 5, 3033– 3043, 2005,
http://www.atmos-chem-phys.net/5/3033/2005/.
Kondo, Y., Komazaki, Y., Miyazaki, Y., Moteki, N., Takegawa, N., Kodama, D., Deguchi, S., Nogami, M., Fukuda, M., Miyakawa, T., Morino, Y., Koike, M., Sakurai, H., and Ehara, K.: Temporal Variations of Elemental Carbon in Tokyo, J. Geophys. Res., 111, D12205, doi:10.1029/2005JD006257, 2006.
Liousse, C., Cachier, H., and Jennings, S. G.: Optical and thermal measurements of black carbon aerosol content in different en-vironments: variation of the specific attenuation cross section, Atmos. Environ. Part A, 27, 1203–1211, 1993.
Marr, L. C., Dzepina, K., Jimenez, J. L., Reisen, F., Bethel, H. L., Arey, J., Gaffney, J. S., Marley, N. A., Molina, L. T., and Molina, M. J.: Sources and transformations of particle-bound polycyclic aromatic hydrocarbons in Mexico City, Atmos. Chem. Phys., 6, 1733–1745, 2006,
http://www.atmos-chem-phys.net/6/1733/2006/.
Matter, U., Siegmann, H. C., and Burtscher, H.: Dynamic field mea-surements of submicron particles from diesel engines, Environ. Sci. Technol., 33, 1946–1952, 1999.
Mikhailov, E. F., Vlasenko, S. S., Podgorny, I. A., Ramanathan, V., and Corrigan, C. E.: Optical Properties of Soot-Water Drop Agglomerates: An Experimental Study, J. Geophys. Res., 111, D07209, doi:10.1029/2005JD006389, 2006.
Moteki, N. and Kondo, Y.: Effects of mixing state on black car-bon measurement by Laser-Induced Incandescence, Aerosol Sci. Technol., 41, 398–417, 2007.
Novakov, T.: BC in the atmosphere, in: Particulate carbon: Atmo-spheric Life Cycle, edited by: Wolff, G. T. and Klimisch, R. L., Plenum Press, New York, 19–37, 1982.
Peralta, O., Baumgardner, D., and Raga, G. B.:
phy of Carbonaceous particles, J. Atmos. Chem., published on-line, doi:10.1007/s10874-007-9070-1, 2007.
Petzold, A., Kopp, C., and Niessner, R.: The dependence of the specific attenuation cross-section on black carbon mass fraction and particle size, Atmos. Environ., 31, 661–672, 1997.
P¨oschl, U.: Aerosol particle analysis: Challenges and progress, Anal. Bioanal. Chem., 375, 30–32, 2002.
PROAIRE:. Programa para mejorar la calidad del aire en el valle de M´exico: 1995–2000, Departamento del Distrito Federal; Go-bierno del Estado M´exico; Secretar´ıa de Medio Ambiente, Re-cursos Naturales y Pesca y Secretaria de Salud, 1st ed., pp. 244, Mexico, 1999.
Raga, G. B., Kok, G. L., Baumgardner, D., and Rosas, I.: Some aspects of boundary layer evolution in Mexico City, Atmos. En-viron., 33, 5013–5021, 1999.
Raga, G. B. and Raga, A.: On the formation of elevated ozone peak in Mexico City, Atmos. Environ., 34, 4097–4102, 2000. Raga, G. B., Baumgardner, D., Peralta, O., and Saavedra, M. I.:
Carbon content of size fractionated particles in Mexico City, European Aerosol Conference, 1–5 September 2003, Madrid, S477–S478, 2003.
Schuster, G. L., Dubovik, O., Holben, B. N., and Clothiaux, E. E.: Inferring black carbon content and specific absorption from AERONET retrievals, J. Geophys. Res.-Atmos., 101, 10–17, doi:10.1029/2004JD004548, 2005.
Schwarz, J. P., Gao, R. S., Fahey, D. W., Thomson, D. S., Watts, L. A., Wilson, J. C., Reeves, J. M., Baumgardner, D. G., Kok, G. L., Chung, S., Schulz, M., Hendricks, J., Lauer, A., K¨archer, B., Slowik, J. G., Rosenlof, K. H., Thompson, T. L., Langford, A. O., Lowenstein, M., and Aikin, K. C.: Single-particle measurements of mid latitude black carbon and light-scattering aerosols from the boundary layer to the lower stratosphere, J. Geophys. Res., 111, D16207, doi:10.1029/2006JD007076, 2006.
Seinfeld, J. H. and Pandis, S. N.: Atmospheric chemistry and physics, John Wiley and Sons, N.Y., 1326 pp, 1998.
Slowik, J. G., Cross, E., Han, J., Davidovits, P., Onasch, T. B., Jayne, J. T., Williams, L. R., Canagaratna, M. R., Worsnop, D. R., Chakrabarty, R. K., Arnott, W. P., Schwarz, J. P., Gao, R. S., Fahey, D. W., and Kok, G. L.: Intercomparison of instruments measuring black carbon content and optical properties of soot particles, Aerosol. Sci. Technol., 41, 295–314, 2007.
Stephens, M., Turner, N., and Sandberg, J.: Particle identification by Laser Induced Incandescence in a solid state laser cavity, Appl. Opt., 42, 3726–3736, 2003.
Twitty, J. T. and Weinman, J. A.: Radiative properties of carbona-ceous aerosols, J. Appl. Met., 10, 725–731, 1971.
Volz, F. E.: Infrared refractive index of atmospheric aerosol sub-stances, Appl. Opt., 11, 755–759, 1972.
Whiteman, C. D., Zhong, S., Bian, X., Fast, J. D., and Doran, J. C.: Boundary layer evolution and regional-scale diurnal circulations over the Mexico Basin and Mexican Plateau, J. Geophys. Res., 105, 10 081–10 102, 2000.