HAL Id: inserm-00112104
https://www.hal.inserm.fr/inserm-00112104
Submitted on 7 Nov 2006
HAL is a multi-disciplinary open access
archive for the deposit and dissemination of
sci-entific research documents, whether they are
pub-lished or not. The documents may come from
teaching and research institutions in France or
abroad, or from public or private research centers.
L’archive ouverte pluridisciplinaire HAL, est
destinée au dépôt et à la diffusion de documents
scientifiques de niveau recherche, publiés ou non,
émanant des établissements d’enseignement et de
recherche français ou étrangers, des laboratoires
publics ou privés.
connecting repetitive structures.
Laurent Fourrier, Cristina Benros, Alexandre de Brevern
To cite this version:
Laurent Fourrier, Cristina Benros, Alexandre de Brevern. Use of a structural alphabet for analysis of
short loops connecting repetitive structures.. BMC Bioinformatics, BioMed Central, 2004, 5, pp.58.
�10.1186/1471-2105-5-58�. �inserm-00112104�
BioMedCentral
BMC Bioinformatics
Open Access
Research article
Use of a structural alphabet for analysis of short loops connecting
repetitive structures
Laurent Fourrier
†, Cristina Benros
†and Alexandre G de Brevern*
Address: Equipe de Bioinformatique Génomique et Moléculaire (EBGM), INSERM E0346, Université Denis DIDEROT-Paris 7, case 7113, 2, place Jussieu, 75251 Paris Cedex 05, France
Email: Laurent Fourrier - [email protected]; Cristina Benros - [email protected]; Alexandre G de Brevern* - [email protected]
* Corresponding author †Equal contributors
Abstract
Background: Because loops connect regular secondary structures, analysis of the former depends
directly on the definition of the latter. The numerous assignment methods, however, can offer different definitions. In a previous study, we defined a structural alphabet composed of 16 average protein fragments, which we called Protein Blocks (PBs). They allow an accurate description of every region of 3D protein backbones and have been used in local structure prediction. In the present study, we use this structural alphabet to analyze and predict the loops connecting two repetitive structures.
Results: We first analyzed the secondary structure assignments. Use of five different assignment
methods (DSSP, DEFINE, PCURVE, STRIDE and PSEA) showed the absence of consensus: 20% of the residues were assigned to different states. The discrepancies were particularly important at the extremities of the repetitive structures. We used PBs to describe and predict the short loops because they can help analyze and in part explain these discrepancies. An analysis of the PB distribution in these regions showed some specificities in the sequence-structure relationship. Of the amino acid over- or under-representations observed in the short loop databank, 20% did not appear in the entire databank. Finally, predicting 3D structure in terms of PBs with a Bayesian approach yielded an accuracy rate of 36.0% for all loops and 41.2% for the short loops. Specific learning in the short loops increased the latter by 1%.
Conclusion: This work highlights the difficulties of assigning repetitive structures and the
advantages of using more precise descriptions, that is, PBs. We observed some new amino acid distributions in the short loops and used this information to enhance local prediction. Instead of describing entire loops, our approach predicts each position in the loops locally. It can thus be used to propose many different structures for the loops and to probe and sample their flexibility. It can be a useful tool in ab initio loop prediction.
Background
Since the first descriptions of protein structures by Pauling and Corey [1,2], their repetitive secondary structures have
been widely analyzed. They have been studied from two principal points of view – assignment and prediction.
Published: 12 May 2004
BMC Bioinformatics 2004, 5:58
Received: 04 February 2004 Accepted: 12 May 2004 This article is available from: http://www.biomedcentral.com/1471-2105/5/58
© 2004 Fourrier et al; licensee BioMed Central Ltd. This is an Open Access article: verbatim copying and redistribution of this article are permitted in all media for any purpose, provided this notice is preserved along with the article's original URL.
Different approaches can be used for assigning secondary structures to a 3D protein structure. The most common is DSSP [3], which is based on hydrogen bonding patterns. STRIDE [4] relies on the same criteria with slightly differ-ent parameters and computes backbone dihedral angles. DEFINE [5] uses an inter-Cα distance matrix that corre-sponds to ideal repetitive secondary structures. PCURVE [6] is based on the helicoidal parameters of each peptide unit and generates a global peptide axis. Finally, PSEA [7] bases its assignments only on the Cα position, using dis-tance and angle criteria. Not surprisingly, these methods do not assign the same state to all residues, especially those located at the beginning and end of repetitive struc-tures. For instance, DSSP, DEFINE and PCURVE only assign 65% of residues to the same state [8].
Several prediction methods have been developed [9], and accuracy rates climb to 80% with neural networks and sequence homology [10]. Secondary structures do not, however, entirely describe the 3D protein structure. Coils account for more than 40% of residues. In the conven-tional 3-state description, they are associated with only one state, defined as non-helicoidal and non-extended. The coil state is in fact composed of really distinct local folds, such as turns [11]. Several studies have attempted to analyze loops [12,13] and predict their conformations [14], but they still fail to take a significant portion of resi-dues into account.
Protein structure descriptions that use a library or set of small prototypes, i.e., N states rather than the conven-tional three, can help improve definitions of these regions and may also improve prediction. Such a library consti-tutes a structural alphabet [15,16] and is composed of structural prototypes. Because these describe all the local folds, repetitive structures as well as coils, they allow a bet-ter approximation of the entire protein structure. Thus, they can be used to reconstruct protein structures [17] or to predict the local structure [18]. In a previous study, we defined a structural alphabet composed of 16 protein frag-ments, each 5 residues in length, called Protein Blocks (PBs, cf. Figure 1) [19]. They have been used to describe 3D protein backbones [20-22] and to predict local struc-tures [19,23]. Our structural alphabet is particularly informative [24] and is thus useful for pre-processing before ab initio and new fold prediction.
We focus here on the study of small loops that connect two repetitive structures. We first analyze the classic sec-ondary structure assignments with the five above-men-tioned methods. Secondly, we describe the short loops with our structural alphabet and analyze the sequence-structure relationship in these local sequence-structures. Finally, we make local predictions based on the amino acid sequences.
Results
Secondary structure assignments
As noted by Woodcock et al. [25], a serious problem raised by the variety of methods for secondary structure assign-ment is that they often yield differing results. A consensus method has been proposed to lessen this effect [8]. Here we used an agreement rate, denoted as C3, which is the
proportion of residues associated with the same state. Table 1 summarizes the correspondence between the sec-ondary structure assignments from the five methods. It clearly highlights three points: (i) with its default param-eters, DEFINE yielded results very different from the other methods, as shown by its C3 values, close to 62%; (ii)
DSSP and STRIDE produced nearly identical assignments, with C3 equal to 95%. Of the remaining assignments, 4%
corresponded to confusion between α-helices and coils, and the remaining 1% to confusion between β-strands and coils; (iii) all the other comparisons gave a mean C3
of 80%, with 6–7% confusion between α-helices and coils and 12–13% between β-strands and coils.
In addition, DEFINE was the only method to confuse α-helices and β-strands. This confusion ranged from 2% to 5% between DEFINE and the other methods, while for all other comparisons, it was less than 0.05%. These results did not change when β-strands were described by 'E' (extended-strand participating in a β-ladder) and 'B' (res-idue in isolated β-bridge) [9] labels for DSSP and STRIDE rather than only 'E'.
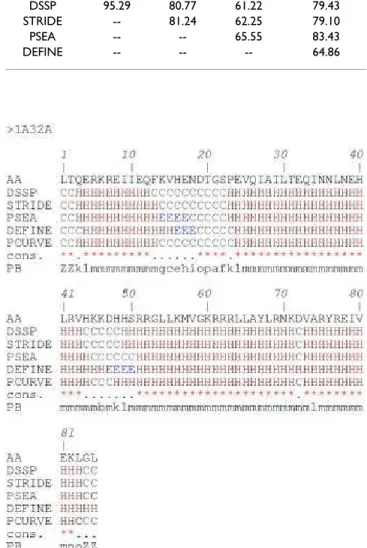
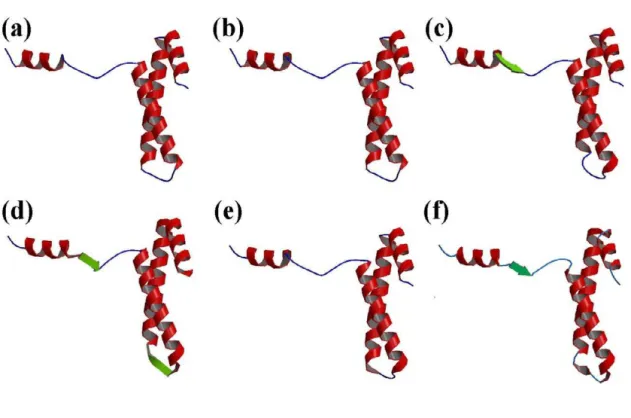
These results show the difficulties related to defining an appropriate length for α-helices, β-strands and coils and locating their ends [26]. These inaccuracies in defining the repetitive structures have direct repercussions on the defi-nition of loops. Figures 2 and 3 use the example of the ribosomal protein S15 from Bacillus Stearothermophilus (PDB code 1A32; another example, proto-oncogene Mtcp-1, PDB code 1A1X, is given [see Additional file 1 and Additional file 2]) to show the multiple secondary struc-ture assignments that can ensue. 79% of the residues are assigned to the same state, rather more than for many other proteins. The repetitive structure caps remain quite confusing (cf. Figure 3), however, despite good agree-ment. For instance, the C-cap of the first helix is defined over three residues, depending on the assignment method (positions 13 to 15). The connecting zone between helices 2 and 3 is fuzzy. DSSP and STRIDE assign positions 44– 48, PSEA 45–50 and PCURVE 45–47 as coils whereas DEFINE assigns positions 47–50 as a small β-strand. In this example, we see that the 16 Protein Blocks (PBs), labeled a-p, describe every part of the protein structures specifically. This description includes the repetitive tures, their edges, and the coils that the secondary struc-tures define only as non-helicoidal and non-extended.
BMC Bioinformatics 2004, 5 http://www.biomedcentral.com/1471-2105/5/58
Protein Blocks
Figure 1
Protein Blocks. From left to right and top to bottom, RASTER 3D [42,43] images of the 16 Protein Blocks of the structural
alphabet. Each prototype is five residues in length and corresponds to eight dihedral angles (φ,ψ). The PBs m and d can be roughly described as prototypes for the central α-helix and the central β-strand, respectively. For each PB, the N cap extrem-ity is on the left and the C-cap on the right.
Each PB is a fragment five residues long that corresponds to a local fold and is defined by eight dihedral angles. PBs m and d correspond roughly to the core of α-helices and
β-strands, respectively. In the example in Figure 2, several series of PB m accurately describe the helix cores. Where a secondary structure assignment method assigned a β-strand (PSEA, positions 14-17, DEFINE positions 16–18 and 47–50), the PB assignment gave PB b, or PB c and e, all close to β-strand geometry. Thus, PBs may explain the ambiguity of the assignments. In this case, PBs b, c and e can take the variability of the β-strand into account. The structural alphabet was more structurally informative (16 states instead of 3 states) and better approximated the protein backbone. It is thus a relevant alternative for describing loops.
Describing short loops in terms of Protein Blocks
Loops are defined as protein fragments that connect two series of PBs m and/or d and contain no repetitive PBs. Short loops have a length of 2 to 6 PBs. The short loop databank contains 3,319 fragments: 644 for mm/mm, 801 for dd/dd, 989 for dd/mm and 886 for mm/dd. Table 2 sum-marizes the properties of the PBs in the overall databank as well as in the loop and short loop databanks. We focused on the frequency of occurrence of PBs in these regions and on the main transitions between successive PBs, since previous studies observed only a limited number of transitions [19,23]. Table 2 points out the spe-cificities of the transitions of some PBs in the short loops (for comparison, this information on the PBs in the com-plete databank is given [see Additional file 3]).
We observed that PBs k, l, n, o and p were relatively more specific to short loops. Their frequencies were 1% higher in short loops than in all loops. Inversely, the frequency of PB b dropped from 9.0% in all loops to only 3.7% in short loops. Moreover, it was slightly less frequent in the short loops than in the overall databank (4.4%). The fre-quencies of the other PBs were the same in loops and short loops.
The transition frequencies between successive PBs varied substantially between the complete databank and the short loops. We noted three main categories. (i) The prin-cipal transitions became more pronounced for most PBs (i.e., 11). For example, the transition from PB a to PB c increased by more than 20% (50.9% versus 71.8%), c to d more than 20%, e to h more than 10%, f to k (24%) and l to m (15%). For PBs h, i, k, n, o, and p, the increase was smaller, ranging from +2 to +10%. (ii) For two PBs, the first preference transitions were inverted. The second most common transition of PB g (PB c) in the databank took over first place for short loops, and its frequency climbed from 28.0% to 39.7%. PB j was the fuzziest PB (rmsd = 0.74 Å) and had a high number of "main" transitions (6 with a transition rate greater than 10%). In the short loops, its third most common transition, PB l, becomes first (and its rate went from 16.1% to 25.0%). (iii) PB b
Table 1: Agreement index C3 between secondary structure
assignment methods. The index values measure the proportion of residues assigned to the same state by two methods.
STRIDE PSEA DEFINE PCURVE
DSSP 95.29 80.77 61.22 79.43
STRIDE -- 81.24 62.25 79.10
PSEA -- -- 65.55 83.43
DEFINE -- -- -- 64.86
Comparison of methods for secondary structure assignment
Figure 2
Comparison of methods for secondary structure assignment. Example of 5 assignments for the ribosomal
protein S15 from Bacillus Stearothermophilus (PDB code 1A32). The figure shows the amino acid sequence (AA), the secondary structure assignments by (DSSP), (STRIDE), (PSEA), (DEFINE), (PCURVE) with 'H' for the α-helix, 'E' for the β-strand and 'C' for the coil, (cons.) is a simple consensus with a star (*) if the five methods agree or a dot (.) if they do not, (PB) is the Protein Block assignment with ZZ for the extremities (not assigned, i.e., the PB is centered on the cen-tral residue).
BMC Bioinformatics 2004, 5 http://www.biomedcentral.com/1471-2105/5/58
Representation of the secondary structure assignments
Figure 3
Representation of the secondary structure assignments. Example of the ribosomal protein S15 from Bacillus
Stearother-mophilus (PDB code 1A32) with (a) DSSP, (b) STRIDE, (c) PSEA, (d) DEFINE, (e) PCURVE and (f) Protein Blocks. In the last case to simplify the representation, helices are associated to PB m and strands to PB d. The visualization is done with RASTER 3D [42,43] and MOLSCRIPT [44]. The α-helices are in red, the β-strands in green and the coils in blue.
Table 2: Description of Protein Blocks in short loops. The analysis is carried out in the short loops regions, i.e. 2 to 6 residues between two successive mm and/or dd. Listed for each protein block (PB; labeled from a to p), are: the frequency of occurrence (frq) in the complete databank (DB), the loops databank (Loops), and the short loops databank (Short loops), the four main PB transitions and the distribution in the secondary structures (α-helix, coil and β-strand) of the central residue, as assigned by PSEA.
PB frq. transitions (%) secondary structures
DB (%) Loops (%) Short loops (%) 1st 2nd 3rd 4th α (%) coil (%) β (%)
a 3.9 7.9 8.2 71.8 (c) 17.9 (d) 6.6 (k) 0.0 70.7 29.3 b 4.4 9.0 3.7 40.7 (c) 25.7 (f) 15.7 (l) 0.4 95.8 3.8 c 8.1 7.5 16.3 82.3 (d) 12.9 (f) 0.0 55.6 44.4 d 18.9 -- --e 2.5 5.1 4.9 90.1 (h) 0.0 36.4 63.6 f 6.7 13.6 11.8 85.2 (k) 13.4 (b) 0.0 75.3 24.7 g 1.1 2.2 1.8 39.7 (c) 30.2 (h) 14,0 (o) 13.7 (f) 13.8 82.7 3.5 h 2.4 4.9 4.3 65,0 (i) 21.9 (j) 7.3 (k) 1.3 75.4 23.3 i 1.9 3.9 3.1 84.4 (a) 9.2 (l) 0.9 93.7 5.4 j 0.8 1.6 1.4 25,0 (l) 20.5 (b) 18.0 (a) 14,0 (k) 11.7 79.5 8.8 k 5.4 11.0 12.9 81.2 (l) 7.6 (o) 6.5 (b) 61.5 38.0 0.5 l 5.4 11.0 12.1 83.9 (m) 5.3 (c) 74.1 25.7 0.2 m 30.2 -- --n 2.0 4.1 5.1 95.6 (o) 87.2 11.9 0.9 o 2.8 5.7 6.6 83.3 (p) 8.2 (m) 63.8 36,0 0.2 p 3.5 7.1 7.8 64.6 (a) 23.6 (c) 6.1 (m) 13.5 83,0 3.5
changed completely. Its main transition in the databank (PB d) dropped into fourth place. In fact, the transition from PB b to PB d was found mainly at the end of long loops going to β-strands. In short loops, PBs c, f and l were preferred. Hence, the rate of the second leading transition (PB c) increased from 17.9% to 40.7% and the third (PB l) from 15.7% to 25.7%.
We analyzed the distribution of the classic secondary structures in our short loop definitions. The secondary structure assignments (with PSEA [7]) changed substan-tially from their distribution in the entire databank. The frequency of PBs a, c and e in β-strands increased by 5%, 2% and 9%, respectively, and the frequency of PBs k, l, n and o in α-helices by more than 12%. The frequency of PB b in coils increased from 85.4% to 95.8%. Other methods of secondary structure assignment yield similar results.
Analysis of the sequence-structure relationship
Figure 4 reports the amino acid occurrence matrices, nor-malized into Z-scores, and their asymmetric Kullback-Lei-bler index (KLd [27]) for two PBs, c and l, calculated from the complete databank and from the short loop set. The PBs are five residues in length (noted from -2 to +2 and centered in 0). We showed in a previous study [19] that prediction can be improved only by enlarging the sequence window to 15 residues (noted from -7 to +7 and still centered in 0). We therefore computed the occurrence matrices for fragments of 15 residues. Positive Z-scores (respectively negative) correspond to overrepresented (respectively underrepresented) amino acids and provide information for each amino acid at each position. The KLd analyzes the contrast between the amino acid distribution observed in a given position of the occurrence matrix and the reference amino acid distribution in the protein set. Hence, it measures the sequence information content and highlights the most informative positions.
We observed two types of behaviors for the 14 PBs: for most (i.e., 11) the KLd values increased at every position while for the other three, decreased values compared with the entire databank were seen at some positions. PBs c and l are representative examples of these two cases. Globally, we observed some significant contrasts in the Z-score matrices, quantified by the higher KLd measure in some positions of the sequence window. PB c showed clear spe-cificity: proline was overrepresented and glycine underrepresented in positions 1 and 2, both in the com-plete databank and in the short loop set (cf. Figures 4a and 4e). For PB c in the complete databank, the maximal KLd was 0.15 in position (-2), but in the other central posi-tions (-1 to +2), corresponding to the informative sequence zone, KLds ranged from 0.04 to 0.05 (cf. Figure 4c). KLd levels were lower in the flanking regions. All PB c positions in the short loops had markedly increased
spe-cificities (cf. Figure 4g). The value of the maximal KLd increased from 0.15 to 0.23, and doubled for the other central positions, for a KLd range of 0.09 – 0.11.
PB l behaved distinctively. Its amino acid distributions in the short loop set differed from those in the entire data-bank (cf. Figures 4b and 4f). The informative region was restricted to only three positions (-2, -1, 0) with KLd val-ues of 0.23, 0.13 and 0.13 respectively (cf. Figure 4d). In the short loops, position (+2) increased significantly, to 0.11 and became equivalent to position (-1). Position (0) lost specificity (-0.01), but position (-2) remained most specific, increasing to 0.03 (cf. Figure 4h).
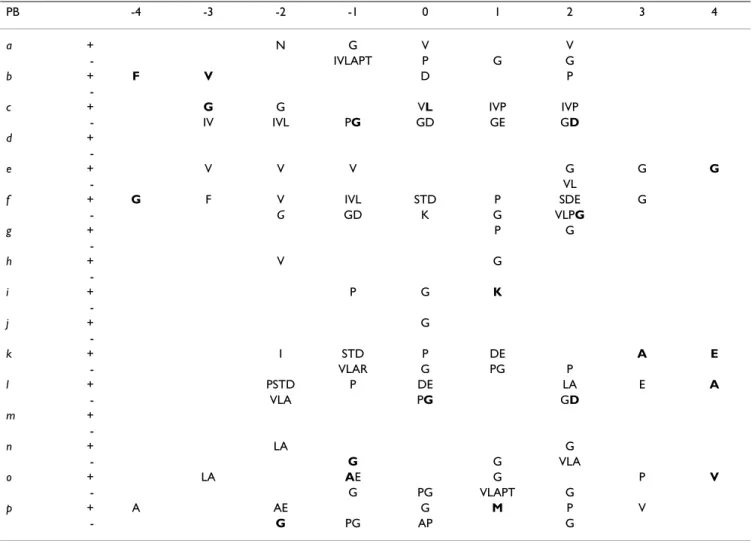
Table 3 summarized the 149 amino acid over- and under-representations observed in the short loop set, fewer than in the overall databank. This was due mainly to the number of occurrences, by definition lower in the short loops. Nevertheless, 20% of the significant amino acids had not previously been found. Nearly all PBs had at least one amino acid over- or under-represented. As expected, in most cases, it was glycine (9 times), although 8 other types of amino acids were involved. We note two specific examples: (i) the overrepresentation of methionine in position (+1) of PB p (the only methionine overrepre-sented in all the short loops), and (ii) the underrepresen-tation of glycine in position (-2) of PB f, although it was overrepresented in the global distribution.
Predicting with PBs in the short loops
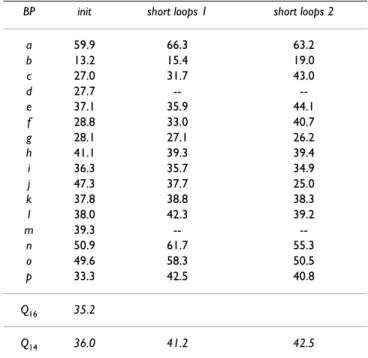
Table 4 summarizes the predictions. A training set corre-sponding to 2/3 of the dataset was used to learn the sequence-structure relationship for all predictions, and a test set corresponding to the remaining 1/3 to evaluate the results. We ran three different sets of predictions: the first two used occurrence matrices computed from the com-plete databank, and the third, matrices computed only from the short loop regions. We computed Q16 and Q14
ratios to analyze the quality of the predictions. Q16
corre-sponds to the total number of true predicted PBs over the total number of predicted PBs. The Q14 value is specific for
loops, i.e., PB m and d are not taken into account. The first prediction (init) is the conventional Bayesian pre-diction, run with all 16 PBs. It yielded a global prediction rate Q16 equal to 35.2%. This value is close to that in our
previous study (Q16 = 34.4% [19]) and far superior to the
value of 7.5% obtained with random assignment. The Q14
value equals 36.0% for both the short and long loops. This computation shows that the non-repetitive PBs were predicted as accurately as the PBs m (39.3%) and d (27.7%). Prediction was thus not biased in favor of the most populated blocks.
BMC Bioinformatics 2004, 5 http://www.biomedcentral.com/1471-2105/5/58
Analysis of PBs c and l in short loops
Figure 4
Analysis of PBs c and l in short loops. The left part corresponds to PB c and the right to PB l. (a), (b), (e) and (f) are the
amino acid Z-scores, with (blue): Z-score < (-4.4), (green): (-4.4) < Z-score < (-1.96), (yellow): (-1.96) < Z-score < 1.96, (orange): 1.96 < Z-score < 4.4 and (red): Z-score > 4.4. For prediction purpose, a five-residue PB (numbered from -2 to +2) is encompassed in a longer fragment of 15 amino acids in length (numbered from -7 to +7). (c), (d), (g) and (h) are the asymmet-ric Kullback-Leibler distributions. (a) and (c) correspond to PB c, (b) and (d) to PB l in the complete databank. (e) and (g) cor-respond to PB c and (f) and (h) to PB l in the short loops.
The second prediction (short loops 1) used, as previously, the occurrence matrices computed from the complete databank, but focused only on predicting the short loop regions (cf. Short loop description). Hence, only 14 PBs were considered. The prediction rate Q14 reached 41.2%,
signif-icantly greater than the random rate (8.0%). Prediction rates increased for most PBs, especially those associated with the α-helix ends: PB n (+10.8%), PB o (+8.7%), PB p (+9.2%). The increase in the prediction rates for the PBs associated with β-strand edges was slightly lower. Prediction rates fell for five PBs – approximately 1% for four (PBs e, g, h and i) and 9.6% for one, PB j.
The last prediction (referred to as short loops 2) used spe-cific learning with the sequence-structure relationship in the short loops to define the occurrence matrices of the 14 PBs involved. The Q14 value increased by 1.3% and
yielded better distribution between the PBs. Hence, only four PBs had poorer prediction rate than with the initial prediction. They were all associated with coil-assigned structures. PBs g, h and i lost 1.9%, 1.7% and 1.4%, respectively. The prediction rate for PB j decreased dra-matically, from 47.3% to 25.0%. Rates for the PBs associ-ated with repetitive PB m, i.e., PBs n and p, returned to values slightly closer to those for the complete databank, with accuracy increasing by 4.4% for PB n and 7.5% for PB p. This prediction approach also favored the protein blocks associated with PB d: the prediction rate increased by 5.8% for PB b, 16.0% for PB c and 7.0% for PB e. More-over, the prediction rate for PB f increased from 37.1% to 44.1%. Thus, the short loop 2 method improved the predic-tion of most PBs, but was limited by the bad performance of PB j.
Table 3: Description of Protein Blocks in short loops. For each position (indexed from -4 to + 4) of the 16 protein blocks (PBs), the highest amino acid over-representations (Z-score > 4) and under-representations (Z-score < -4) are labeled by the symbols (+) and (-), respectively. The new over- and under-representations specific to the short loops are displayed in bold and italics respectively. For analysis purpose, a five-residue PB (numbered from -2 to +2) is encompassed in a longer fragment of length 9 (numbered from -4 to +4).
PB -4 -3 -2 -1 0 1 2 3 4 a + N G V V - IVLAPT P G G b + F V D P -c + G G VL IVP IVP - IV IVL PG GD GE GD d + -e + V V V G G G - VL f + G F V IVL STD P SDE G - G GD K G VLPG g + P G -h + V G -i + P G K -j + G -k + I STD P DE A E - VLAR G PG P l + PSTD P DE LA E A - VLA PG GD m + -n + LA G - G G VLA o + LA AE G P V - G PG VLAPT G p + A AE G M P V - G PG AP G
BMC Bioinformatics 2004, 5 http://www.biomedcentral.com/1471-2105/5/58
Discussion
We have observed that the secondary structure assignment methods can produce highly discordant results. In most cases, only 80% of the residues are assigned to the same state. The capping regions of repetitive secondary struc-tures are particularly mismatched. The difficulties of describing clearly repetitive regions have often been pointed out [28-30].
PBs allow more precise description than do the secondary structures. In addition, they overlap. Accordingly, a small modification of PB assignment has fewer consequences than changing a secondary structure assignment; for example, a PB m is relatively similar to a PB n whereas an α-helix should be highly distinct from a coil. Analysis of series of PBs prove their structural relevance [23]. All these points justify the use of our structural alphabet to describe and analyze short loops. A recent approach has shown that most short loop fragments can be approximated cor-rectly in the Protein DataBank [31].
The behavior of PB b in short loops differs from that in all loops: it appears to be a β-strand N-cap mainly involved in long loops. This point may partly explain its poor
pre-diction rate in the short loops. Similarly, we observe that most of the rates of leading transitions are lower in the complete databank than in the short loops. This indicates that the less frequent transitions are associated with longer loops, i.e., fragments of more than 6 PBs.
Analysis of the sequence-structure relationship shows that most of the PBs in short loops have specific amino acid distributions that differ in many cases from the reference PB distribution. Nonetheless, as noted with PB l (see Fig-ure 4), some positions lose amino acid specificity. Because of the limited number of short loops in our non-redundant databank, we ran three different sets of predic-tions so that we could carefully observe the behavior of the PBs. (i) The global prediction shows that the loops were predicted as accurately as the repetitive structures (Q16 = 35.2% and Q14 = 36.0%), i.e., this method did not
introduce artificial bias resulting in preferential prediction of repetitive regions. (ii) The sequence-structure relation-ship in the short loops was strongly determinist and thus significantly improved the prediction (Q14 = 41.2%). The
use of the global occurrence matrices, however, induced an imbalance in the prediction of certain PBs: PBs associ-ated with the repetitive PB m enjoy many advantages over other PBs mainly associated with the coil-state. (iii) Accordingly, a specific approach dedicated to the short loops yielded better, more accurate predictions, better bal-anced between the different PBs (Q14 = 42.3%), with no particular bias.
PB j is the only PB for which results really suffer with this approach. It is the least frequent PB and the most variable. Consequently, the poor prediction rate for it may be explained by the lack of information in the databank for it. We also have noted important over-fitting (more than 20% between the learning set and the validation set) for this PB, substantially higher than for the other blocks. One advantage of such an approach is that it enables us to compute the most significant series of PBs and from this information propose alternative 3D candidate structures. Figure 5 shows an example of short loop prediction with the PB probabilities associated with a given sequence win-dow and the corresponding possible 3D structures.
Conclusions
Loop prediction, despite the considerable work devoted to it and the numerous methods developed, remains a dif-ficult research topic [14,32,33]. Prediction methods are often used in comparative modeling and propose one "com-plete" loop [14,33]. Here, instead of describing entire loops, we predict locally each position of the loops. This Bayesian approach can be used to propose not just one, but many different loops. Because each PB at each
posi-Table 4: Prediction results. Predictions are given for each PB (noted from a to p), together with the prediction rate for the 16 PBs (Q16) and without the repetitive PBs (Q14) in loops (i.e., PBs m and d). The first prediction (init) considered all the sequence positions. The second (short loops 1) was the same but only for the short loop regions, i.e., 2 to 6 residues between two mm and/or dd series. The third (short loops 2) included specific learning for the short loops.
BP init short loops 1 short loops 2
a 59.9 66.3 63.2 b 13.2 15.4 19.0 c 27.0 31.7 43.0 d 27.7 -- --e 37.1 35.9 44.1 f 28.8 33.0 40.7 g 28.1 27.1 26.2 h 41.1 39.3 39.4 i 36.3 35.7 34.9 j 47.3 37.7 25.0 k 37.8 38.8 38.3 l 38.0 42.3 39.2 m 39.3 -- --n 50.9 61.7 55.3 o 49.6 58.3 50.5 p 33.3 42.5 40.8 Q16 35.2 Q14 36.0 41.2 42.5
Example of prediction: scoring PB combinations
Figure 5
Example of prediction: scoring PB combinations. This figure presents the prediction of positions 34 to 43 of cupredoxin
amicyanin (Protein DataBank code [41]: 1BXA) with short loops prediction. The true 3D representation is given in (a) with the corresponding amino acid and PB sequences. The prediction gives a probability for every PB at each position. The score (and associated probability) at each position are reported in (b). Only scores more than 1 (superior to random) are indicated. The most probable series of PBs is therefore eojac. The comparison between ehiac from cupredoxin amicyanin and eojac taken from positions 53 to 62 of cyclophilin A (PDB code: 1AWU) gives a root mean square deviation (rmsd) equal to 2.2 Å. From (b) we can compute other high scoring PB series. Two of them are given: ehiac from monoclonal 2E8 FAB antibody (PDB code: 12E8, positions 10–19) and ehjac from Apo intestinal fatty acid-binding protein (PDB code: 1A57, positions 65–74) with associated rmsd of 0.3 Å and 2.5 Å respectively. We used MOLMOL [45] for the image visualizations.
BMC Bioinformatics 2004, 5 http://www.biomedcentral.com/1471-2105/5/58
tion is associated with a corresponding probability score, correlated in turn with the prediction accuracy [19,23], a loop prediction approach could be extremely useful. It can help to probe and sample the flexibility of loops. It can be useful too in ab initio loop prediction [34,35], recently shown to be important for some docking meth-ods for protein-protein [36] and protein-DNA interaction [37].
Methods
Data sets
The main set of proteins (PAPIA), based on the PAPIA/ PDB-REPRDB database [40], comprises 717 protein chains and 180,854 residues [41]. It has been used in pre-vious work [23] and is available at http://www.ebgm.jus sieu.fr/~debrevern. The set contains no more than 30% pairwise sequence identity. The selected chains have X-ray crystallographic resolutions less than 2.0 Å and an R-fac-tor less than 0.2. Each structure selected has a rmsd value larger than 10 Å from all representative chains. Each chain was carefully examined with geometric criteria to avoid bias from zones with missing density. An updated databank has been built with the same criteria; it is com-posed of 1,403 proteins and 320,005 residues.
Protein Blocks
They correspond to a set of 16 local prototypes, labeled from a to p (cf. Figure 1), 5 residues in length and based on Φ, Ψ dihedral angle description [19]. They were obtained by an unsupervised classifier similar to Kohonen Maps [38] and Hidden Markov Models [39]. The PBs m and d can be roughly described as prototypes for central α-helices and central β-strands, respectively. PBs a through c primarily represent β-strand N-caps and PBs e and f, C-caps; PBs g through j are specific to coils, PBs k and l to α-helix N-caps, and PBs n through p to C-caps. This struc-tural alphabet allows a reasonable approximation of local protein 3D structures [19,23] with a root mean square deviation (rmsd) now evaluated at 0.42 Å.
Short loop description
We defined the short loops as PB series 2 to 6 PBs long. These series must be composed of non-repetitive PBs, i.e., all PBs except d and m. They must have flanking regions composed of series of PBs mm and/or dd.
Secondary structure assignments
Secondary structures were assigned with five distinct pro-grams: DSSP [3] (CMBI version 2000), DEFINE [5] (version 2.0), PCURVE [6] (version 3.1), STRIDE [4] and PSEA [7] (version 2.0). DSSP and STRIDE use more than three states, so we reduced them: the α-helix contains 'H', 'G' and 'I', the β-strand contains 'E' and the coil everything else. Default parameters were used for each.
Agreement rate
To compare two distinct secondary structure assignment methods, we used an agreement rate denoted C3 and
defined as the proportion of residues associated with the same state (α-helix, β-strand and coil).
Z-score
The amino acid occurrences for each PB were normalized into a Z-score:
with the number of times amino acid i was observed in position j for a given PB and the number expected. The product of observations in position j and its fre-quency in the entire databank equals . Positive Z-scores (respectively negative) correspond to amino acids that are overrepresented (respectively underrepresented); threshold values of 4.42 and 1.96 were chosen (probabil-ity less than 10-5 and 5.10-2 respectively).
Asymmetric Kullback-Leibler measure
The Kullback-Leibler measure or relative entropy [27], denoted by KLd, makes it possible to compute the contrast between two amino acid distributions, i.e., that observed in a given position j and the reference distribution in the protein set (DB). The relative entropy KLd(j|PBx) in the
site j for the block PBx is expressed as:
where P(aaj = i|PBx) is the probability of observing the
amino acid i in position j (j = -w, ...,0, ..., +w) of the sequence window, given protein block PBx, and, P(aaj =
i|DB) the probability of observing the same amino acid in the databank (named DB).
Thus, it enables us to detect the "informative" positions in terms of amino acids for a given protein block [19].
Prediction
In a strategy of structure prediction from sequence [19,23], we must compute for a given sequence window Saa = {aa-w, ..., aa0, ..., aa+w}, the probability of observing a
given protein block PBx, i.e., P(PBx | Saa). For this
pur-pose, each PB is associated with an occurrence matrix of dimension l × 20 centered upon the PB, with l = 2 w +1 (in the study, w = 7). Using the Bayes theorem to compute this a posteriori probability P(PBx | Saa) from the a priori
Z n n n n i j i j obs i j th i j th , , , ,
( )
= − ni jobs, nijth ni jth, KLd j PB P aa i PB P aa i PB P aa i DB x j x i i j x j ( )=(
=)
.ln(
=)
=(
)
= =∑
1 20 probability P(Saa | PBx) deduced from the occurrence
matrix allows us to define the odds score Rx:
The highest score Rx corresponds to the most probable PB
[19,23]. The Q16 value computed is the total number of
true predicted PBs over the total number of predicted PBs. We also computed a Q14 value, specific for loops, i.e., the
PB m and d are not taken into account in the accuracy rate computation.
Authors' contributions
LF carried out the short loop studies. CB carried out the secondary structure work and performed the statistical analysis. AdB conceived the study and participated in its design and coordination. All authors read and approved the final manuscript.
Additional material
Acknowledgements
The authors want to express their appreciation and wish to acknowledge the contribution of Pr. Catherine Etchebest for her kind help in the course of this research. The authors thank also Dr. Patrick Fuchs and Pr. Serge Hazout for helpful discussions. This work was supported by grants from the Ministère de la Recherche and from "Action Bioinformatique inter EPST"
2001 – 2002 number 4B005F and 2003–2004. AdB was supported by a grant from the Fondation de la Recherche Médicale and is a full time researcher at the French Institute for Health and Medical Care (INSERM). CB has a grant from the Ministère de la Recherche.
References
1. Pauling L, Corey RB: Atomic Coordinates and Structure Fac-tors for Two Helical Configurations of Polypeptide Chains.
Proc Natl Acad Sci USA 1951, 37:235-240.
2. Pauling L, Corey RB: The Pleated Sheet, A New Layer Config-uration of Polypeptide Chains. Proc Natl Acad Sci USA 1951, 37:251-256.
3. Kabsch W, Sander C: Dictionary of protein secondary struc-ture: pattern recognition of hydrogen-bonded and geometri-cal features. Biopolymers 1983, 22:2577-2637.
4. Frishman D, Argos P: Knowledge-based protein secondary structure. Proteins 1995, 23:566-579.
5. Ridchards FM, Kundrot CE: Identification of structural motifs from protein coordinate data: secondary structure and first-level supersecondary structure. Proteins 1988, 3:71-84. 6. Sklenar H, Etchebest C, Lavery R: Describing protein structure:
a general algorithm yielding complete helicoidal parameters and a unique overall axis. Proteins 1989, 6:46-60.
7. Labesse G, Colloc'h N, Pothier J, Mornon J-P: P-SEA: a new effi-cient assignment of secondary structure from Cα. Comput Appl
Biosci 1997, 13:291-295.
8. Colloc'h N, Etchebest C, Thoreau E, Henrissat B, Mornon J-P: Com-parison of three algorithms for the assignment of secondary structure in proteins: the advantages of a consensus assignment. Protein Eng 1993, 6:377-382.
9. Rost B: Review: protein secondary structure prediction con-tinues to rise. J Struct Biol 2001, 134:204-218.
10. Pollastri G, Przybylski D, Rost B, Baldi P: Improving the prediction of secondary structure in three and eight classes using recur-rent neural networks and profiles. Proteins 2002, 47:228-235. 11. Chou KC: Prediction of tight turns and their types in proteins.
Anal Biochem 2000, 286:1-16.
12. Oliva B, Bates PA, Querol E, Aviles FX, Sternberg MJ: An auto-mated classification of the structure of the protein loops. J
Mol Biol 1997, 266:814-830.
13. Boutonnet NS, Kajava AV, Rooman MJ: Structural classification of alphabetabeta and betabetaalpha supersecondary structure.
Proteins 1998, 30:193-212.
14. Wojick J, Mornon J-P, Chomilier J: New efficient statistical sequence-dependent structure prediction of short to medium-sized protein loops based on an exhaustive loop classification. J Mol Biol 1999, 289:1469-1490.
15. de Brevern AG, Camproux A-C, Hazout S, Etchebest C, Tuffery P: Beyond the secondary structures: the structural alphabets. In Recent Adv In Prot Eng Edited by: Sangadai SG. Trivandrum, India: Research Signpost; 2001:319-331.
16. Karchin R: Evaluating local structure alphabets for protein structure prediction. PhD thesis. University of California, Computer
Science Department 2003.
17. Kolodony R, Koehl P, Guibas L, Levitt M: Small libraries of protein fragments model native protein structures accurately. J Mol
Biol 2002, 323:297-307.
18. Bystroff C, Baker D: Prediction of local structure in proteins using a library of sequence-structure motif. J Mol Biol 1998, 281:565-577.
19. de Brevern AG, Etchebest C, Hazout S: Bayesian probabilistic approach for predicting backbone structures in terms of pro-tein blocks. Propro-teins 2000, 41:271-287.
20. de Brevern AG, Hazout S: Compacting local protein folds by a "Hybrid Protein Model". Theor Chem Acc 2001, 106(1/2):36-47. 21. de Brevern AG, Hazout S: 'Hybrid Protein Model' for optimally
defining 3D protein structure fragments. Bioinformatics 2003, 19:345-353.
22. Benros C, de Brevern AG, Hazout S: Hybrid Protein Model (HPM): A method for building a library of overlapping local structural prototypes. sensitivity study and improvements of the training. IEEE Int Work. NNSP 2003, 1:53-70.
23. de Brevern AG, Valadié H, Hazout S, Etchebest C: Extension of a local backbone description using a structural alphabet. A
Additional File 1
Supplementary data 1: Comparison between the secondary structure assignments (file_1.rtf). file_1.rtf is a Rich Text Format file. It contains the example of the 6 assignment methods for the proto-oncogene Mtcp-1 (PDB code 1A1X chain A), see Figure 2 for details.
Click here for file
[http://www.biomedcentral.com/content/supplementary/1471-2105-5-58-s1.rtf]
Additional File 2
Supplementary data 2: Representation of the secondary structure assign-ments (file_2.doc). Example of the proto-oncogene Mtcp-1 (PDB code 1A1X chain A), see Figure 3 for details.
Click here for file
[http://www.biomedcentral.com/content/supplementary/1471-2105-5-58-s2.doc]
Additional File 3
Supplementary data 3: Description of Protein Blocks in the databank and in the loops (file_3.xls). file_3.xls is an Excel file. For each protein block (PB; labeled from a to p), we report the occurrence frequency (frq) in the
overall database and in the loops set, the four main PB transitions and the distribution in the secondary structures (α-helix, coil and β-strand) of the central residue assigned by PSEA.
Click here for file
[http://www.biomedcentral.com/content/supplementary/1471-2105-5-58-s3.xls] x j x j j w j w
R
= P aaP aa(
(
==i PBi DB)
)
=− =+∏
Publish with BioMed Central and every
scientist can read your work free of charge
"BioMed Central will be the most significant development for disseminating the results of biomedical researc h in our lifetime."
Sir Paul Nurse, Cancer Research UK
Your research papers will be:
available free of charge to the entire biomedical community peer reviewed and published immediately upon acceptance cited in PubMed and archived on PubMed Central yours — you keep the copyright
Submit your manuscript here:
http://www.biomedcentral.com/info/publishing_adv.asp
BioMedcentral BMC Bioinformatics 2004, 5 http://www.biomedcentral.com/1471-2105/5/58
new approach to the sequence-structure relationship. Protein
Sci 2002, 11:2871-2886.
24. Karchin R, Cline M, Mandel-Gutfreund Y, Karplus K: Hidden Markov models that use predicted local structure for fold recognition: alphabets of protein backbone geometry.
Pro-teins 2003, 51:504-514.
25. Woodcock S, Mornon J-P, Henrissat B: Detection of secondary structure elements in proteins by hydrophobic cluster analysis. Prot Eng 1992, 5:629-635.
26. Aurora R, Rose GD: Helix capping. Protein Sci 1998, 7:21-38. 27. Kullback S, Leibler RA: On information and sufficiency. Ann Math
Stat 1951, 22:79-86.
28. Cuff J, Barton G: Evaluation and Improvement of multiple sequence methods for protein secondary structure prediction. Proteins 1999, 34:508-519.
29. Bansal M, Kumar S, Velavan R: HELANAL: a program to charac-terize helix geometry in proteins. J Bio Struct Dyn 2000, 17:811-820.
30. Fodje MN, Al-Karadaghi S: Occurrence, conformational fea-tures and amino acid propensities for the pi-helix. Protein Eng 2002, 15:353-358.
31. Du P, Andrec M, Levy RM: Have we seen all structures corre-sponding to short protein fragments in the Protein Databank. Protein Eng 2003, 16:407-414.
32. Fiser A, Do RK, Sali A: Modeling of loops in protein structures.
Protein Sci 2000, 9:1753-1773.
33. Camproux A-C, de Brevern AG, Hazout S, Tuffery P: Exploring the use of a structural alphabet for a structural prediction of pro-tein loops. Theor Chem Acc 2001, 106(1/2):28-35.
34. Nikiforovich GV, Galaktionov S, Balodis J, Marshall GR: Novel approach to computer modeling of seven-helical transmem-brane proteins: current progress in the case of bacteriorhodopsin. Acta Biochimic Polonica 2001, 48:53-64. 35. Galaktionov S, Nikiforovich GV, Marshall GR: Ab initio modeling
of small, medium, and large loops in proteins. Biopolymers 2001, 60:153-168.
36. Gray JJ, Moghon S, Wang C, Schueler-Furman O, Kuhlman B, Rohl CA, Baker D: Protein-protein docking with simultaneous opti-mization of rigid-body displacement and side-chain conformations. J Mol Biol 2003, 331:281-299.
37. Bastard K, Thureau A, Lavery R, Prevost C: Docking macromole-cules with flexible segments. J Comp Chem 2003, 24:1910-1920. 38. Kohonen T: Self-organized formation of topologically correct
feature maps. Biol Cybern 1982, 43:59-69.
39. Rabiner LR: A tutorial on Hidden Markov Models and selected applications in speech recognition. Proc of the IEEE 1989, 77:257-285.
40. Noguchi T, Matsuda H, Akiyama Y: PDB-REPRDB: a database of representative protein chains from the Protein Data Bank (PDB). Nucleic Acids Res 2001, 29:219-220.
41. Berman HM, Westbrook J, Feng Z, Gilliland G, Bhat TN, Weissig H, Shindyalov IN, Bourne PE: The Protein Data Bank. Nucl Acids Res 2000, 28:235-242.
42. Bacon DJ, Anderson WF: A fast algorithm for rendering space filling molecules pictures. J Mol Graph 1988, 6:219-220. 43. Merritt EA, Bacon DJ: Raster3D: Photorealistic molecular
graphics. Methods in Enzym 1997, 277:505-524.
44. Kraulis PJ: MOLSCRIPT: A Program to produce both detailed and schematic plots of protein structures. J Appl Cryst 1991, 24:946-950.
45. Koradi R, Billeter M, Wuthrich K: MOLMOL: a program for dis-play and analysis of macromolecular structures. J Mol Graph 1996, 14:51-55.