HAL Id: hal-02931422
https://hal.archives-ouvertes.fr/hal-02931422
Submitted on 6 Sep 2020HAL is a multi-disciplinary open access archive for the deposit and dissemination of sci-entific research documents, whether they are pub-lished or not. The documents may come from teaching and research institutions in France or abroad, or from public or private research centers.
L’archive ouverte pluridisciplinaire HAL, est destinée au dépôt et à la diffusion de documents scientifiques de niveau recherche, publiés ou non, émanant des établissements d’enseignement et de recherche français ou étrangers, des laboratoires publics ou privés.
Hofmeister Effects of Monovalent Sodium Salts in the
Gelation Kinetics of Gelatin
Vincent Ball
To cite this version:
Vincent Ball. Hofmeister Effects of Monovalent Sodium Salts in the Gelation Kinetics of Gelatin. Journal of Physical Chemistry B, American Chemical Society, 2019, 123 (40), pp.8405-8410. �10.1021/acs.jpcb.9b07615�. �hal-02931422�
Hofmeister Effects of Monovalent Sodium Salts in
the Gelation Kinetics of Gelatin
Vincent Ball 1,2,*
1: Université de Strasbourg. Faculté de Chirurgie Dentaire. 8 rue Sainte Elisabeth. 67000 Strasbourg. France.
2: Institut National de la Santé et de la Recherche Médicale, Unit 1121. 11 rue Humann. 67085 Strasbourg Cedex. France.
*: vball@unistra.fr
ABSTRACT
The gelation kinetics of gelatin depends on the presence of electrolytes and the influence of cations with variable valency has been recently emphasized. However acquired knowledge shows that the nature of anions has more influence on various properties of aqueous solutions than the nature of the cations. It is shown herein, using sodium salts of monovalent anions, that the gelation kinetics of gelatin is accelerated by the presence of highly kosmotropic anions like fluoride and strongly slowed down, eventually inhibited, by the presence of chaotropic anions like thiocyanate and perchlorate. Overall the parameter characterizing the gelation kinetics, k, is a linear function of the polarizability of the used salt in aqueous solution, which has been
that the same parameter characterizing the gelation kinetics is a linear function of the viscosity B coefficient taken from the literature. The linear correlation coefficients are excellent in the case of halide anions (F-, Cl-, Br-, I-) but poorer when non spherical anions like NO3-, SCN- and ClO4
-are considered.
Introduction
Many properties of charged biological macromolecules like their solubility 1-3 and specific activity 4 depend not just on the ionic strength of the solution but on the specific pair of cation-anion used as the supporting electrolyte. The supporting electrolyte also modifies the pH of the solution (in the presence of a buffering species) 5, its specific viscosity 6, the surface tension of the solution-air interface 7, 8 and many other interfacial phenomena 3, 9, 10. All these specific ion effects, first observed in protein crystallization experiments 11 by F. Hofmeister are due to a combination of different interactions, notably dispersion forces 12-14 and cooperative effects 15 in the hydration of the small electrolytes leading ultimately to changes in the water structure (chaotropes or structure breaking versus kosmotropes or structure making) even if this notion is somewhat difficult to quantify 16 and controversial. Indeed, an alternative model to the solute induced structural changes suggests that the specific ionic hydration and the formation of cation-anion pairs in solution is at the origin of easily measurable colligative properties of aqueous solutions, namely reduction of the freezing point and of the vapor pressure of water, quantified by Raoult’s law 17, 18. Hence before reaching a definitive theoretical understanding of the nature of the electrolyte on the structure of water and the subsequent effect on other solutes, additional experimental quantitative measurements are required. In particular, there are surprisingly few articles dealing on the influence of the nature of the electrolyte on the gelation
kinetics of hydrogels like gelatin 19-22. The structure, the melting temperature, the chirality and the mechanical properties of self-assembling molecules used to form supramolecular hydrogels are also strongly affected by the nature of the anion 23. The aim of the present investigation is to investigate the influence of different sodium salts with only monovalent anions on the gelation kinetics of bovine skin gelatin (at a constant mass fraction of 10 % w/v) and to correlate the observed strong anion dependence, in agreement with the Hofmeister series, with molecular parameters of the salt, namely its molecular polarizability and the viscosity B coefficients of the anions. Since the electrolyte in solution is made from the sodium cation and a chosen anion X-, the polarizability of the solvated combination of ions (dissociated and solvated or constituting a solvated ion pair) has been quantified based on the refractive index increment obtained from refractive index measurements and using the classical Lorentz-Lorenz relationship.
Materials and methods
Gelatin B from bovine skin was purchased from Sigma-Aldrich (ref. G9382, lot#051M0012V) and used without further purification. The bloom number of this gelatin was 225g corresponding to a molecular mass of 40000-50000 g.mol-1 according to the furnisher. To check for the presence of possible ionic impurities which could modify the influence of the different salts in the gelation process, the conductivity of a 10 % (w/v) hot (40°C) gelatin solution was measured and compared to the conductivity of hot distilled and demineralized water at the same temperature. To that aim a Consort K610 conductometer was used. The conductivity of the hot gelatin solution was found equal to (50 5)µS whereas the conductivity of distilled-demineralized water was found equal to (2.5 1.0)µS. Such a conductivity increment is
equivalent NaCl (having a limiting ionic conductance of 126.4 S.cm².mol-1), in the gelatin solution.
The used salts were NaF (Sigma, ref. S1504), NaCl (Fischer-Scientific, Illkirch, France, ref. S/3160/60), NaBr (Sigma, ref. 793574), NaI (Sigma, ref. 383112,) NaNO3 (Sigma, ref.
S5506), NaSCN (Fluka, ref. 71938), NaCl04 (Sigma, ref. 410241) and were dissolved in Milli Q
water (Millipore, Molsheim, France) without further pH adjustment. The ionic strength of the solutions used to dissolve gelatin was varied between 50 and 1000 mM. Gelatin was dissolved in hot electrolyte solutions (50°C) under magnetic agitation (450 rpm with a magnetic stirrer) to reach a constant mass fraction of 10 % (w/v). The gelatin solution with an ionic strength equal to
C (the molar concentration for the NaX elctrolytes) was equilibrated half an hour in this
conditions to get a homogeneous solution without visible aggregates. 1.2 mL of the gelatin solution was then poured on the stainless steel plate (cleaned with hot water and isopropanol before each experiment) of a Kinexus Ultra rheometer (Malvern, Great Britain) thermostated at 25°C. Immediately after pouring of the gelatin solution, a 4 cm in diameter cone was approached to the lower plate with the apex of the cone located at 150 µm from the surface of the plate. The solvent trap, to reduce solvent evaporation, was closed and the measurement sequence was immediately started to measure the gelation kinetics. In all experiments, the frequency of the cone oscillation was equal to 1 Hz with a shear strain of 1% at a constant temperature of 25°C. A measurement was performed every 30s up to the time at which the storage modulus G’ became higher than the loss modulus G”. The onset of gelation is defined by the first data point for which G’≥G”, corresponding to ≤ 45 ° (where ).
The time after which the gel state is reached, , will be analyzed as a function of the ionic strength for each of the NaX electrolytes. The data will be plotted in a log-log scale as in reference 22, namely:
(1)
Where 0 is the extrapolated gelation time at zero ionic strength ie in ultra pure water, I is the
ionic strength (equal to the salt concentration C in the case of 1:1 electrolytes) and k is a characteristic constant characterizing the gelation of gelatin in the presence of the NaX electrolyte. In ref. 22 and in the case of monovalent metal salts, a straight line of the plots was obtained, with a slope equal to k.
The refractive index of the electrolyte solutions was measured as a function of the electrolyte concentration at (25 ± 1)°C with a RFM340 refractometer (Beligham+Stanley Ltd) at a wavelength of 589 nm. The obtained refractive index values are plotted as a function of the electrolyte concentration to yield a straight line having a slope equal to , the refractive index increment of the investigated electrolyte. From this value, the refractive index of the electrolyte itself, nsalt , can be obtained, using the tabulated mass density of NaX, according
to the De Feijter relationship 24, 25:
(2)
, nwater being the refractive index of water, measured in each experiment. The Lorentz-Lorenz
(3)
Where NA and Vm are the Avogadro’s number and the molar volume of the salt respectively. Vm is
easily calculated from the molar mass and mass density of the salt.
The obtained molecular polarizability will be compared with the tabulated polarizability of the anions X-, in ref. 1. The aim of the analysis is to see if the k values obtained from the gelation kinetics correlate with the measured polarizability of the NaX ion pair. Such a correlation was found in the case of gelatin gelation in the presence of different monovalent and divalent cations
22. All the rheology and refractive index measurements were repeated twice whatever the salt
concentration and the used electrolyte.
The obtained k parameter obtained by fitting the measured gelation times according to eq (1) will also be correlated with the viscosity B coefficients of the anions used in the NaX electrolytes during the gelation experiments. The viscosity B coefficients were obtained by the fitting the relative viscosity of electrolyte solutions according to:
(4)
Where , 0, C and A are the dynamic viscosity of the solution, the dynamic viscosity of the
solvent, the electrolyte concentration and a parameter which reflects the interionic forces respectively 6.
Results and discussion
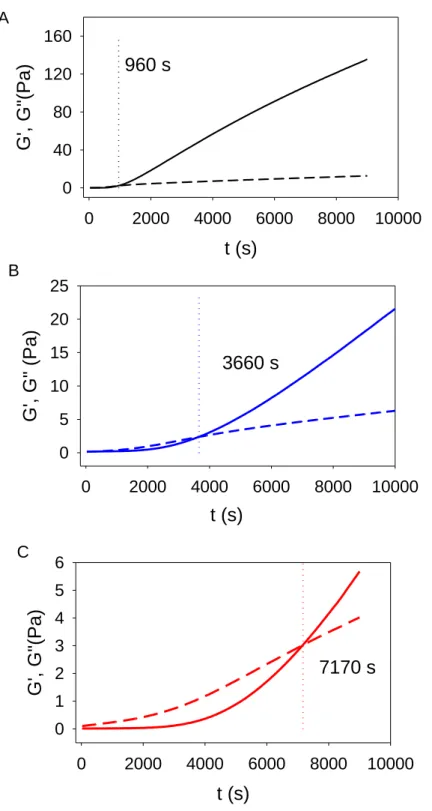
Some typical gelation kinetics of 10 % (w/v) gelatin in the presence of three typical NaX salts at an ionic strength of 100 mM are displayed in Figure 1. A gel is formed as soon as the
storage modulus G’ is larger than the loss modulus G”. The crossing point of the two curves is obtained after a duration . Obviously, at a given ionic strength, depends markedly on the nature of the supporting NaX electrolyte and seems to increase with the chaotropic nature of the anion: .
Figure 1: Gelation kinetics of gelatin B at 10 % (w/v) in the presence of electrolyte solutions with an ionic strength of 100 mM: A: NaCl, B: NaI, C: NaSCN. The storage modulus and the loss modulus are plotted with full and dashed lines respectively. The dotted vertical lines
t (s) 0 2000 4000 6000 8000 10000 G' , G"(Pa ) 0 40 80 120 160 t (s) 0 2000 4000 6000 8000 10000 G' , G"(Pa ) 0 1 2 3 4 5 6 t (s) 0 2000 4000 6000 8000 10000 G' , G" (Pa) 0 5 10 15 20 25 960 s 3660 s 7170 s A B C
correspond to the gelation time, , for which G’=G”. The gelation times are indicated in each case.
The gelation times of the gelatin gels (10 % w/v) for all the investigated electrolytes at different ionic strengths are given in Figure 2A. The data are plotted on a double logarithmic scale and a straight line is obtained (the regression coefficients are better than 0.81 in all cases, see table 1) justifying the use of equation (1) to estimate the influence of the nature of the used electrolyte on the gelation through the characteristic k parameter (see eq.(1)). It is interesting to note the formal analogy between eq (1) and the Setschenov equation describing the solubility of a protein as a function of the electrolyte concentration 27.
NaSCN is so efficient in slowing down the gelation of gelatin that no gel is formed even after 1 week of ageing in the presence of 500 mM salt (Figure S1 in the Supporting Information). The same holds true for NaCl04 (data not shown).
For all the electrolytes excepted NaF, the gelation time increases with the salt concentration. As an opposite trend, higher NaF concentrations favor a faster gelation of gelatin (Figure 2A). This is an original finding of this report. Overall, the characteristic gelation of gelatin follows the Hofmeister series of the anions.
Even if the used electrolyte has a dramatic influence of the gelation of gelatin, the crossing point where G’=G” occurs at 4 Pa and is hence salt independent (Figure 2B).
log I (mM)
1.4 1.6 1.8 2.0 2.2 2.4 2.6 2.8 3.0 3.2
Log
s)
1
2
3
4
5
6
G'=
G" (Pa
)
0
1
2
3
4
5
A
B
Figure 2: A: Variation of the gelation time (after which G’>G”) with the ionic strength of the aqueous solutions containing NaX electrolytes: NaF (gray triangles); NaCl (black circles), NaBr (purple losanges), NaI (blue circles), NaNO3 (green circles), NaSCN (red circles) and NaCl04
(black squares).
B: variation of the crossing point of the gelation kinetics (G’=G”) with the ionic strength of the aqueous solutions containing NaX electrolytes: NaF (gray triangles); NaCl (black circles), NaBr (purple losanges), NaI (blue circles), NaNO3 (green circles), NaSCN (red circles) and NaCl04
(black squares).
It is also observed that the 0 values, the gelation time at 1 mM in ionic strength, are also
salt dependent, which is unexpected because this parameter should reflect the intrinsic gelation time of gelatin in the presence of small electrolyte concentrations. The finding that 0 is also salt
dependent may reflect that specific ionic effects play a role at very low concentrations or that equation (1) is not valid extrapolated to small ionic strengths. It is impossible at this stage to speculate more about this experimental finding.
To relate those findings to molecular properties of the X- anions (all the used salt were NaX hence having an identical cation), we wanted to see if k correlates with the molecular polarizability of the salt, as was done for the influence of metallic chlorides on the gelation kinetics of gelatin 22. For that reason, not to rely exclusively on literature data, we calculated the molecular polarizability of the used NaX salt from the Lorentz-Lorenz relationship (eq. (3)). This requires the knowledge of the refractive index of the salt, nsalt. This value was calculated from
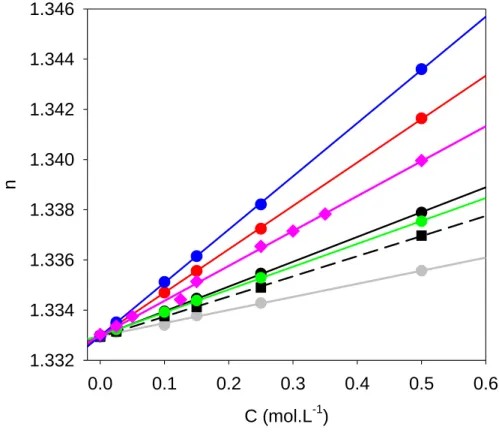
the refractive index of the solution, n, is a linear function of the electrolyte concentration with excellent linear correlation coefficients in all cases (higher than 0.998, see Table 1). The values obtained by this method are given in Table 1 where they can be compared with tabulated values for the anions alone, , when available. In all cases the obtained values are
larger than the tabulated values for the corresponding anions, which is not so surprising. The difference between and becomes smaller the larger the anion is which is not unexpected because the small Na+ cation will contribute less to the molecular polarizability of the ion combination the larger the anion is.
Figure 3: Variation of the refractive index (at =589 nm) of aqueous solutions containing sodium salts: NaF (gray triangles); NaCl (black circles), NaBr (purple losanges), NaI (blue circles), NaNO3 (green circles), NaSCN (red circles) and NaCl04 (black squares). The lines correspond to
C (mol.L-1) 0.0 0.1 0.2 0.3 0.4 0.5 0.6 n 1.332 1.334 1.336 1.338 1.340 1.342 1.344 1.346
linear regressions to the experimental data. The slope of this lines yields the refractive index increment.
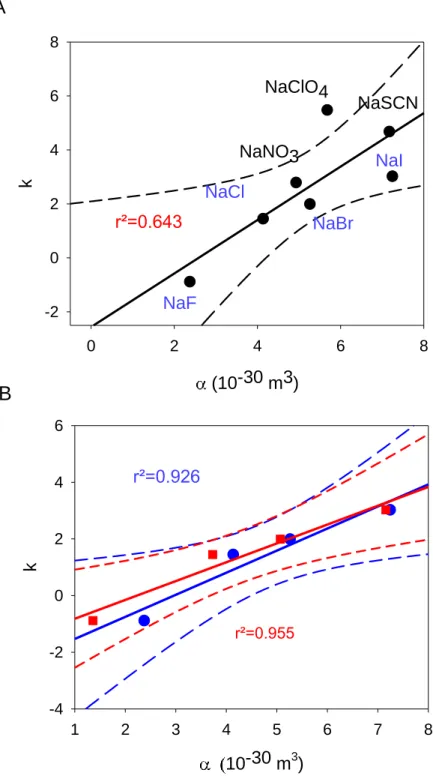
The k values obtained from the rheology experiments show a reasonable linear correlation with the molecular polarizability of all the NaX electrolytes used in the aqueous gelatin solutions (Figure 4A) (linear correlation coefficients of 0.64). However the linear relationship between k and becomes excellent (r²=0.926) when the analysis is restricted to
Figure 4: A: Variation of the gelation constant k with the measured polarizability of the different sodium salts used as electrolytes to dissolve gelatin. The black full and the black dotted line correspond to a linear regression and to the limits of the 95 % confidence interval to all the
(10-30 m3) 0 2 4 6 8 k -2 0 2 4 6 8 NaF NaCl NaNO3 NaI NaSCN NaClO4 NaBr r²=0.643 10-30 m3) 1 2 3 4 5 6 7 8 k -4 -2 0 2 4 6 r²=0.926
A
B
r²=0.955experimental data. For convenience the sodium halides (blue annotation) are distinguished from the other sodium salts (black annotation).
B: Variation of the gelation constant k with the measured (blue filled circles) and the tabulated polarizability (red filled squares) of the sodium halides used as electrolytes to dissolve gelatin. The black (red) full and the black (red) dotted line correspond to a linear regression and to the limits of the 95 % confidence interval to the experimental (tabulated) polarizability data.
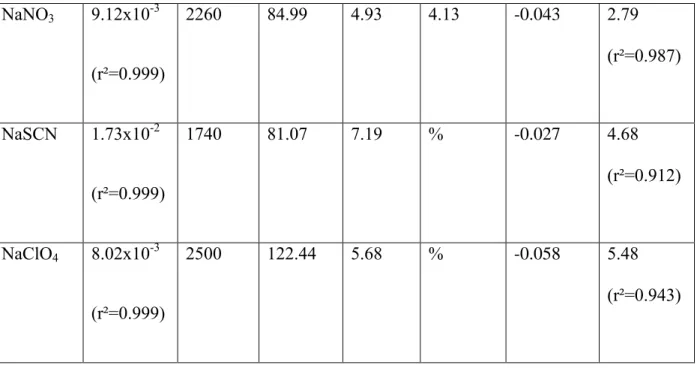
Nature of the salt dn/dc (L.mol-1) (kg.m-3) M (g.mol-1) salt (10-30 m3) tabulated (10-30 m3) a Viscosity B coefficient (L.mol-1) b k NaF 5.22x10⁻³ (r²= 0.998) 2560 41.99 2.38 1.36 0.107 -0.8820 (r²=0.947) NaCl 9.88x10⁻³ (r²=0.999) 2160 58.44 4.14 3.73 -0.005 1.45 (r²=0.812) NaBr 1.39x10⁻² (r²=0.997) 3210 102.89 5.26 5.07 -0.033 1.99 (r²=0.985) NaI 2.12x10⁻² 3670 149.89 7.25 7.16 -0.073 3.03
NaNO3 9.12x10⁻³ (r²=0.999) 2260 84.99 4.93 4.13 -0.043 2.79 (r²=0.987) NaSCN 1.73x10⁻² (r²=0.999) 1740 81.07 7.19 % -0.027 4.68 (r²=0.912) NaClO4 8.02x10⁻³ (r²=0.999) 2500 122.44 5.68 % -0.058 5.48 (r²=0.943)
Table 1: Data used to establish the relationship between the gelation kinetic parameter k and the polarizability of the Na+, X- combination of ions in aqueous solutions. a: The tabulated polarizabilities are from Table 1 in ref. [1]. b: the tabulated B viscosity coefficients, for the corresponding anions are taken from ref. 6.
When the gelation parameter k is plotted against the viscosity B coefficients of the anions, taken from ref. 6, the correlation is again satisfactory when all the investigated NaX salts are considered (r²=0.642) (Figure 5A). It appears however as for the correlation between k and the molecular polarizability (Figure 4A), that NaNO3, NaClO4 and NaSCN yield k value that lie
above the linear correlation (Figure 4A and 5A). Indeed, as those electrolytes are removed from the correlation between k and salt (Figure 4B) and between k and B (Figure 5B), the correlations
become excellent (r²>0.95), meaning that the ability of spherical halide anions to modify gelatin’s gelation kinetics is perfectly correlated with molecular parameters of the anions, namely their molecular polarizability or the viscosity B coefficient which is directly related to the strength of water binding to the anions 6. However, for NO3-, ClO4- and SCN- which are
triangular, tetrahedral and linear anions respectively, there must be an extra ion specific contribution, at the molecular scale, which makes gelation of gelatin slower than expected on the basis of the molecular polarizability and viscosity B coefficients.
B (L.mol-1)
-0.12 -0.08 -0.04 0.00 0.04 0.08 0.12k
-6 -4 -2 0 2 4 6 -0.12 -0.08 -0.04 0.00 0.04 0.08 0.12k
-2 -1 0 1 2 3 4r²=0.995
F
-
Cl-Br
-I
-I
-F
-Cl
-Br
-NO
3
-SCN
-ClO
4
-r²=0.639
A
B
Figure 5: A: Variation of the gelation constant k with the tabulated viscosity B coefficient of the different anions used as NaX electrolytes to dissolve gelatin. The black full and the black dotted line correspond to a linear regression and to the limits of the 95 % confidence interval to all the experimental data. For convenience the sodium halides (blue annotation) are distinguished from the other sodium salts (black annotation).
B: Variation of the gelation constant with the tabulated viscosity B coefficients of halides used as NaX electrolytes to dissolve gelatin. The red full and the red dotted line correspond to a linear regression and to the limits of the 95 % confidence interval to all the experimental data respectively.
A last point to be considered is the remarkable influence of F- anions in the gelation kinetics of gelatin (Figure 2A). F- is a stronger base (the pKa of HF is equal to 3.2 at 25°C) than Cl- (HCl is a fully dissociated species in water) and it may play a role in the gelation kinetics of gelatin by modifying the solution pH. But as the pH value is also a property which is anion specific 5 we cannot distinguish among different possible effects to explain that an increase in NaF concentration induces an acceleration in the gelation of gelatin compared to “pure” water (Figure 2A). To investigate the influence of the basicity of anions one could think to compare the gelation kinetics of gelatin in the presence of other weak bases like phosphate or carbonate species, but taking into account that such species are in equilibrium between monovalent and divalent anions in a broad range of pH values and hence modify the screening of the electrostatic forces in a more pronounced manner than monovalent anions.
The most probable influence of fluoride anions in reducing the characteristic gelation time of gelatin with respect to the gelation in water without added electrolyte, is its strong kosmotropic character. The F- anions induce a depletion of water9,10 in the close proximity of the gelatin
chains, thus reinforcing the magnitude of the attractive interactions between gelatin chains and favoring their association, hence the gelation process. Additional experiments with other kosmotropes have to be performed to confirm or to infirm this assumption.
Conclusions
The gelation kinetics of gelatin is slowed down by chaotropic anions in the NaX series of electrolytes following the trends expected by the Hofmeister series in a qualitative way. However, the kosmotropic anion F- speeds up the gelation kinetics of gelatin. The kosmotropic anions are strongly solvated and may favor gelatin-gelatin interactions and hence the gelation process in the same manner they favor the crystallization process of many proteins 9, 11. On the other side, the chaotropic anions are weakly solvated, adsorb strongly at the water/air interface reflecting their hydrophobic character and are not favorable for protein crystallization 9, 11. In a similar manner they slow down the gelation kinetics of gelatin in a concentration dependent manner described by eq (1). The k parameter obtained by fitting eq (1) to the measured gelation times correlates well with the molecular polarizability and the viscosity B coefficients of the anions present in the NaX electrolytes, the better so for the sodium halides. This constitutes the quantitative finding of this study, which is expected to relate “Hofmeister effects” in gelation processes to molecular attributes of the monovalent anions present in aqueous solutions of sodium salts. However, when gelatin is dissolved in NaNO3, NaClO4 and NaSCN, for which the
anions are not spherical, the k- and k-B correlations are less good suggesting that the molecular
be the topic for additional experimental and theoretical investigations aiming to relate specific ion effects to molecular attributes of the corresponding anions.
Supporting Information. Picture of a gelatin gel (10 % w/v) aged for one week in the presence
of 0.5 M NaCl and of a gelatin sol aged for one week in the presence of 0.5 M NaSCN. The following files are available free of charge.
Corresponding Author
*vball@unistra.fr.
Acknowledgement
The Insem 1121 unit is acknowledged for funding this research.
REFERENCES
(1) Lo Nostro, P.; Ninham, B.W. Hofmeister Phenomena: An Update of Ion Specificity in Biology. Chem. Rev. 2012, 112, 2286-2322.
(2) Lo Nostro, P.; Ninham, B.W.; Milani, S.; Lo Nostro, A.; Pesavento, G.; Baglioni, P. Hofmeister Effects in Supramolecular and Biological Systems. Biophys. Chem. 2006, 124, 208-213.
(3) Collins, K.D.; Washabaugh, M.W. The Hofmeister Effect and the Behavior of Water at Interfaces. Quart. Rev. Biophys. 1985, 18, 323-422.
(4) Okur, H.I.; Hladílková, J.; Rembert, K.B.; Cho, Y.; Heyda, J., Dzubiella, J.; Cremer, P.S.; Jungwirt, P. Beyond the Hofmeister Series: Ion-Specific Effects on Proteins and Biological Functions. J. Phys. Chem. B. 2017, 121, 1997-2014.
(5) Salis, A.; Pinna, M.C.; Bilaničová, D.; Monduzzi, M.; Lo NOstro P.; Ninham, B.W. Specific Anion Effects on Glass Electrode pH Measurements of Buffer Solutions: Bulk and Surface Phenomena. J. Phys. Chem. 2006, 110, 2949-2956.
(6) Jenkins H.D.B.; Marcus, Y. Viscosity B-Coefficients of Ions in Solution. Chem. Rev. 1995,
95, 2695-2724.
(7) Pegram, L.M.; Record, M.T. Hofmeister Salt Effects on Surface Tension Arise from Partitioning of Anions and Cations between Bulk Water and the Air – Water Interface. J. Phys.
Chem. B 2007, 111, 5411-5417.
(8) Marcus, Y. Specific Ion Effects on the Surface Tension and Surface Potential of Aqueous Electrolytes. Curr. Opin. Colloid Interf. Sci. 2016, 23, 94-99.
(9) Cacace, M.G.; Landau, E.M.; Ramsedn, J.J. The Hofmeister Series: Salt and Solvent Effects on Interfacial Phenomena. Quart. Rev. Biophys. 1997, 30, 241-277.
(10) Pegram, L.M.; Record, M.T. Quantifying Accumulation or Exclusion of H+, OH-, and Hofmeister Salt Ions Near Interfaces. Chem. Phys. Lett. 2008, 467, 1-8.
(11) Hofmeister, F. Zur Lehre von der Wirkung der Salze. Zweite Mitteilung. Arch. Exp. Pathol.
Pharmakol. 1888, 24, 247-260.
(12) Ninham, B.W.; Yaminsky, V.; Ion Binding and Ion Specificity: The Hofmeister Effect and Onsager and Lifschitz Theories. Langmuir 1997, 13, 2097-2108.
(13) Henry, M. Hofmeister Series: The Quantum Mechanical Viewpoint. Curr. Opin. Colloid
Interf. Sci. 2016, 23, 110-125.
(14) Pollard, T.P.; Beck, T.L. Toward a Qunatitative Theory of Hofmeister Phenomena: From Quantum Effects to Thermodynamics. Curr. Opin. Colloid Interf. Sci. 2016, 23, 110-118.
(15) Tielrooij, K.J.; Garcia-Araez, N.; Bonn, M.; Bakker, H.J. Cooperativity in Ion Hydration.
Science. 2010, 328, 1006-1009.
(16) Marcus, Y. Effect of Ions on the Structure of Water: Structure Making and Breaking. Chem.
Rev. 2009, 109, 1346-1370.
(17) Zavitsas, A.A. Properties of Water Solutions of Electrolytes and Non-Electrolytes. J. Phys.
Chem. B. 2001, 105, 7805-7817.
(18) Zavitsas, A.A. Some Opinions of an Innocent Bystander Regarding the Hofmeister Series.
Curr. Opin. Colloid Interf. Sci. 2016, 23, 72-81.
(19) Bello, J.; Ries, H.C.A.; Vinograd, J.R. Mechanism of Gelation of Gelatin. Influence of Certain Electrolytes on the Melting Point of Gels of Gelatin and Chemically Modified Gelatins.
J. Phys. Chem. 1956, 60, 1299-1306.
(20) Jespers, M.; Rowan, A.E.; Kouwer P.H.J. Tunig Hydrogel Mechanics using the Hofmeister Effect. Adv. Funct. Mater. 2015, 25, 6503-6510.
(21) He, Q.; Huang, Y.; Wang, S. Hofmeister Effect-Assisted One Step Fabrication of Ductile and Strong Gelatin Hydrogels. Adv. Funct. Mater. 2018, 28, art. 1705069.
(22) Andersen, A.; Ibsen, C.J.S.; Birkedal, H. Influence of Metal Ions on the Melting Temperature, Modulus, and Gelation Time of Gelatin Gels: Specific Ion Effects on Hydrogel Properties. J. Phys. Chem. B. 2018, 122, 10062-10067.
(23) Roy, S.; Javid, N.; Frederix, P.W.J.M.; Lamprou, D.A.; Urquhart, A.J.; Hunt, N.T.; Halling, P.J.; Ulijn, R.V. Dramatic Specific-Ion Effect in Supramolecular hydrogels. Chem. Eur.J. 2012,
(24) De Feijter, J.A.; Benjamins, J., Veer, F.A. Ellipsometry as a Tool to Study the Adsorption Behavior of Synthetic and Biopolymers at the Air–Water Interface. Biopolymers 1978, 17, 1759-1772.
(25) Ball, V.; Ramsden, J.J. Buffer Dependance of Refractive Index Increments of Protein Solutions. Biopolymers 1998, 46, 489-492.
(26) Born, M.; Wolf, E. , Principles of Optics: Electromagnetic Theory of Propagation,
Interference and Diffraction of Light (7th ed.), section 2.3.3, Cambridge University Press, 1999.
(27) Setschenov, J. Uber die Konstitution der Salzlösungen auf Grund Ihres Verhaltens zu Kohlensaüre. Z. Phys. Chem. 1889, 4, 117-125.