HAL Id: hal-03251700
https://hal.sorbonne-universite.fr/hal-03251700
Submitted on 7 Jun 2021
HAL is a multi-disciplinary open access
archive for the deposit and dissemination of
sci-entific research documents, whether they are
pub-lished or not. The documents may come from
teaching and research institutions in France or
abroad, or from public or private research centers.
L’archive ouverte pluridisciplinaire HAL, est
destinée au dépôt et à la diffusion de documents
scientifiques de niveau recherche, publiés ou non,
émanant des établissements d’enseignement et de
recherche français ou étrangers, des laboratoires
publics ou privés.
Bruno Ferron, Pascale Bouruet-Aubertot, Katrin Schroeder, Harry L. Bryden,
Yannis Cuypers, Mireno Borghini
To cite this version:
Bruno Ferron, Pascale Bouruet-Aubertot, Katrin Schroeder, Harry L. Bryden, Yannis Cuypers, et
al.. Contribution of Thermohaline Staircases to Deep Water Mass Modifications in the Western
Mediterranean Sea From Microstructure Observations. Frontiers in Marine Science, Frontiers Media,
2021, 8, �10.3389/fmars.2021.664509�. �hal-03251700�
doi: 10.3389/fmars.2021.664509
Edited by: Zhiyu Liu, Xiamen University, China Reviewed by: Lei Zhou, Shanghai Jiao Tong University, China Shengqi Zhou, South China Sea Institute of Oceanology (CAS), China *Correspondence: Bruno Ferron Bruno.Ferron@ifremer.fr Specialty section: This article was submitted to Physical Oceanography, a section of the journal Frontiers in Marine Science Received: 05 February 2021 Accepted: 20 April 2021 Published: 18 May 2021 Citation: Ferron B, Bouruet-Aubertot P, Schroeder K, Bryden HL, Cuypers Y and Borghini M (2021) Contribution of Thermohaline Staircases to Deep Water Mass Modifications in the Western Mediterranean Sea From Microstructure Observations. Front. Mar. Sci. 8:664509. doi: 10.3389/fmars.2021.664509
Contribution of Thermohaline
Staircases to Deep Water Mass
Modifications in the Western
Mediterranean Sea From
Microstructure Observations
Bruno Ferron1* , Pascale Bouruet-Aubertot2, Katrin Schroeder3, Harry L. Bryden4,
Yannis Cuypers2and Mireno Borghini5
1Laboratoire d’Océanographie Physique et Spatiale, Univ Brest-CNRS-IFREMER-IRD-IUEM, Brest, France,2Sorbonne
Université (UPMC, Univ Paris 06)-CNRS-IRD-MNHN, LOCEAN, Paris, France,3Consiglio Nazionale delle Ricerche – Istituto
di Scienze Marine (CNR-ISMAR), Venice, Italy,4Ocean and Earth Science, University of Southampton, Southampton,
United Kingdom,5Consiglio Nazionale delle Ricerche – Istituto di Scienze Marine (CNR-ISMAR), Lerici, Italy
Recent observations from profiles of temperature and salinity in the Algerian Sea showed that salt finger mixing can significantly warm and salinify the deep waters within a period of 2 years, thereby contributing to the erosion of deep water properties formed during winter convection episodes. In this study, heat, salt, and buoyancy fluxes associated with thermohaline staircases are estimated using microstructure observations from four locations of the Western Mediterranean Sea: The Tyrrhenian Sea, the Algerian Sea, the Sardino-Balearic Sea, and the Ligurian Sea. Those fluxes are compared to the rare estimates found in the Mediterranean Sea. Microstructure data show that the temperature variance dissipation rate is one to three orders of magnitude larger in the strong steps that separate weakly stratified layers than in the layers, while the turbulent kinetic energy dissipation rate remains usually weak both in steps and layers. In the steps, the turbulent eddy diffusivity of salt is on average twice as large as that of temperature. The buoyancy flux ratio decreases with the density ratio. It is found that staircases induce a downward heat transfer rate of 46 to 103 × 109 W over the
whole western basin, and a downward salt transfer rate of 4.5 to 10.3 × 10³ kg s−1
between 1000 and 2000 m. This heat convergence is 2–5 times as large as the western Mediterranean geothermal heat flux in this depth range. Over the whole western basin, heat and salt convergences from salt-fingering staircases are 50% to 100% of those generated by mechanical mixing. Finally, it is found that heat and salt convergences from geothermal heating, salt-fingering and mechanical mixing can balance a deep water upwelling of 0.4 × 10⁶m3 s−1.
Keywords: microstructure, double-diffusion, staircases, Mediterranean basin, turbulence, salt-fingering, upwelling, mixing
INTRODUCTION
Staircases form a remarkable characteristic of hydrological profiles of some regions of the western Mediterranean Sea. They sign up as a continuous succession of well mixed regions with weak vertical property gradients (layers) interlaced with strong interfaces (steps) with large property gradients. Interfaces have typical thicknesses of few meters up to few tens of meters, while layer thicknesses can reach several hundreds of meters. Such profiles were observed in the Tyrrhenian Sea (Johannessen and Lee, 1974; Molcard and Tait, 1977; Zodiatis and Gasparini, 1996) as well as in the Algerian Sea (Krahmann, 1997; Bryden et al., 2014, B14 hereinafter; Taillandier et al., 2020). Those studies showed that staircases often exhibit persistence over time from months to years, and strong lateral coherence that can reach several tens of kilometers to hundreds of kilometers. Such a spatial coherence was nicely illustrated from seismic images in the Tyrrhenian Sea where some interfaces were tracked up to 200 km (Buffett et al., 2017). The time coherence in the staircases of the central Tyrrhenian Sea was recently remarkably evidenced from a hydrographic station repeated from 2003 to 2016 (Durante et al., 2019).
Staircases formed between the warm and salty Levantine Intermediate Water (LIW) and the relatively colder and fresher deep waters. The large-scale vertical contrasts in temperature and salinity between those water masses lead to a density ratio Rρ = αθz/βSz close to 1.25, where
α is the thermal expansion coefficient, β is the haline contraction coefficient, θz and Sz are the large-scale vertical
gradients of potential temperature and salinity, respectively. Such a low density ratio makes the water column prone to salt fingering, an instability process that builds upon the difference in molecular diffusivities of heat and salt (Turner, 1967; see Radko, 2013, for a recent extensive review of implied processes). This instability releases the potential energy stored in the salinity field and efficiently transfers heat and salt downward.
Recently, B14 used the time evolution of heat and salt contents between two hydrographic cruises in the Algerian Sea to derive averaged integral estimates of temperature, salt and buoyancy fluxes induced by salt fingering processes between 2008 and 2010. They estimated that the mean eddy diffusivity for heat and for salt in the staircase steps of the Algerian Sea were KT = 2.0 × 10⁻⁵ m2 s−1 and KS = 3.7 × 10⁻⁵ m2 s−1,
respectively.
In this study, we reverse the approach and use microstructure data from staircases of the western Mediterranean to derived eddy diffusivities, salt, heat and buoyancy fluxes with the assumption that salt fingering is the dominant process responsible for the staircases. The hydrology of staircases by region of the western Mediterranean and the characteristics of staircases derived from the microstructure are presented. Heat and salt fluxes from salt fingering, mechanical mixing and geothermal heating are estimated and their impact on the fate of deep water masses are discussed.
MATERIALS AND METHODS
Microstructure Data Set
The study of staircases relies on the microstructure dataset gathered on board the Urania R/V during five cruises with our deep microstructure profiles VMP-6000 (Rockland Scientific Int.): VENUS and ICHNUSSA in 2013, MEDOCC, EMSO, and ICHNUSSA in 2014 (Ferron et al., 2017). Additional microstructure profiles located along the French coast were not considered since they mostly sampled the upper 600 m of the water column; none of them showed any sign of staircases. The three profiles from the Ionian sea did not show any staircase structure. Some characteristics of the cruises are summarized in
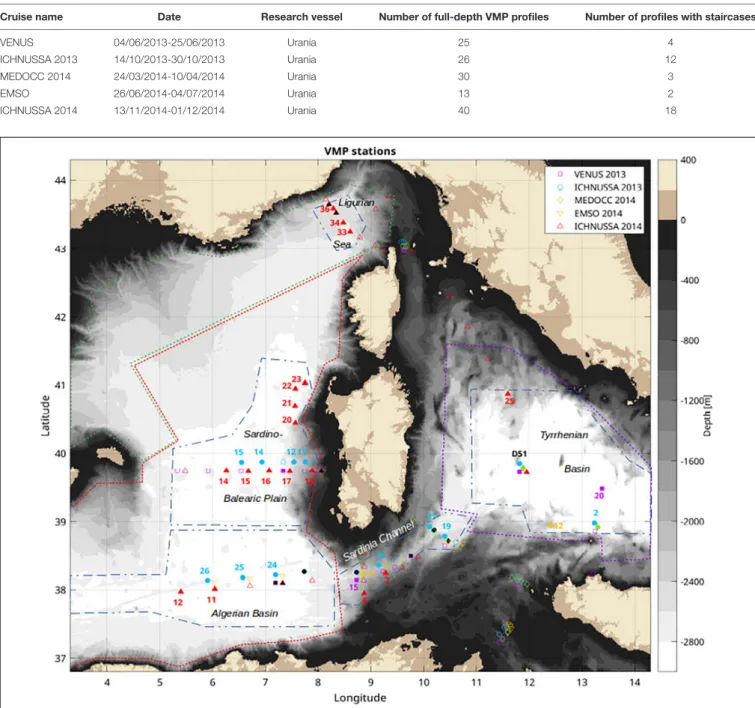
Table 1. A total of 134 profiles distributed over 66 distinct station locations were considered in this study (Figure 1).
Identification of Staircases
Profiles showing a staircase structure were selected after examining their temperature, salinity, and density profiles. Staircases are marked by a succession of mixed layers separated by stratified steps. Mixed layers are characterized by a quasi-homogeneous temperature, salinity and thus density, and are therefore different from homogeneous density layers issued from density-compensated temperature and salinity gradients (not considered here). The depth range at which a staircase starts and ends were selected by hand to avoid any inclusion of isolated mixed layers.
The hydrology used to identify layers and steps came from the seabird SBE 3F temperature and the SBE 4C conductivity sensors that equipped the microstructure profiler VMP-6000. Since the conductivity cell was not pumped, spiking was frequent when the cell crossed a staircase step. Consequently, the automatic identification of layer and step depths was done solely upon the temperature profile. Using both temperature and density to identify the boundaries of steps and layers gave less accurate results. The nearby CTD 911 profiles from the ship carousel exhibit somewhat less intense spiking. However, they were not used because steps and layers may be shifted in pressure in a complicated way and do not have necessarily the same shape as those from the VMP CTD, since both platforms were not exactly collocated in space and time. Averaging microstructure properties from the VMP on steps and layers identified from the CTD 911 would not produce accurate statistics.
Once manually given the depth range of a staircase, layer and step depths were automatically calculated. Layers were first identified as regions having a temperature gradient smaller than a critical depth dependent profile. This critical profile,θzc, was
defined the following way: (1) the potential temperature profile was first differentiated over a vertical distance of 0.5 m and the resulting raw temperature gradient was low-pass filtered using a moving-mean of 1 m length; (2) this filtered temperature gradient,θzlp, was bin-averaged at 10 depth-points equally spaced
and the resulting 10 points were linearly extrapolated at all depths to form a very large-scale temperature gradient profile,θzls; (3)
this very large-scale temperature gradient was bounded by two values,θz1= 2 × 10⁻⁴◦C/m andθz2= 5 × 10⁻⁴◦C/m, to form
TABLE 1 | Oceanographic cruises that contributed to the microstructure data set used in this study (R/V URANIA).
Cruise name Date Research vessel Number of full-depth VMP profiles Number of profiles with staircases
VENUS 04/06/2013-25/06/2013 Urania 25 4
ICHNUSSA 2013 14/10/2013-30/10/2013 Urania 26 12
MEDOCC 2014 24/03/2014-10/04/2014 Urania 30 3
EMSO 26/06/2014-04/07/2014 Urania 13 2
ICHNUSSA 2014 13/11/2014-01/12/2014 Urania 40 18
FIGURE 1 | Location of VMP stations gathered along five cruises done in 2013 and 2014. Each cruise has specific color and marker. For clarity, markers are offset around the VMP cast location to distinguish between cruises for a same station. When staircases with clear alternating steps and layers are observed on a profile, the marker is filled with the corresponding cruise color. Markers filled with black correspond with stations showing some smooth or fuzzy staircases that are not taken into account in this study. Unfilled markers are stations without any obvious staircases. Note that the numbering of a same station usually differs from a cruise to the other. Blue dashed-dotted lines delineate the maximum area attributed to the four regions showing staircases. The area of the Algerian Sea extends up to the Alboran Sea and that of the Tyrrhenian Sea extends slightly further eastward (cut for clarity). Colored dotted lines are used to delineate regions for mechanical mixing estimates: red for the Algerian Sea to the Northern boundary layer, green for the boundary layer, purple for the Tyrrhenian Sea, Sardinia Channel remains delimited by the blue dashed-dotted line.
the critical profile such that: θz1< θzc =θzls< θz2; (4) finally,
a layer was detected wheneverθzlp< θzc. The step 3 ensures to
detect layers in the upper part of the water column (i.e., 600– 1000 m) where layers tend to have slightly larger temperature gradient than deeper layers. The two thresholdsθz1andθz2apply
to the western Mediterranean stratification and would need to be adjusted if the same method had to be applied to another oceanic region. The sensitivity of diagnosed layer thicknesses to θz2 is
larger than to θz1 but remains small: changingθz2 by a factor
half as much by 5–10 dbar. As staircases are characterized by a continuous succession of layers and steps, steps were diagnosed as regions separating two layers.
The presence of temperature gradient inhomogeneities of small vertical extent within a layer can split layers in several segments separated by very thin steps, which a human-eye processing would not do. To avoid this segmentation of layers, steps were required to have a vertical extent of at least 2 m. The value of 2 m, which represents more than 3 s of data, was chosen since it also ensures a correct denoising of microstructure shear data from spurious platform vibrations (Goodman et al., 2006). In the same spirit, layers were required to have a length of at least 4 m.
The density ratio Rρ is an important parameter for the characterization of the environment in which layers and steps develop. For a given layer number k on the vertical, Rρ was calculated using the median temperature and median salinity difference between layer k−1 and k + 1. For a step number k on the vertical, Rρ was calculated using the difference between the median temperature and median salinity difference of layer k above the step k and layer k + 1 below the step. The median was chosen rather than the mean since the median over a layer is not influenced by the smoothing of the conductivity cell at the boundary of mixed layers; it better represents the typical property value of a mixed layer.
Processing of Microstructure Data on
Steps and Layers
Dissipation rates of turbulent kinetic energy,ε, were estimated from the variance of the vertical shear of horizontal velocities measured at centimetric scale by two shear probes mounted on the VMP. Assuming isotropy, the mean ε per unit mass reads ε = 7.5 ν < uz2 >, where ν is the viscosity of seawater,
and < uz2 > is the variance of the vertical shear of the
horizontal velocity. Individualε estimates obtained every meter were averaged over a layer or a step thickness (the reader is referred toFerron et al., 2014, section 2a for further details of microstructure shear processing).
Dissipation rates χ were estimated from the vertical temperature gradient measured at centimetric scale by two fast thermistors (FP07) mounted on the VMP. For an isotropic turbulence, the rate at which temperature variance is dissipated reads χ = 6 kT < θ’z2 >, where kT is the molecular
diffusivity for temperature and < θ’z2 > is the variance of
the microscale vertical temperature gradient θ’z averaged over
a layer/step thickness. This variance was estimated from the integration over the viscous-convective wavenumber range of the mean layer/step-temperature gradient spectra, which was obtained from the average of individual spectra over 0.5 m-length segments with half-segment overlaps. All segments were detrended and windowed with a Hanning function before taking the FFT. A first estimate of the variance was calculated from an integration of the temperature gradient spectra up to a maximum wavenumber kmax. The wavenumber kmax was
the smallest wavenumber among the Batchelor wavenumber, kB = [ε/(ν kT2)]1/4, the wavenumber knoise above which
the FP07 temperature was contaminated by noise, and the wavenumber ktr associated with the limited time response
τ of FP07 sensors [a conservative value τ of 0.01 s was chosen, Sommer et al., 2013; ktr = 1/(2πτw), where w is
the downcast velocity]. The theoretical Batchelor spectra was then fitted to the averaged temperature gradient spectra so that both have the same variance when integrated up to kmax.
The final temperature gradient variance was calculated by adding the missing variance from kmax to kB from the fitted
Batchelor spectra.
The dissipation ratio reads 0 = χ N2/(2 ε θz2), where
N is the buoyancy frequency. 0 was estimated for each step with the dissipation rates (χ, ε) calculated on the step thicknesses as explained previously, the buoyancy frequency and temperature gradient being estimated from density and temperature differences across the step. Since0 is formed from four noisy variables, it presents a significant scatter.
In the case of salt fingering, the heat to salt buoyancy flux ratio reads: rf = RρKT/KS=0/(0 + 1–Rρ−1) (Hamilton et al., 1989). The eddy diffusivity of temperature is given by the Osborn-Cox relationship KT=χ/(2 θz2) (Osborn and Cox, 1972).Stern (1975)
found that the flux ratio for growing fingers can be expressed as: rf −stern = Rρ –[Rρ (Rρ –1)]1/2. Radko et al. (2014)derived an
expression for the flux ratio based on a fit to DNS results that reads: rf −Radko = a exp(–bRρ ) + c, where (a, b, c) = (2.709,
2.513, 0.5128). Both formulations will be used for comparison with our dataset.
Summary of the Method
From microstructure data, dissipation rates (χ, ε) were calculated. They were used to compute KT and 0 with
the combination of the CTD finestructure data measured concomitantly with the microstructure data. Assuming salt fingering is responsible for the generation of observed staircases, the knowledge of 0 allowed for the calculation of rf, from which kS is deduced. Once eddy diffusivities were known, the
turbulent fluxes of temperature, FT= KTdθ/dz, and salt, FS= KS
dS/dz, were estimated.
For comparison, eddy diffusivities due to mechanical mixing were derived from ε using the Osborn relationship that reads: Kturb = 0.2 ε N−2 (Osborn, 1980), with a constant mixing
efficiency of 0.2 for moderate turbulent intensity (8.5< Reb =ε
ν−1N−2< 400, where Re
bis the turbulent intensity or buoyancy
Reynolds number; Bouffard and Boegman, 2013). Turbulent tracer fluxes generated by mechanical mixing can then be inferred multiplying Kturb by the appropriate finescale tracer gradients dθ/dz and dS/dz.
RESULTS
Geographical Distribution and Anatomy
of Staircases
Hydrological stations with staircases are found in several regions of the western Mediterranean Sea (Figure 1, face-colored markers). Few of those stations (face-face-colored in black) have less marked transitions between steps and layers and/or
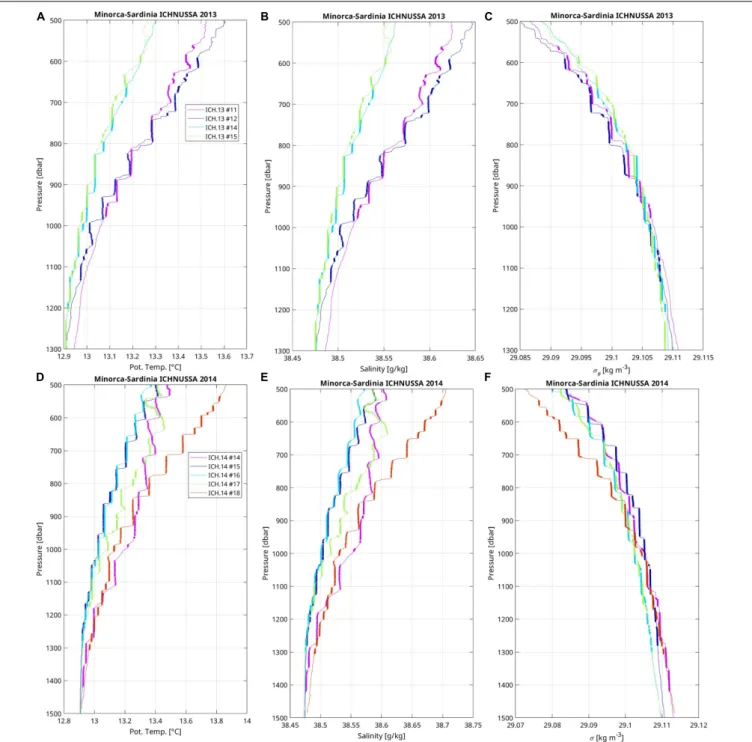
FIGURE 2 | Vertical profiles in staircases of (A,D) potential temperature, (B,E) salinity, and (C,F) potential density of stations located along the Minorca to Sardinia transect during (A–C) ICHNUSSA 2013, and (D–F) ICHNUSSA 2014 fall cruises. Station numbers are indicated in the figure legend (A,D) and located on the map (Figure 1). Layers are emphasized by thick lines with weak vertical gradient segments.
only few isolated layers and will not be considered in the following. Noticeable is also the property that staircases at a given station were not always present when the station was repeated along different cruises (Figure 1, color-filled versus empty markers). For instance, during the transect from Minorca to Sardinia, staircases are largely present during the ICHNUSSA fall cruises of 2013 and 2014, while only one station have staircases in the summer VENUS cruise of 2013. Advection
patterns or staircase formation process may be responsible for such a variability. Oppositedly, the central station #51 from the Tyrrhenian sea always exhibited staircases as also reported byDurante et al. (2019).
Staircases are observed at several stations along the Minorca-Sardinia transect during ICHNUSSA 2013 (Figures 2A–C) and ICHNUSSA 2014 (Figures 2D–F). Those of 2013 lies in the range 600–1300 dbar, with an increase of the deeper limit of
the pressure range from Sardinia (sta. #11, 980 dbar) to the middle of the basin (sta. #15, 1300 dbar). The density of the deepest layer very slightly increases westward by 0.002 kg m−3
from station 11 to station 15 (the Mediterranean Sea is weakly stratified at depth; for instance, the averaged buoyancy frequency is 3 × 10⁻⁴
s−1
between 800 and 2400 dbar in this region). Most of the layers are remarkably mixed, but some also show slight decreases in temperature and salinity so as to produce layers with an homogeneous density. All profiles show layer thicknesses from few meters up to 60 m, one layer reaching 90 m (ICH. 13 #14). In that same region, layers observed in fall 2014 lie in the range 500–1400 dbar, similarly to 2013. Some profiles present remarkable sharp transitions between steps and well mixed layers both in temperature, salinity, and density (e.g., ICH. 14 #18, ICH. 14 #15 below 670 dbar). The sharpest transitions are better seen in temperature than in salinity or density because the unpumped conductivity cell has a longer response time than the temperature sensor due to its thermal mass effect. On this series of profiles, some layers are not fully mixed and instead exhibit weak temperature gradient compensated by salinity gradients (e.g., ICH. 14 #14). Along this transect, 59% (resp. 92%) of the steps have a thickness smaller than 10 dbars (resp. 20 dbars). Layers are on average thicker in 2014 than in 2013 on this transect: 33% (resp. 44%) of the layers have a thickness smaller than 20 dbars and 27% (resp. 7%) are thicker than 60 dbars.
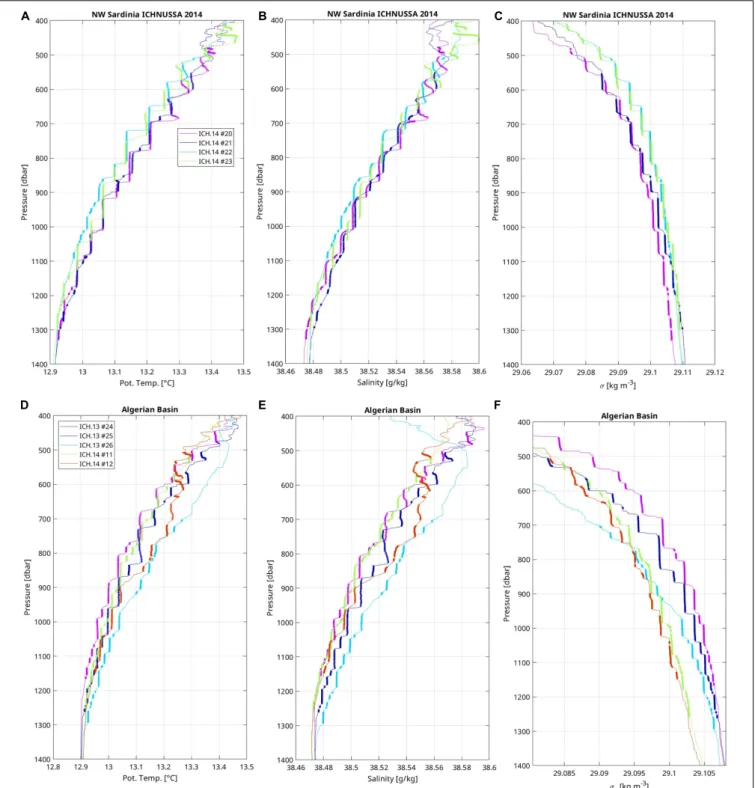
During fall 2014, staircases are observed exceptionally as far north as to 41◦
N, off the western coast of Sardinia (Figure 1, sta. #20-23). They share many common characteristics with staircases located further south along the Minorca-Sardinia transect. For instance, many steps and layers of profiles ICH. 14 #20 and #22 (Figures 3A–C) show temperature-salinity properties close to those of ICH. 14 #15 and #16 (Figures 2D–F); layers and steps are often simply offset in pressure by few tens of dbars. Statistics on layer thicknesses are also similar to the fall 2014 Minorca-Sardinia transect with 23% of the layers having a vertical extent larger than 60 dbar. Those large-scale coherent observations are consistent with the large spatial coherence usually observed in staircases that can reach several hundreds of kilometers. Here, the distance between ICH. 14 #15 and #22 amounts to 153 km.
Consistently with observations made in 2006, 2008, and 2010 (B14), staircases were also found in the Algerian sea from 500 to 1300 dbars during the fall cruises of 2013 and 2014 (Figures 3D–
F). In this region, 42% of layer thickness is smaller than 20 dbars and 11% is larger than 60 dbars.
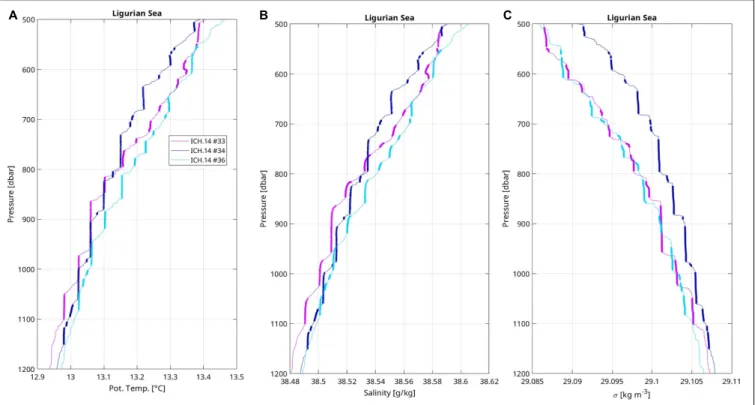
In the Ligurian sea, three stations exhibited clear staircases between 500 and 1150 dbar during fall 2014 (Figure 1, #33, 34, 36). Steps tend to be thicker with weaker property gradients than in most previously presented profiles with staircases (Figures 4A–C). Along this transect, 40% (resp. 77%) of the steps have a thickness smaller than 10 dbars (resp. 20 dbars), which is lower than percentages along the Minorca-Sardinia transect of fall 2014 (resp. 59% and 92%). Most of the layers are well mixed in temperature and salinity. Their thickness follows statistics similar to other groups of staircase profiles: 47% of the layers are thinner than 20 dbars and 9% are thicker than 60 dbars.
In the central Tyrrhenian sea, the station #51 was sampled along four cruises (Figure 1). It was repeated twice, 7 days apart,
during the spring cruise of 2014. This station shows the most impressive succession of layers and steps that extend from 600 to 2800 dbars (Figures 5A–C). Steps are rather thin and sharp with 73% (resp. 91%) of the steps thinner than 10 dbar (resp. 20 dbar), those percentages being close to steps observed on the Minorca-Sardinia transect. The D51 station has also the thickest layer of our dataset with a maximum value of about 400 dbars. For this station, 51% of the layers are thinner than 20 dbars, and 33% are thicker than 60 dbars. Among all regions of the western Mediterranean sampled with the VMP, the Tyrrhenian sea concentrates all the layers that have a thickness larger than 130 dbars (36 occurrences). The repetition of the D51 station shows that strong steps and thick layers are robust features that persist over time (i.e., around 1100 dbar, 1400 dbar, and 1800–1900 dbar), as shown byDurante et al. (2019). There also exists significant differences: in the upper part of the staircases (Figure 5, Inset 1), smooth profiles of temperature and salinity with no step are found for the VENUS sta. #3 between 600 and 820 dbar. Four months later, fourteen layers of thickness usually smaller than 15 dbar (one reaches 30 dbar) are present in that same pressure range (ICH. 13 #7). Five months later, only 3–4 layers are visible, the largest being 40 dbar-thick (MEDOCC #20 and 30). Seven months later, nine layers are present, three of them being thicker than 25 dbar (ICH. 14#24). Interestingly, this evolution in time is also found deeper at the step around 1100 dbar (Figures 5A–C, Inset 2), where rather smooth temperature and salinity profiles are found during VENUS, 3–4 small layers (<20 dbar thick) during ICHNUSSA 2013, and one thicker layer (40–55 dbar) for the following cruises. Properties and vertical position of layers are consistent over distances of at least 140 km, between D51 and stations located further to the southeast: temperature and salinity staircases are largely consistent from 700 to 2100 dbar between VENUS station #20 and the station #51 of MEDOCC, as well as for the layers between 1400 and 2100 dbar between station #51 and station #2 of ICHNUSSA 2013 (see station number on the map of Figure 1).
Density Ratio and Thickness of Steps
and Layers
Radko et al. (2014)reported a significant connection between the density ratio and the shape of staircases: the step thickness sharply increases as the density ratio decreases (Radko, 2005, his
Figure 3). He also noted that oceanic salt-finger staircases were only observed when Rρ < 2. With these idea in mind, we now examine properties of density ratios, layer and step thicknesses.
The probability density function (PDF) of the density ratio of steps and layers follows the same distribution (Figure 6A). The PDF is maximum for Rρbetween 1.1 and 1.2 for both steps and layers and rapidly decays away from that maximum. The PDF shows that 68% (resp. 88%) of the layers have a Rρ between 1.1 and 1.3 (resp. between 1.0 and 1.4). For the steps, 56% (resp. 80%) have a Rρ between 1.1 and 1.3 (resp. 1.0 and 1.4). There was no noticeable difference between cruises. The mean density ratio of steps is 1.25.
The classification of Rρ by geographical subregions shows that there are no striking regional differences (Table 2).
FIGURE 3 | Vertical profiles in staircases of (A,D) potential temperature, (B,E) salinity, and (C,F) potential density of stations located (A–C) to the north west of Sardinia during ICHNUSSA 2014, and (D–F) in the Algerian sea during ICHNUSSA 2013 and 2014 fall cruises. Station numbers are indicated in the figure legend (A,D) and located on the map (Figure 1). Layers are emphasized by thick lines with weak vertical gradient segments.
A group of layers with thicknesses larger than 30 dbar and a Rρ exceeding 1.6 among those located west of Sardinia departs from the ensemble (Figure 6B, magenta points). A closer look at those points evidences layers that are less homogeneous than most other layers: their top to bottom
potential temperature difference shows that 84% of them are marked by a temperature increase of at least 0.005◦
C, while this percentage drops to 16% for the layers with Rρ < 1.6. Layers with slight temperature gradients compensated by salinity were noticed in the previous section (e.g., Figures 2D–F, sta.
FIGURE 4 | Vertical profiles in staircases of (A) potential temperature, (B) salinity, and (C) potential density of stations located in the Ligurian sea during ICHNUSSA 2014. Station numbers are indicated in the figure legend (A) and located on the map (Figure 1). Layers are emphasized by thick lines with weak vertical gradient segments.
FIGURE 5 | Repeated vertical profiles of (A) potential temperature, (B) salinity, and (C) potential density at the D51 station located in the Tyrrhenian sea during four cruises in 2013–2014. Cruise names are indicated in the legend. Note that two realizations were done during the MEDOCC 2014 spring cruise. The D51 station is located on the map (Figure 1). Layers are emphasized by thick lines with weak vertical gradient segments. Insets 1 and 2 shows enlargements of the profile.
FIGURE 6 | Properties associated with density ratios Rρ: (A) PDF of Rρfor layers and steps, (B) relationship between layer thickness (log scale) and Rρby region (dots) with the overall mean (black line) and 10th- and 90th-percentile (gray lines) for bins having at least 30 members, (C) same as (B) for step thickness, (D) examples from VENUS 2013 cruise of density ratio profiles from two selected stations showing no staircase: sta. #12 (west Sardinia) along the Minorca-Sardinia transect, and sta. #21 in the southern Tyrrhenian (magenta numbers on Figure 1). The calculation of the Rρ-profile is done with two depth intervals (7 m and 70 m).
ICH. 14 #14) and may be the sign of lateral intrusions as observed byTaillandier et al. (2020).
There is no indication of a clear relationship between step or layer thicknesses and density ratios (Figures 6B,C). The
mean thickness per density ratio bin (black line) is rather flat, with small maxima around density ratios of 1.2–1.25. The 90th percentile of layer thickness (gray line) has a more pronounced maximum than that of step thickness due to the thick layers of
TABLE 2 | Regionally averaged characteristics of steps and layers with 1< Rρ < 1.5.
Sardino-Balearic Sea Algerian Sea Ligurian Sea Tyrrhenian Sea Sardinia Channel Western Mediterranean Averaged thickness [m] steps layers 1136 1130 1628 1357 1323 1238 Averaged1T [ × 10−2 ◦C] steps layers 3.56.5 2.44.6 3.25.9 3.77.0 2.95.6 3.36.2 Averaged1S [ × 10−3 (psu)] steps layers 8.415 5.711 7.514 9.117 7.514 8.015
Averaged Rρsteps layers 1.231.23 1.241.23 1.231.23 1.191.18 1.151.15 1.201.20
Averaged N [ × 10−3s−1]
step layer
0.251.7 0.231.3 0.231.2 0.251.9 0.221.1 0.241.6
Number of steps layers 153155 7074 3536 188199 125126 571590
the Tyrrhenian Sea. Nearly all (92%) of the largest thicknesses (layers> 100 m) have a Rρbetween 1 and 1.3. For a given density ratio, a large range of thicknesses are reached, and conversely a given thickness is found over a large range of density ratios. The absence of clear trend between thickness and density ratio may be attributed to several factors. First, the range of density ratio maybe too narrow to clearly exhibit a trend. This dataset has too few points to form any reliable mean in the range 1.5< Rρ
< 2. The large-scale background vertical profile of density ratio for profiles without staircase typically varies between 1.2 and 1.4 in the upper 2000 m, and up to 1.5 in the deep layers of the Tyrrhenian Sea (Figure 6D, blue and red lines). We cannot infer from this dataset what would be the step/layer thicknesses of staircases having a large-scale initial Rρlarger than 1.5. However, we do observe some thicknesses with density ratios above 1.5. Second, the observed scatter may be explained by finestructure contamination: The calculation of the vertical profile of Rρusing two different vertical intervals (7 m and 70 m) on profiles without staircase at the moment of the cruise illustrates that the shorter the interval, the larger the Rρrange (Figure 6D). Thus, shorter steps and layers will exhibit more variability in their Rρ. Third, another part of the scatter is related to the staircase formation itself. Recent direct numerical simulations (DNS) of oceanic salt fingering showed that, with a fixed background density ratio of 1.2, staircases develop with steps having a density ratio mostly contained in the range 1.5–1.8 (Yang et al., 2020). Despite DNS cannot reproduce large domains and the exact realism of oceanic conditions, it is interesting to note that the process of staircase formation changes the density ratio even when the large-scale density ratio is perfectly controlled. This DNS result is consistent with Radko (2005)’s equilibrium theory of staircases: starting from a background density ratio favourable to double-diffusive instability, staircases will develop steps and layers over few years; layers then progressively merge, increasing their thickness and the density ratio of steps, until an equilibrium is reached. For instance, for a starting background density ratio of 1.2, the density ratio of steps is expected reach 1.7 at the equilibrium, which can take decades (Radko, 2005;Radko et al., 2014). In the meantime, the density ratio of steps is expected to cover the range 1.2–1.7. Thus, the observed scatter may be a sign that staircases have not reached an equilibrium state.
Dissipation Rates of Steps and Layers
The distributions of kinetic energy dissipation rates ε of steps and layers are similar: 89% (resp. 82%) of the layers (resp. steps) have a low ε ranging between 3 × 10⁻¹¹ and 3 × 10⁻¹⁰ W
kg−1 (Figure 7A). The mean dissipation rate over all steps is
equal to that of layers 1.2 × 10⁻¹⁰
W kg−1
. Low values ofε in staircase environments are a sign that layers are not produced by mechanical turbulence. It is in agreement with observations of staircases in other areas (Gregg and Sanford, 1987;St. Laurent and Schmitt, 1999;Radko et al., 2014). Sinceε is usually weak in the stratified steps, the turbulence intensity Rebis low: 57% of the
steps have a Rebless than 30 and 76% less than 100 (Figure 7B).
Those low values found at interfaces are in agreement with previous findings when staircases are attributed to pure salt fingering processes (Reb< 30) or salt fingering in presence of very
weak mechanical turbulence (Gregg, 1988; Inoue et al., 2007). Only the Ligurian sea showed slightly enhancedε, with averaged dissipation rates five times as large as in other regions (Table 3 for steps, row 7; see alsoFerron et al., 2017, Figures 1B, 3A).
Contrastingly, the distribution of temperature variance dissipation ratesχ of layers strongly differs from that of steps: 76% of the layers have aχ smaller than 5 × 10⁻¹¹◦
K2s−1
while 83% of the steps have a χ larger than this value (Figure 7C). Such a difference was also noticed by Schmitt et al. (2005)for staircases in the subtropical thermocline of the western Atlantic. The meanχ over all steps is 16 times larger than the mean over all layers (mean for steps is 1.7 × 10⁻⁹◦
K2 s−1
). Gregg and Sanford (1987)found a meanχ for both steps and layers larger by two orders of magnitude than for our dataset, but they observed nearly the same χ-ratio between steps and layers (factor of 19 for their dataset, vs. 16 here). Thermal variance dissipation rates χ observed in the steps of staircases is above typical values for Mediterranean regions deeper than 500 m, with weakε, for which χ is usually smaller than 1 × 10⁻¹⁰◦K2s−1. However, those large
χ values occur in unusually large temperature gradients. Large-scale vertical temperature gradients below 500 m are typically smaller than 1 × 10⁻³◦
K m−1
, while 80% of the staircase steps have a mean gradient larger than this value. In regions outside of staircases (but deeper than 150 m),χ increases with the vertical temperature gradient (Figure 7D, gray dots and black linear fit). It is thus not surprising to observe large values in the steps since
FIGURE 7 | (A) PDF of kinetic energy dissipation ratesε (units W kg−1) for steps (yellow) and layers (green), (B) PDF of turbulence intensity Re
bfor steps, (C) PDF of
temperature variance dissipation ratesχ (◦
K2s−1) for steps (yellow) and layers (green), (D) distribution ofχ as a function of the vertical temperature gradient θ zfor
regions without any staircase deeper than 150 m (gray dots with dashed black linear fit) and for the steps of staircases (red dots with dark red linear fit), (E) PDF of observed dissipation ratio0 (bars) for steps with its lognormal fit (black line), (F) 0 per density ratio (Rρ) bin with the median (red line) and mean (black line) for each bin and the global median (red dashed) and mean (black dashed) for bins having at least 30 steps, the interquartile range (IQR, 50% of the data, gray bars) shows the scatter of the data per bin, (G)0 vs. χ for steps (green dots) with a fit in the loglog phase space (black dashed) and a factor of 3 range from the fit (dotted lines), (H)ε vs. χ for steps (all steps: blue dots; Ligurian: green circles) with a fit in the loglog phase space (red solid line) and a factor of 3 range (red dotted lines), (I) same as (F) for the heat to salt buoyancy-flux ratio rfvs. Rρ, with theStern (1975)relationship (blue line).
they contain large temperature gradient. In the steps,χ follows a similar increase with temperature gradients (Figure 7D, red dots and red linear fit). But for a given temperature gradient in the typical observed range 1–10 × 10−3◦
K m−1
,χ tends to be larger by a factor 3–4 when located in a staircase step than when there is no step.
Dissipation ratios 0 follow a lognormal distribution in agreement with previous findings (Oakey, 1985;Hamilton et al., 1993; Figure 7E). The goodness-of-fit as estimated from the Kolmogorov–Smirnov test (Massey, 1951; Press et al., 1992), shows that, with a probability-value of 0.90, the null hypothesis that the observed0-distribution follows a lognormal distribution cannot be rejected, as the probability-value is above the
significance level of 0.05. The mean (resp. median) of0 is 0.68 (resp. 0.55) for density ratios Rρin the range 1–1.5, with a lowest quartile at 0.19 and highest quartile at 1.1 (Figure 7F, only bins having at least 30 steps are plotted). Mean and median values of0 increase with Rρas noticed in other studies (Hamilton et al., 1989, their Figure 3). For staircases below a Meddy (Mediterranean eddy in the Atlantic) with a similar Rρ of 1.2-1.3 as found here on average, Hamilton et al. (1993) reported a median of 0.58, a lower quartile of 0.3, and upper quartile of 0.8. Our distribution shows a somewhat larger variance which may be attributed to the absence of data smoothing here (Hamilton et al., 1993, used 15 m-smoothed version of0 calculated from 15 m-smoothed variables whereas our 0 is simply calculated
from variables estimated on step thicknesses, 77% of the step thicknesses being lower than 15 m). The distribution of 0 vs. Rρ of this dataset is consistent with observations done in the North Atlantic Tracer Release Experiment (NATRE) in regions favorable to salt-fingering and for Richardson numbers larger than 1 (St. Laurent and Schmitt, 1999).
An increase of0 is observed as a function of both increasing χ (Figure 7G) and dθ/dz, as χ and dθ/dz were shown to be related (Figure 7D). Linear fit in the loglog phase space shows that the 0-estimates based on the fitted relationship 0 = 10aχb, where
a = 2.75 and b = 0.32, predicts 90% (resp. 79%) of the observed 0 within a factor of 3 (resp. 2) for Rρ in the range 1–1.5. In the
same approach,ε tend to increase with χ (Figure 7H). The fitted relationshipε = 10aχb, wherea = −7.55 and b = 0.27, predicts 91% (resp. 79%) of the observedε within a factor of 3 (resp. 2) for Rρ in the range 1-1.5. Most of (80%)ε stepping away from the fitted line by a factor larger than 3 belong to the Ligurian Sea (Figure 7H, green circles). Removing steps from the Ligurian Sea does not change the fit significantly (a = 0.28, b = −7.48; 92% of the observedε within a factor 3, 84% within a factor of 2) since they only represent 4.5% of the steps.
The mean heat to salt buoyancy flux ratio rf over all steps is
estimated to 0.68 (median 0.72) for the density ratio range 1-1.5 (Figure 7I). Steps with abnormally large0 were excluded in the next calculations (2% of the steps with 0 > 5). This flux ratio decreases from a mean of 0.84 (median of 0.87) to 0.66 (median of 0.68) as the density ratio increases from 1 to 1.5 (only bins with at least 30 steps are considered). The dependence of the flux ratio to Rρis consistent with experiments fromMcDougall and Taylor (1984)at those low Rρ. The median flux ratio per density ratio bin is also consistent with theStern (1975)estimates of the flux ratio of growing fingers (Figure 7I, black mean and blue line). The mean-binned flux ratio is 0.1 larger than the recently
derived expression from a fit to DNS results (Figure 7I, green line from Radko and Smith, 2012). Observations from NATRE also exhibited the same decrease range (seeSt. Laurent and Schmitt, 1999, their Figure 10). The mean-binned heat to salt diffusivity ratio KT/KS decreases from 0.79 at Rρ = 1.05 to 0.45 at Rρ
= 1.45. This decreasing trend is consistent with that observed at NATRE (St. Laurent and Schmitt, 1999) and from simulations (Stern et al., 2001). The averaged diffusivity ratio over all steps is 0.54. The mean diffusivity over all steps is 6.7 × 10⁻⁵m2s−1for
temperature and 12.0 × 10⁻⁵m2s−1for salt. More interestingly,
the regional-mean diffusivity varies from 3.6 × 10⁻⁵ m2 s−1
(Ligurian Sea) to 9.8 × 10⁻⁵
m2 s−1
(Tyrrhenian Sea) for temperature, and from 9.4 × 10⁻⁵
m2 s−1
(Algerian Sea) to 20 × 10−5m2s−1 (Ligurian Sea) for salt (Table 3, row K
Tand
KS). Diffusivities from the Algerian Sea are consistent with those
of the nearby Sardino-Balearic Sea. Diffusivities from the Sardinia Channel, which connects the Algerian Sea to the Tyrrhenian Sea, are midway between those of the two connected seas. Finally, we can note that those eddy diffusivities induced by salt-fingering are 2.5–5 times larger than what mechanical turbulence would produce given the weak turbulent kinetic energy dissipation rates, except for the Ligurian Sea where the opposite is found due to the larger levels of mechanical turbulence (Table 3, row Kturb).
DISCUSSION
Heat, Salt and Buoyancy Fluxes
From repeated zonal CTD transects in the Algerian Sea in 2006, 2008, and 2010, B14 noticed consistent staircase structures from about 600 to 1400 m. Below the staircases, in a transition region, they observed a coherent increase in temperature and salinity among the years and at all stations from the base of the staircases
TABLE 3 | Salt fingering properties with regional averaged estimates of temperature (KT) and salt (KS) eddy diffusivities, temperature flux (FT), salt flux (FS), buoyancy flux
(Jb), kinetic energy dissipation rate (ε), flux ratio (r), heat and salt transfers.
Sardino-Balearic Sea Algerian Sea Ligurian Sea Tyrrhenian Sea Sardinia Channel Western Mediterranean
KT[ × 10−5m s−2] 5.0 5.1 3.6 9.8 7.8 6.3 KS[ × 10−5m s−2] 9.5 9.4 20 16 12 12 FT[ × 10−8 ◦C m s−1] −15.2 ± 11% −9.4 ± 16% −6.3 ± 19% −14.0 ± 10% −16.1 ± 11% −11.9/−12 ± 8% FS[ × 10−8(psu) m s−1] −5.9 ± 10% −3.8 ± 14% −7.0 ± 13% −6.0 ± 9% −5.9 ± 10% −5.0/−4.9 ± 7% Jb[ × 10−11W kg−1] −10 ± 4% −7.5 ± 5% −38 ± 6% −12 ± 4% −8.1 ± 5% −10.8/−9.5 ± 2% ε [ × 10−11W kg−1] 10 ± 3% 7.5 ± 5% 38 ± 6% 13 ± 3% 8.2 ± 6% −11/−9.6 ± 2% 0 0.64 0.56 0.11 0.57 0.64 Area max/min [ × 106m2] 40,000/20,000 90,000/45,000 10,000/0 50,000/25,000 10,000/0 200,00090,000 Heat transfer [GW = × 109W] −26/−13 ± 11% −36/−18 ± 16% −2.7/0 ± 19% −30/−15 ± 10% −7.0/0 ± 11% −103/−46 ± 8% Salt transfer [ × 103kg s−1] −2.4/−1.2 ± 10% −3.5/−1.7 ± 14% −0.7/0 ± 13% −3.1/−1.5 ± 9% −0.6/0 ± 10% −10.3/−4.5 ± 7% Staircase depth range
[m]
500–1300 400–1300 500–1200 600–2800 700–1200
Number of steps 153 70 35 188 125 571
Quantities were calculated from steps in staircases. Negative signs indicate downward fluxes. Each region extends over an estimated maximum and minimum area (row 9) of salt-fingering activity used to infer the global averaged fluxes (weighted by max/min area) at the scale of the northwestern Mediterranean sea (last column). Maximum areas are delineated by the dashed-dotted blue lines on Figure 1. Depth range of staircases and number of steps are given for each sub-region. Note that only steps with density ratio between 1 and 1.5 were considered (82% of the total amount of staircase steps). Uncertainties appearing in this table were computed from the only contribution of lognormally distributed errors inχ and ε, additional errors exist (see text).
to 2300 m, below which new deep waters formed in 2006 spread. Since the transition region was isolated and not ventilated by significant convection events between 2008 and 2010, B14 assumed that the heat and salt convergence in the transition region was only due to the activity of salt finger processes. With those reasonable assumptions, they computed the heat and salt fluxes necessary to warm and salinify the transition region within 2 years. They found a downward flux FS08−10= −5.35 × 10⁻⁸
(psu) m s−1for salt and F
T08−10Alg= −12.4 × 10⁻⁸
◦
C m s−1for
heat (a negative sign indicate a downward flux). Consequently, their buoyancy flux ratio is rf08−10Alg = 0.74. The superscript
08–10Alg means that the numbers stands as an average over 2008–2010 for the Algerian Sea. Those downward fluxes imply, for the steps, an eddy diffusivity KS08−10= 3.7 × 10⁻⁵m2s−1for
salt and KT08−10Alg= 2 × 10⁻⁵m2s−1for temperature.
For comparison, we extracted from our dataset the profiles with steps and layers located in the Algerian Sea. They were used to compute the fluxes of heat and salt following the section “Summary of the Method”. Note that our method is fully independent from that of B14. B14 observed a bulk increase of heat and salt content to calculate the needed heat and salt fluxes and the eddy diffusivities. In our study, we measure the eddy diffusivities with the microstructure and finestructure to calculate the implied downward fluxes.
We found fluxes of FS13−14Alg=< – KS×dS/dz> steps=
−3.8×10⁻⁸ (psu) m s−1 for salt and F
T13−14Alg = < – KT
× dT/dz > steps = −9.4 × 10⁻⁸
◦
C m s−1
for heat. The superscript 13–14Alg remind the reader that the numbers stand as an estimate from profiles measured over 2013–2014 for the Algerian Sea. Our fluxes are lower than B14 fluxes by 24% for heat and 29% for salt. Consequently, our buoyancy flux ratio is almost the same, rf13−14Alg = 0.73. Our estimates remain
relatively consistent with B14 despite the period covered is not the same and the area covered by B14 is larger as it extends to the western part of the Algerian Sea. B14 produced fluxes averaged over 2 years while our estimates come from snapshots of staircases. However, consistency between B14 and our estimates is somewhat expected despite those differences. Indeed, B14 reported that staircases had a significant coherence between profiles distributed zonally as we observed for the staircases of the Tyrrhenian sea in this dataset. Thus, the location of our profiles confined to the eastern Algerian Sea may be less than an issue. Lateral coherence of staircases is commonly reported (Schmitt et al., 1987;Buffett et al., 2017). The period covered is not the same and certainly adds some variability, but here too, the existence of staircases over long period of time (several years, sometimes decades) is a usual observation that tend to introduce some time consistency between estimates. The larger source of differences may rather come from the limited number of profiles (five profiles with a total of 70 steps) in the Algerian Sea to make robust statistics (convergence of the mean). Noting that southern and northern regions of the Algerian Sea are connected by barotropic cyclonic gyres (Testor et al., 2005), we included the staircase profiles west of Sardinia, which adds 14 profiles with 153 steps to the former 70 steps (Table 3, last row). The downward heat flux associated with the Sardino-Algerian Sea increases to
FT13−14Sard−Alg = −13.2 × 10⁻⁸
◦
C m s−1 and the salt flux to
FS13−14SardAlg= −5.1 × 10⁻⁸(psu) m s−1. The observed increase
is due to the larger downward fluxes of the Sardinia-Balearic Plain (Table 3, column 2 and 3). Those latter estimates are within 6% of B14 estimates and give an idea of the sensitivity of the estimates and averaging. In this regard, estimates from the Ligurian Sea, which counts too few profiles with staircases, have probably the largest uncertainties from all regions.
The same calculation of fluxes were done for each region (Table 3). The Tyrrhenian Sea and the Sardinia Channel have slightly larger fluxes than other regions, all fluxes holding within a factor of two. A mean flux for the western Mediterranean sea can be formed weighting each regional flux with a corresponding area based on present and past observations. To take time variability into account, a minimum and maximum area of staircase activity was ascribed to each region (Table 3, row 9; maximum areas are delineated by the dashed-dotted blue lines on Figure 1), the Tyrrhenian and the Algerian seas showing the longest space-time staircase coherence. Bounding the area of staircases in the Ligurian Sea is the most uncertain due to a lack of staircase observations in space and time.
The derived fluxes rely on correct estimates of the dissipation ratesχ and ε. A worse case scenario is to assume that individual estimates of χ and ε are blended with lognormally distributed errors, so that individual estimates are, on average, distant from the true value by a factor of 6 for χ and 3 for ε. The scatter is larger on χ since it requires the knowledge of both ε and the temperature spectra in the dissipation range, which does not necessarily resolve the spectral roll off. A first average of individual values ofχ and ε is made on each step, which reduces the scatter to an average factor of 3.7 to 2 forχ, and 1.7 to 1.3 forε, for typical step thicknesses increasing from 3 to 15 m (3/4 of the steps). Regional estimates of FT and FS are derived from
averages of fluxes calculated at each step included in the region. The larger the cumulated thicknesses of steps in the region (which also depends on the number of available profiles), the smaller the error. The distribution of step thicknesses per region (Figure 6C) was used to propagate the errors inχ and ε to get the uncertainties in FTand FSper region (Table 3). Despite individual errors onχ
andε may be large in this worse case scenario, the final error on FTand FSare limited to 10-20% due to the “heavy” averaging.
Additional uncertainties can arise from processing issues and from the contribution of unobserved regions (representativity error). Processing issues cover the method used to locate the boundaries between layers and steps, which can somewhat influence the estimates of step and layer thicknesses and the determination of property gradients for instance. Another 10% of uncertainty could be ascribe to this sensitivity. The representativity of the data is another issue. For instance, we have no microstructure profile in the western part of the Algerian Sea although we know that staircases exist there (B14). The impact of missing microstructure observations due to unobserved regions or unobserved periods should not strongly change the results of Table 3. As already argued, staircases are often coherent over long time and long distances. The best example of the robustness of our estimates is evidenced in Table 3: from one
region to the other, regional fluxes remain within a factor of two despite regions are geographically distant with a variety of dynamical processes present in each basin (eddies, internal waves, surface forcings). However, for the Ligurian Sea, which has too few observations of staircases available and the largest epsilon as a result of intense dynamical processes (waves, eddies, and current), the uncertainty is larger but the area of staircase activity is smaller than in other regions.
Regional heat and salt transfer rates from intermediate depths of the saline and warm LIW to deep water masses are derived from the combination of regional fluxes and area over which staircases extend (heat transfer rate =ρ0Cp FT A, salt transfer
rate = ρ0 FS A, where A is the horizontal area of staircases,
ρ0= 1027 kg m−3, Cp= 4200 J◦K−1kg−1is the heat capacity of
seawater). The lower and upper area estimates of staircase activity give a range for the transfer rates (Table 3, row 10 and 11). On short timescale, such regional heat and salt transfers can increase the local temperature of a 1000 m-thick water column by 0.002– 0.005◦
C over a year, and the local salinity by 0.001–0.002. These downward heat and salt inputs are then advected in the various sub-basins. Summing the minimum and maximum transfer rates associated with each region leads to an upper and a lower estimate of the staircase heat and salt transfers over the whole western Mediterranean Sea. The transfer rates amounts to 46–103 GW (1GW = 1 × 10⁹ W) for heat, and 4.5–10.3 × 10³ kg s−1 for
salt over the whole western Mediterranean Sea (Table 3). The largest contributors are the Algerian and Sardino-Balearic seas and the Tyrrhenian sea for which staircases extend over large areas. On long timescales and at the scale of the whole western Mediterranean, such transfer rates are able to warm all waters from 1000 to 2000 m by 0.0007-0.0016◦
C per year and to increase their salinity by 0.0003-0.0007 per year (volume from 1000 to 2000 m: 4.8 × 10¹⁴m3).
As a consistency check, it is interesting to compare the averaged kinetic energy dissipation rate with the rate of potential energy release associated with double diffusion fluxes. In pure salt fingering, the release of potential energy by salt fingering is balanced by the dissipation rate of turbulent kinetic energy. The potential energy release rate or buoyancy flux, reads: Jb= –
g(αFT–βFS). Note that the relative errors on Jbinduced by errors
in dissipation rates are smaller than those on FT and FS since
errors on FTand FSare correlated. In all regions, the dissipation
rateε is almost equal to the buoyancy flux, which is expected since the salt fingering model is based on this equality.
More instructive is the regional estimate of the dissipation ratio. In all regions, except the Ligurian Sea, we observe an averaged0 of 0.56–0.64. In the Ligurian Sea, 0 strongly decreases toward 0.11, a value typical of mechanical turbulence. The Ligurian Sea has also the largest regionally averaged turbulent intensity Reb of 340 while other regions are between 75 and
150. Those observations confirm that Ligurian staircases occur in an environment marked by mechanical turbulence, though not sufficiently energetic enough to suppress staircase formation. Other regions are closer to pure salt-fingering environments.
Finally, this study provide us with one more piece of the puzzle for the fate of western Mediterranean sea deep waters. Following B14, we assume that most heat and salt convergences
from salt-fingering fluxes occur between 1000 and 2000 m. In this depth range, the mean geothermal flux of 110 mW m−2 over the western Mediterranean (Ferron et al., 2017)
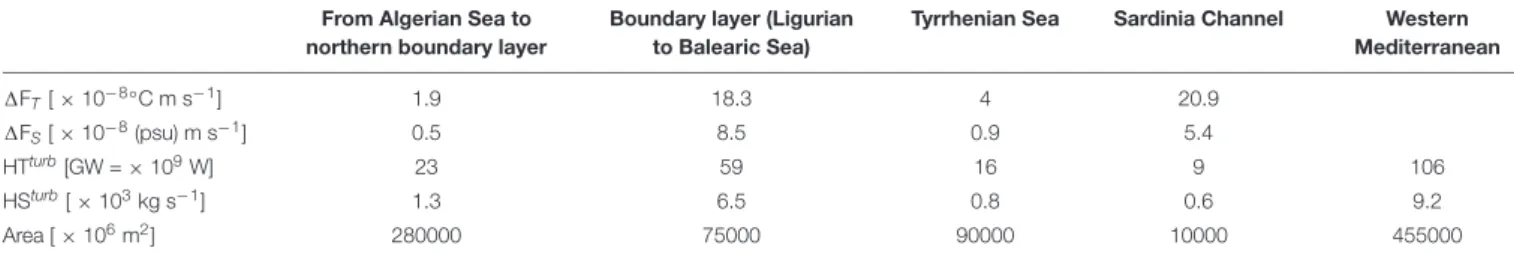
brings about 20 GW. Thus, salt fingering brings 3-6 times as much heat to bottom waters as the geothermal heat flux. The fluxes associated with mechanical turbulence need also to be considered. Ferron et al. (2017) found that the geothermal heat flux was three times as efficient to raise the buoyancy as the mechanical turbulence. Indeed, mechanical turbulence increases the buoyancy with its turbulent heat fluxes on the one hand, but decreases the buoyancy with the turbulent salt fluxes on the other hand. A compensation that does not hold for geothermal heating. Thus, the separate contributions of heat and salt content generated by mechanical turbulence over the whole western Mediterranean need to be quantified. For that purpose, the divergence of mechanical turbulent fluxes were computed over the whole western Mediterranean Sea between 1000 and 2000 m. Since mechanical turbulence occurs everywhere, four areas were delimited covering larger areas than those attributed to the staircase activity: the boundary layer that conveys waters from the Ligurian Sea to the Balearic Sea with the Liguro-Provençal current (Figure 1, green dashed line), the region from the Algerian Sea to the boundary layer (Figure 1, red dashed line), the Tyrrhenian Sea (Figure 1, purple dashed line), and the Sardinia Channel (blue dashed-dotted line). Areas are given in
Table 4. All dissipation profiles with and without staircase were considered for mechanical mixing. When staircases occurred at 1000 m or 2000 m, an arbitrary pds= 10% of the dissipation rate
was accounted for participating to mechanical turbulence, the remaining 1 – pds= 90% being ascribed to salt fingering process.
This was motivated by the observation that most staircases occur in environments close to pure-salt fingering, as noted previously. Over the whole western Mediterranean Sea, we find that mechanical turbulence produces a heat convergence of 106 GW and a salt convergence of 9.2 × 10³kg s−1between 1000
and 2000 m (Table 4). This result is not highly sensitive to the choice of pds. Increasing pdsto 30% instead of 10% would increase
the heat and salt convergence by 14% and 10%, respectively. The largest uncertainty comes from the area attributed to the boundary layer which was set, for consistency, to have the same enhanced turbulent mixing as the Ligurian Sea. The boundary layer accounts for 56% of the heat convergence and 71% of the salt convergence due to mechanical mixing, while it represents only 16% of the total western Mediterranean area. Increasing (resp. decreasing) the boundary layer area of enhanced mechanical mixing by 50% increases (resp. decreases) the heat convergence by 25% (range 80–133 GW) and salt convergence by 34% (range 6.2–12.3 × 10³ kg s−1) over the whole western Mediterranean
Sea. This gives a reasonable idea of the uncertainty in heat and salt convergences due to an over- or under-estimation of the area of enhanced mechanical mixing in the whole western basin.
To summarize, taking the estimated ranges, geothermal heating, salt-fingering and mechanical mixing generates a heat convergence between 146 and 256 GW and a salt convergence between 11 and 23 × 103kg s−1
. If, for a long period, there was no net injection of new deep waters, such convergences between 1000 and 2000 m would lead to an increase in temperature
TABLE 4 | Mechanical turbulence estimates of the difference in temperature flux1FT, and in the salt flux1FS, between 1000 and 2000 m.
From Algerian Sea to northern boundary layer
Boundary layer (Ligurian to Balearic Sea)
Tyrrhenian Sea Sardinia Channel Western Mediterranean 1FT[ × 10−8 ◦C m s−1] 1.9 18.3 4 20.9 1FS[ × 10−8(psu) m s−1] 0.5 8.5 0.9 5.4 HTturb[GW = × 109W] 23 59 16 9 106 HSturb[ × 103kg s−1] 1.3 6.5 0.8 0.6 9.2 Area [ × 106m2] 280000 75000 90000 10000 455000
Convergences of heat (HTturb) and salt (HSturb) between 1000 and 2000 m. The area ascribed to each region is given in this table and appears as a dotted-colored lines
on Figure 1.
of 0.002–0.004◦
C per year, and an increase in salt of 0.0007– 0.0016 per year over the whole western basin. For comparison, Marty and Chiavérini (2010)found that temperature increased by 0.005◦
C per year and salinity by 0.0022 psu per year at 2000 m from repeated CTD in the Ligurian Sea from 1995 to 2005. For the same dataset,Borghini et al. (2014)noted that, for the 1995–2005 decade where there is little evidence for deep water formation in the western Mediterranean, the 1800–2000 m-deep water salinity and temperature increased at a rate of 0.0013– 0.0041 per year and 0.0043–0.0057◦
C per year, respectively. Those numbers are relatively consistent with the heat and salt convergences we derived in this study in the absence of deep water formation, given the variability in the parameters (depth range of the estimates, period and representativity of estimates at the scale of the western basin).
In the last two decades, many episodes of deep convection were reported in the western basin, from which a yearly mean deep water formation rate of 0.3–0.9 Sv (1 Sv = 1 × 10⁶m3s−1)
was estimated (seeFerron et al., 2017, supporting information). This injection of deep water at depth forces an upwelling at the same mean rate over the basin. Noting that there is a mean 0.15 to 0.2◦
C (resp. 0.03–0.05) temperature (resp. salinity) difference between 1000 and 2000 m, a mean upwelling rate of 0.3–0.9 Sv induces a heat loss rate of 190–780 GW and a salt loss of 10 to 50 × 103 kg s−1 in this depth range.
Thus, the addition of mechanical turbulence, salt-fingering, and geothermal inputs can balance the heat and salt loss produced by a 0.3–0.4 Sv mean upwelling rate. In case the upwelling is closer to 0.9 Sv, only 33% of the 780 GW heat loss and nearly 50% of the salt loss could be balance if we take the maximum convergence rates produced by mechanical turbulence and salt-fingering. The remaining heat and salt losses would produce, over a year, a 0.008◦
C temperature decrease and a 0.002 salinity decrease. Some interannual decrease may be temporarily seen in observations between 1000 and 2000 m, but the major long trend is an increase in heat and salt content due to the increasingly saltier and warmer new deep waters (Schroeder et al., 2016). Another complexity comes from the amount of deep water (say from 1000 to 2000 m in the deep basins) that is able to flow out of the Mediterranean through the Strait of Gibraltar. The larger this amount, the lower the heat and salt loss due to the upwelling of deep waters, since less amount of water has to upwell in the western basin through the 1000 m depth.
CONCLUSION
The numbers we derived for the western Mediterranean are of course indicative. Given the intensity of salt fingering fluxes relative to fluxes induced by mechanical turbulence, this study is one more work that points toward the necessity of taking salt fingering fluxes into account in numerical modeling of the ocean. Numerical models rarely take double diffusion processes into account despite they can induce heat, salt (and other properties) fluxes larger than those induced by mechanical turbulence over the large areas of staircase activity. The western Mediterranean Sea is a typical place where those fluxes are of importance due to the presence of the warm and salty LIW. There, double-diffusion produces heat and salt convergence as important as those induced by the mechanical mixing. Many other places in the world ocean are also subject to salt fingering or double-diffusive convection. Radko et al. (2014) recently proposed a parameterization that allows for the development of staircases in low resolution models, an effort that clearly needs to be pursued.
This study supports the need to strengthen observational efforts in the Mediterranean Sea in the future in order to reduce the uncertainties and to better document and understand the rapid evolution of heat and salt contents in relation with the climatic change. Oceanographers need to have good estimates of deep water formation rates, but we also need to improve our understanding of how much of these rates really represent a net mass transfer (Waldman et al., 2018). Finally, it is also clear that diapycnal fluxes need to be better constrained with microstructure and finestructure observations, in particular along boundaries.
DATA AVAILABILITY STATEMENT
The raw data supporting the conclusions of this article will be made available by the authors, without undue reservation. Data requests may be sent to the corresponding author.
AUTHOR CONTRIBUTIONS
BF, PB-A, KS, HB, and MB contributed to the data acquisition during cruises. BF processed the microstructure and finestructure data, performed the analysis, drafted the manuscript, and designed the figures. KS and MB involved in planning and
supervised the funding of the cruises. BF, PB-A, and YC supervised the funding of microstructure equipment. All authors provided critical feedback and helped shape the research, analysis and contributed to the final manuscript.
FUNDING
The microstructure profilers were funded by the French Agence Nationale de la Recherche (ANR) through grant ANR-JC05_50690 and by the French Institute for Marine Science (IFREMER). This project was funded by CNR-ISMAR, LOCEAN, LOPS, and the INSU-MISTRALS (Mediterranean Integrated STudies at Regional and Local Scales) program. BF was supported by the French National Centre for Scientific Research (CNRS). This study contributes to the HyMeX
program (Hydrological cycle in the Mediterranean Experiment). Support was received from the European Commission – H2020 Framework Programme, JERICO NEXT through grant #654410. HB thanks the Royal Society and the Leverhulme Trust for supporting his involvement in this Mediterranean research.
ACKNOWLEDGMENTS
We thank all crew members of R/V Urania, Alberto Ribotti (CNR Oristano), and Stefania Sparnocchia (CNR ISMAR, Trieste) for their contribution to the organization of the ICHNUSSA and EMSO cruises, respectively. We also thank Stéphane Leizour for his useful technical assistance with VMPs all along the year and his implications in the cruise operations.
REFERENCES
Borghini, M., Bryden, H., Schroeder, K., Sparnocchia, S., and Vetrano, A. (2014). The Mediterranean is becoming saltier.Ocean Sci. 10, 693–700. doi: 10.5194/ os-10-693-2014
Bouffard, D., and Boegman, L. (2013). A diapycnal diffusivity model for stratified environmental flows.Dynam. Atmos. Oceans 61–62, 14–34.
Bryden, H., Schroeder, K., Sparnocchia, S., Borghini, M., and Vetrano, A. (2014). Thermohaline staircases in the western Mediterranean Sea.J. Mar. Res. 72, 1–18.
Buffett, G. G., Krahmann, G., Klaeschen, D., Schroeder, K., Sallarès, V., Papenberg, C., et al. (2017). Seismic oceanography in the Tyrrhenian Sea: thermohaline staircases, eddies, and internal waves.J. Geophys. Res. 122, 8503–8523. doi: 10.1002/2017JC012726
Durante, S., Schroeder, K., Mazzei, L., Pierini, S., Borghini, M., and Sparnocchia, S. (2019). Permanent thermohaline staircases in the Tyrrhenian Sea.Geophys. Res. Lett. 46, 1562–1570. doi: 10.1029/2018GL081747
Ferron, B., Bouruet Aubertot, P., Cuypers, Y., Schroeder, K., and Borghini, M. (2017). How important are diapycnal mixing and geothermal heating for the deep circulation of the Western Mediterranean?Geophys. Res. Lett. 44, 7845–7854. doi: 10.1002/2017GL074169
Ferron, B., Kokoszka, F., Mercier, H., and Lherminier, P. (2014). Dissipation rate estimates from microstructure and finescale internal wave observations along the A25 Greenland–Portugal OVIDE line.J. Atmos. Ocean. Technol. 31, 2530–2543. doi: 10.1175/JTECH-D-14-00036.1
Goodman, L., Levine, E. R., and Lueck, R. G. (2006). On measuring the terms of the turbulent kinetic energy budget from an AUV.J. Atmos. Oceanic Technol. 23, 977–990. doi: 10.1175/JTECH1889.1
Gregg, M. C. (1988). “Mixing in the thermohaline staircase east of Barbados,” in Small Scale Turbulence and Mixing in the Ocean, eds J. C. J. Nihoul and B. M. Jamart (Amsterdam: Elsevier), 453–470.
Gregg, M. C., and Sanford, T. B. (1987). Shear and turbulence in thermohaline staircase.Deep Sea Res. 34, 1689–1696.
Hamilton, J., Oakey, N. S., and Kelley, D. E. (1993). Salt-finger signatures in microstructure measurements.J. Geophys. Res. 98, 2453–2460.
Hamilton, J. M., Lewis, M. R., and Ruddick, B. R. (1989). Vertical fluxes of nitrate associated with salt fingers in the world’s oceans.J. Geophys. Res. 94, 2137–2145. Inoue, R., Yamazaki, H., Wolk, F., Kono, T., and Yoshida, J. (2007). An estimation of buoyancy flux for a mixture of turbulence and double diffusion.J. Phys. Oceanogr. 37, 611–625.
Johannessen, O. M., and Lee, O. S. (1974). A deep stepped thermo-haline structure in the Mediterranean.Deep Sea Res. A 21, 629–639. doi: 10.1016/0011-7471(74) 90047-3
Krahmann, G. (1997). “Horizontal variability of thermohaline staircases in the western mediterranean, double-diffusive processes, 1996 summer study program,” inGeophysical Fluid Dynamics, eds S. Meacham and D. Tucholke (Falmouth, MA: Woods Hole Oceanographic Institution), 331–347.
Marty, J. C., and Chiavérini, J. (2010). Hydrological changes in the Ligurian Sea (NW Mediterranean, DYFAMED site) during 1995–2007 and biogeochemical consequences.Biogeosci. Discuss. 7, 1377–1406.
Massey, F. J. (1951). The kolmogorov-smirnov test for goodness of fit.J. Am. Stat. Assoc. 46, 68–78. doi: 10.2307/2280095
McDougall, T. J., and Taylor, J. R. (1984). Flux measurements across a finger interface at low values of the stability ratio.J. Mar. Res. 42, 1–14.
Molcard, R., and Tait, R. I. (1977). “The steady state of the step structure in the Tyrrhenian Sea,” inA Voyage of Discovery, ed. M. V. Angel (Amsterdam: Pergamon Press), 221–233.
Oakey, N. S. (1985). Statistics of mixing parameters in the upper ocean during JASIN phase 2.J. Phys. Oceanogr. 15, 1662–1675.
Osborn, T. R. (1980). Estimates of the local rate of vertical diffusion from dissipation measurements.J. Phys. Oceanogr. 10, 83–89. doi: 10.1175/1520-0485(1980)010<0083:EOTLRO>2.0.CO;2
Osborn, T. R., and Cox, C. S. (1972). Oceanic fine structure.Geophys. Fluid Dyn. 3, 321–345.
Press, W. H., Teukolshy, S. A., Vetterling, W. T., and Flannery, B. P. (1992). Numerical Recipes in FORTRAN: The Art of Scientific Computing. Cambridge, MA: Cambridge University Press, 963.
Radko, T. (2013). Double-Diffusive Convection. Cambridge, MA: Cambridge University Press, 344.
Radko, T. (2005). What determines the thickness of layers in a thermohaline staircase?J. Fluid Mech. 523, 79–98. doi: 10.1017/S0022112004002290 Radko, T., Bulters, A., Flanagan, J., and Campin, J. (2014). Double-diffusive recipes.
Part 1: large-scale dynamics of thermohaline staircases.J. Phys. Oceanogr. 44, 1269–1284. doi: 10.1175/JPO-D-13-0155.1
Radko, T., and Smith, D. P. (2012). Equilibrium transport in double-diffusive convection.J. Fluid Mech. 692, 5–27. doi: 10.1017/jfm.2011.343
Schmitt, R. W., Ledwell, J. R., Montgomery, E. T., Polzin, K. L., and Toole, J. M. (2005). Enhanced diapycnal mixing by salt fingers in the thermocline of the tropical Atlantic. Science 308, 685–688. doi: 10.1126/science.110 8678
Schmitt, R. W., Perkins, H., Boyd, J. D., and Stalcup, C. (1987). An investigation of the thermohaline staircase in the western tropical North Atlantic.Deep Sea Res. 34, 1655–1665.
Schroeder, K., Chiggiato, J., Bryden, H. L., Borghini, M., and Ismail, S. B. (2016). Abrupt climate shift in the Western Mediterranean Sea.Nat. Sci. Rep. 6:23009. doi: 10.1038/srep23009
Sommer, T., Carpenter, J. R., Schmid, M., Lueck, R. G., and Wüest, A. (2013). Revisiting microstructure sensor responses with implications for double-diffusive fluxes.J. Atmos. Ocean. Technol. 30, 1907–1923. doi: 10.1175/JTECH-D-12-00272.1
St. Laurent, L., and Schmitt, R. W. (1999). The contribution of salt fingers to vertical mixing in the North Atlantic tracer release experiment.J. Phys. Oceanogr. 29, 1404–1424. doi: 10.1175/1520-04851999029