HAL Id: hal-02389344
https://hal-cnrs.archives-ouvertes.fr/hal-02389344
Submitted on 2 Dec 2019
HAL is a multi-disciplinary open access
archive for the deposit and dissemination of
sci-entific research documents, whether they are
pub-lished or not. The documents may come from
teaching and research institutions in France or
abroad, or from public or private research centers.
L’archive ouverte pluridisciplinaire HAL, est
destinée au dépôt et à la diffusion de documents
scientifiques de niveau recherche, publiés ou non,
émanant des établissements d’enseignement et de
recherche français ou étrangers, des laboratoires
publics ou privés.
cycle arrest and translation inhibition: Involvement in
vitamin C-induced breast cancer cell death
Nadine El Banna, Elie Hatem, Amélie Heneman-Masurel, Thibaut Léger,
Dorothée Baïlle, Laurence Vernis, Camille Garcia, Sylvain Martineau, Corinne
Dupuy, Stéphan Vagner, et al.
To cite this version:
Nadine El Banna, Elie Hatem, Amélie Heneman-Masurel, Thibaut Léger, Dorothée Baïlle, et al..
Redox modifications of cysteine-containing proteins, cell cycle arrest and translation inhibition:
In-volvement in vitamin C-induced breast cancer cell death. Redox Biology, Elsevier, 2019, 26, pp.101290.
�10.1016/j.redox.2019.101290�. �hal-02389344�
Contents lists available atScienceDirect
Redox Biology
journal homepage:www.elsevier.com/locate/redox
Research Paper
Redox modifications of cysteine-containing proteins, cell cycle arrest and
translation inhibition: Involvement in vitamin C-induced breast cancer cell
death
Nadine El Banna
a, Elie Hatem
a, Amélie Heneman-Masurel
a, Thibaut Léger
b, Dorothée Baïlle
a,
Laurence Vernis
a, Camille Garcia
b, Sylvain Martineau
a, Corinne Dupuy
c, Stéphan Vagner
a,
Jean-Michel Camadro
b, Meng-Er Huang
a,*aInstitut Curie, PSL Research University, CNRS UMR 3348, Université Paris-Sud, Université Paris-Saclay, Orsay, France bInstitut Jacques Monod, CNRS UMR 7592, Mass Spectrometry Laboratory, Université Paris Diderot, Paris, France cInstitut Gustave Roussy, CNRS UMR 8200, Université Paris-Sud, Villejuif, France
A R T I C L E I N F O Keywords: Vitamin C Ascorbic acid Dehydroascorbic acid Breast cancer Oxidative stress Redoxome A B S T R A C T
Vitamin C (VitC) possesses pro-oxidant properties at high pharmacologic concentrations which favor re-purposing VitC as an anti-cancer therapeutic agent. However, redox-based anticancer properties of VitC are yet partially understood. We examined the difference between the reduced and oxidized forms of VitC, ascorbic acid (AA) and dehydroascorbic acid (DHA), in terms of cytotoxicity and redox mechanisms toward breast cancer cells. Our data showed that AA displayed higher cytotoxicity towards triple-negative breast cancer (TNBC) cell lines in
vitro than DHA. AA exhibited a similar cytotoxicity on non-TNBC cells, while only a minor detrimental effect on
noncancerous cells. Using MDA-MB-231, a representative TNBC cell line, we observed that AA- and DHA-in-duced cytotoxicity were linked to cellular redox-state alterations. Hydrogen peroxide (H2O2) accumulation in the
extracellular medium and in different intracellular compartments, and to a lesser degree, intracellular glu-tathione oxidation, played a key role in AA-induced cytotoxicity. In contrast, DHA affected gluglu-tathione oxidation and had less cytotoxicity. A “redoxome” approach revealed that AA treatment altered the redox state of key antioxidants and a number of cysteine-containing proteins including many nucleic acid binding proteins and proteins involved in RNA and DNA metabolisms and in energetic processes. We showed that cell cycle arrest and translation inhibition were associated with AA-induced cytotoxicity. Finally, bioinformatics analysis and bio-logical experiments identified that peroxiredoxin 1 (PRDX1) expression levels correlated with AA differential cytotoxicity in breast cancer cells, suggesting a potential predictive value of PRDX1. This study provides insight into the redox-based mechanisms of VitC anticancer activity, indicating that pharmacologic doses of VitC and VitC-based rational drug combinations could be novel therapeutic opportunities for triple-negative breast cancer.
1. Introduction
Reactive oxygen species (ROS) homeostasis and intracellular re-ductive/oxidative (redox) dynamics play a key role in regulating cell viability or death. Mounting evidence has established that defects in redox signaling and oxidative stress are at the crux of various patho-logical processes. Notably, one of the significant features of cancer cells, when compared to their normal counterparts, is a persistent pro-oxi-dative state. In cancer cells, cellular events such as activation of on-cogenes, aberrant metabolic stress and mitochondrial dysfunction can
increase ROS levels, leading to intrinsic oxidative stress [1,2]. There-fore, the administration of a ROS-generating agent or antioxidant in-hibitor could increase ROS levels to a threshold that is incompatible with viability, selectively and preferentially affecting cancer cells [1–3].
Vitamin C (VitC) is an essential nutrient used as a co-factor by nu-merous biosynthetic enzymes. It exists in the parental reduced form or ascorbic acid (AA, or AscH2) and the oxidized forms, encompassing the
ascorbate radical (Asc•–) and the dehydroascorbic acid (DHA). At
phy-siological pH (7.0), the dominant species for VitC is ascorbate
https://doi.org/10.1016/j.redox.2019.101290
Received 27 June 2019; Received in revised form 28 July 2019; Accepted 31 July 2019
*Corresponding author. CNRS UMR3348, Institut Curie, Bâtiment 110, Centre Universitaire, 91405, Orsay, France.
E-mail address:meng-er.huang@curie.fr(M.-E. Huang).
Available online 02 August 2019
2213-2317/ © 2019 The Authors. Published by Elsevier B.V. This is an open access article under the CC BY-NC-ND license (http://creativecommons.org/licenses/BY-NC-ND/4.0/).
monoanion (AscH−, 99.9%), with low concentrations of AscH 2(0.1%)
and ascorbate dianion (Asc2−, 0.005%) [4]. The ability to donate one
or two electrons makes ascorbate (AscH−) an excellent reducing agent
and antioxidant. At millimolar levels (pharmacologic concentrations), AA becomes a ROS-generating molecule. In fact, a small portion of AA, via the ascorbate dianion (Asc2−), can undergo limited pH-dependent
auto-oxidation that can lead to superoxide anion (O2•–) formation
ac-cording to the following reaction: Asc2−+ O
2→ Asc•–+ O2•–[4,5].
Superoxide anions subsequently dismute to produce H2O2
(O2•–+ O2•–+ 2H+→ H2O2+ O2). Importantly, in the presence of
redox active metal ions, AA oxidation is further accelerated and am-plified as ascorbate (AscH−) can exert an additional pro-oxidant effect.
AscH−donates one electron to metals, that can reduce ferric (Fe3+) to
ferrous (Fe2+) iron for example, while being oxidized to ascorbate
ra-dical (AscH–+ Fe3+→ Asc•–+ Fe2++ H+). Fe2+can readily react
with O2, reducing it to superoxide anion (O2+ Fe2+→ O2•–+ Fe3+),
which in turn dismutes to H2O2and O2[4,5]. These mechanisms act to
produce a high flux of H2O2at pharmacologic concentrations of AA. In
a classic Fenton reaction, Fe2+reacts with H
2O2to generate Fe3+and
the highly reactive hydroxyl radical.
H2O2generated in the extracellular medium or extracellular fluids
appears to be the central player for pro-oxidant properties of AA at pharmacologic concentrations, achievable in cell culture experiments, and in vivo by intravenous administration. Extracellular H2O2readily
diffuses into cells; if not removed, it can lead to oxidative damage to proteins, lipids, and DNA. On the other hand, it is expected that AA, upon import through plasma membranes via sodium-dependent VitC transporters (SVCTs), can generate intracellular H2O2directly by the
same metals-catalyzed reactions described above. In accordance, AA cytotoxicity was observed in a number of studies in vitro and in vivo models on cancer cells from different origins without adversely af-fecting normal cells [6–8]. Such cytotoxicity was also dependent on redox metal supply such as iron [9]. VitC anticancer effects driven by its DHA form were also reported [10]. Yun et al. observed that VitC was oxidized to DHA in cell culture media lacking reducing agents, and was subsequently imported into human colon cancer cells harboring onco-genic KRAS or BRAF mutations by overexpressed GLUT1 glucose transporter. Following import, DHA is reduced to AA at the expense of glutathione (GSH) and NADPH. Increased DHA uptake leads to GSH oxidation, thus indirectly promoting endogenous ROS accumulation and specific inactivation of glyceraldehyde 3-phosphate dehydrogenase (GAPDH), and consequently, impairing glycolysis and inducing cancer cell death [10].
Several studies addressed the question regarding VitC selective cy-totoxicity toward cancer cell lines. Differential ability to metabolize H2O2between normal and pancreatic cancer cells were shown to be
determinant in AA effect on pancreatic cancer cells while sparing normal ones in vitro and in vivo [11]. In addition, a positive correlation between the sodium-dependent VitC transporter 2 (SVCT2) expression and AA cytotoxicity were reported in breast cancer cells, cholangio-carcinoma cell lines and patient-derived xenografts [12–14]. Interest-ingly, a recent study showed that non-small-cell lung cancer and
glioblastoma cells are selectively sensitive to AA due to their altered redox-active iron metabolism, resulted from altered mitochondrial oxidative metabolism and increased levels of O2•–and H2O2[15]. The
same team found similar benefits of pharmacological ascorbate in preclinical models of fibrosarcoma and liposarcoma [16]. Finally, dif-ferent energy metabolisms between cancer and normal cells, known as the Warburg effect where cancer cells strongly depend on glycolysis for their energy and ATP production, render cancer cells far more vulner-able to glycolysis impairment by VitC than their normal counterparts [10,17,18].
Pharmacologic dose of AA enhanced chemosensitivity of ovarian cancer to carboplatin and paclitaxel and reduced toxicity of che-motherapy in mouse models [19]. AA also enhanced sensitivity to io-nizing radiation by increasing H2O2-mediated DNA damage in
pan-creatic cancer model [20,21], and in prostate cancer cells while sparing normal cells from radiotoxicity [22]. Clinical studies revealed that pharmacologic doses of AA were well tolerated and increased the effi-cacy of conventional radio-chemotherapy in non-small-cell lung cancer and glioblastoma patients [15], and in pancreatic cancer patients [23]. These recent studies reflect a regained interest in VitC anticancer activity. However, VitC redox-based anticancer mechanisms warrant further investigation. Notably, which form of VitC exhibits the higher anticancer activity? Is this effect cell-type dependent? What are the factors that condition cellular sensitivity to VitC? What are the key intermediates (H2O2or GSH oxidation) that lead to cell death? And
which proteins or pathways are key targets of VitC-mediated oxidation? In this study we provide answers to these questions using breast cancer model.
2. Materials and methods 2.1. Cell culture
Triple-negative breast cancer (TNBC) cell lines MDA-MB-231 and HTB-26, human umbilical vein endothelial cells (HUVEC) and human dermal fibroblasts (PCS-201-012) were purchased from American Type Culture Collection. Human mammary epithelial cells (HMEC) were purchased from Lonza. Additional breast cancer cell lines were obtained from the Translational Research Department of the Institut Curie (Paris, France). MDA-MB-231, MDA-MB-468, MDA-MB-436, BT-549, HCC-1937, BT-20, MDA-MB-453, MDA-MB-134, MDA-MB-415, HUVEC and fibroblasts cells were grown in DMEM (Eurobio) supplemented with 10% FBS, 2 mML-glutamine, 1X non-essential amino acids, 1 mM so-dium pyruvate and 100 U/ml penicillin and 100 μg/ml streptomycin. HCC-1187, HCC-1954, T47D, HCC-1428 were grown in RPMI medium supplemented with 10% FBS, 2 mML-glutamine 100 U/ml penicillin and 100 μg/ml streptomycin. HMEC were grown in mammary epithelial basal medium (MEBM) supplemented with MEGM SingleQuots (Lonza) (containing bovine pituitary extract, hydrocortisone, hEGF, insulin and gentamicin/amphotericin-B), 10% FBS and 100 U/ml penicillin and 100 μg/ml streptomycin. Cells are incubated in humidified atmosphere at 37 °C with 5% CO2in air and were routinely checked for the absence
Abbreviations
AA ascorbic acid
BrdU 5-bromo-2′-deoxy-uridine
DAVID Database for Annotation, Visualization and Integrated Discovery
DHA dehydroascorbic acid DTT dithiothreitol GLUT1 glucose transporter 1 GO Gene ontology
IPA Ingenuity Pathways Analysis software
LC-MS/MS liquid-chromatography tandem mass spectrometry MTT 3-(4,5-dimethylthiazol-2-yl)-2,5-diphenyltetrazolium
bro-mide
NAC N-acetyl-L-cysteine NEM N-ethylmaleimide PI propidium iodide
SVCT sodium-dependent vitamin C transporter TCA trichloroacetic acid
TNBC triple-negative breast cancer VitC vitamin C
of mycoplasma. Cell lines were authenticated using standard DNA mi-crosatellite short tandem repeat (STR) method.
2.2. Drugs and reagents
L-ascorbic acid (AA),L-dehydroascorbic acid (DHA), N-ethylmalei-mide (NEM), crystal violet, N-acetyl-L-cysteine (NAC), glutathione, DMSO, dithiothreitol (DTT), hydrogen peroxide (H2O2), catalase,
dia-mide, trichloroacetic acid (TCA) and cycloheximide were purchased from Sigma-Aldrich. 3-(4,5-dimethylthiazol-2-yl)-2,5-diphenylte-trazolium bromide (MTT), 6-carboxy-2′,7′-dichlorodihydrofluorescein diacetate (carboxy-H2DCFDA), 5-bromo-2′-deoxy-uridine (BrdU) and
propidium iodide (PI) were from Thermo Fisher Scientific. The fol-lowing antibodies were used: anti-PRDX3 (Abcam), anti-GFP (Life Technologies), anti-β-actin (Sigma-Aldrich), anti-PRDX1 (Cell Signaling Technology), FITC Mouse anti-BrdU (BD Biosciences).
2.3. ROS assessment, H2O2detection and H2O2quantification
General ROS were assessed using carboxy-H2DCFDA staining and a
FACSCalibur flow cytometer (Becton Dickinson) and data were ana-lyzed using Flowjo software. For compartment-specific H2O2detection,
mammalian expression vectors encoding HyPer targeted to nucleus (with a nuclear localization signal), and mitochondria (with a mi-tochondrial matrix localization signal) were purchased from Evrogen. HyPer targeted to the cytosol with a nuclear export signal and HyPer targeted to the membrane using the membrane-targeting signal in protein GAP-4 were constructed in our laboratory. Cells were trans-fected with HyPer expressing vectors using jetPRIME reagents (Polyplus Transfection). Further experiments were performed 24 h after trans-fection. Analyses of oxidized and reduced forms of sensor by redox Western blot were performed according to Ref. [24]. H2O2
concentra-tion in the medium was quantified using the Amplex Red Hydrogen Peroxide/Peroxidase Assay Kit (Thermo Fisher Scientific). The fluor-escence was measured in a microplate reader (Victor3; PerkinElmer). H2O2concentration in the growth medium (μM) was quantified using
H2O2standard calibration curves.
2.4. Quantitative redoxome analysis
Cells were subjected to different treatments and proteins were ex-tracted. Purification of these proteins was performed according to a published protocol with slight modifications [25]. Protein digests were analyzed in triplicate with an Orbitrap Fusion Tribrid equipped with an EASY-Spray ion source. Label-free liquid-chromatography tandem mass spectrometry (LC-MS/MS) acquisition was performed. Peptides from MS/MS data were processed with Proteome Discoverer Software (v 2.1) using Sequest search node. All results were 1% FDR filtered before exporting. The resulting files were imported into Progenesis-Qi soft-ware for report edition. Variations of protein abundance were con-sidered as significant if their Anova P values were < 0.05. Details of the protocol and analysis are described in Supplementary Materials and Methods and Supplementary Fig. 1. The proteomics data have been deposited to the ProteomeXchange Consortium via the PRIDE [26] partner repository with the dataset identifier PXD013833.
Ingenuity Pathways Analysis software (IPA, QIAGEN) was used to classify genes onto canonical pathways, cellular and molecular func-tions and networks. Pathways enriched with a P < 0.05 were con-sidered to be statistically significant. More details on IPA are found online (http://www.ingenuity.com). Database for Annotation, Visualization and Integrated Discovery (DAVID) software (https:// david.ncifcrf.gov, Version 6.8) was used to determine and represent functional protein classes and biological processes enriched from Gene ontology (GO) database. Functional annotations with P < 0.05 (EASE score) (modified Fisher's exact test) were selected.
2.5. BrdU incorporation and cell cycle analysis
BrdU incorporation and DNA staining with PI were performed using the acid denaturation method as described previously [27]. All samples were analyzed by a FACSCanto flow cytometer (Becton Dickinson) and data were analyzed using Flowjo software.
2.6. Translation studies
After different treatments, cells were incubated in growth media containing 100 μg/cycloheximide for 15 min at 37 °C in order to stop ribosomal elongation. After being washed with ice-cold 1X PBS sup-plemented with 100 μg/ml cycloheximide, cells were scraped and har-vested into ice-cold 1X PBS supplemented with 100 μg/ml cyclohex-imide and pelleted by centrifugation (3000 rpm for 5 min at 4 °C). The pellets were resuspended in 400 μl of LSB buffer (20 mM Tris-HCl pH 7.5, 100 mM NaCl, 3 mM MgCl2, 1 mM DTT, 100 μg/ml of
cyclohex-imide, and 100 U/ml of RNAsin) and lysed by adding 400 μl of LSB buffer containing 2.4% Triton X-100 and 0.5 M sucrose. The lysates were centrifuged (12000 g for 5 min at 4 °C), and the supernatants were recovered and adjusted with additional 50 μl of LSB buffer containing NaCl and MgCl2 with quantities that enable final concentrations of
50 mM NaCl and 7 mM MgCl2. Then, supernatants were layered onto
15–50% sucrose gradients in LSB buffer, centrifuged (38,000 rpm for 2 h at 4 °C) and 18 fractions were collected with a fraction collector. For nonpolysomal RNA (fractions 1 to 8, containing ribosomal RNAs present in 40S, 60S, and 80S ribosomal complexes, and free mRNAs) and polysomal RNA (fractions 9 to 18, containing mRNAs bound to more than one ribosome), the optical density of these fractions (OD 254 nm) were determined.
2.7. Transcriptomic data analysis
Genes expression data were extracted from two publicly accessible transcriptomic datasets: NCI-60 CellMiner Database (https://discover. nci.nih.gov/cellminer/Database Version: 2.1) and affymetrix normal-ized data for breast cancer cell lines of the Institut Curie collection (http://microarrays.curie.fr/publications/recherche_translationnelle/ plateforme_genomique/). Using NCI-60 CellMiner Database, each gene transcript Z-score (input HUGO name) and gene name were used as input identifier. The data file retrieved contained the average log2
in-tensity and Z-score of each gene expression in 60 cell lines. Using the Institut Curie database, gene mRNA expression levels (log2) for 29
breast cancer cell lines were retrieved.
2.8. Miscellaneous methods
MTT-based cell viability assay was performed as previously de-scribed [28]. For colony formation assays, cells were plated in 6-well plates in a density of 1000/well and treated under defined conditions and then further cultured for 14 days. Afterwards, colonies were fixed by ethanol, stained with crystal violet solution and counted using Im-ageJ software. For siRNA transfection, cells were transfected with 20 nM siRNA (ON-TARGET plus SMART pool siRNA or control siRNA, Dharmacon) using INTERFERin reagents (Polyplus Transfection). Fur-ther experiments were performed 48 h after transfection. Classical western blots and redox western blots were performed as described previously [24]. Total cellular glutathione levels (GSH + GSSG), GSSG (oxidized form) and GSH/GSSG ratios were assessed using GSH/GSSG-Glo™ Assay (Promega). Luminescence was read using TriStar2LB 942
Modular Monochromator Multimode Reader (Berthold technologies). Data were presented by GSH/GSSG ratios.
2.9. Statistical analysis
statistical tests available in the GraphPad Prism 7 software and speci-fied in the body of manuscript and figure legends. Data were presented as the mean ± standard deviation (SD). Dose-response modeling, half-maximal inhibitory concentration (IC50) determination from MTT cell viability assays and Spearman's correlation analyses were also per-formed using the GraphPad Prism 7 software (GraphPad Software, Inc). Wherever possible, exact P values are given and P < 0.05 were con-sidered statistically significant.
3. Results
3.1. AA shows higher cytotoxicity toward breast cancer cells than DHA without affecting noncancerous cells
A panel of 7 TNBC cell lines was exposed to increasing concentra-tions of AA and DHA. MTT assays showed that TNBC cells displayed different sensitivity to AA treatment for 24 h (Fig. 1A). At pharmaco-logic concentrations, MDA-MB-231 cells, among others (HCC-1187, BT549, MDA-MB-468, HCC-1937 and BT20), were highly sensitive to AA ranging from 7 mM to 10 mM (4–20% viability at 10 mM AA); while MDA-MB-436 showed more resistance (~70% viability at 10 mM AA). Less cytotoxicity was observed with DHA for all TNBC cells in the same treatment conditions. Only 3 cell lines (HCC-1187, BT20 and MDA-MB-231) were sensitive to 10 mM DHA treatment for 24 h (7–40% viability) (Fig. 1B). Upon AA and DHA treatments for 24 h, MTT assays and clonogenic assay confirmed that VitC-induced cytotoxicity was asso-ciated with a loss of the ability to form colonies and that AA displayed stronger cytotoxicity than DHA (Fig. 1C). In addition, we determined the sensitivity of 6 non-TNBC cell lines to AA-treatment for 24 h (Fig. 1D). Five of them (MDA-MB-134, T47D, HCC-1428, MDA-MB-415 and MDA-MB-453) were sensitive to 10 mM AA treatment (5–35% viability) while HCC-1954 showed more resistance (~80% viability). Finally, noncancerous cell lines including HMEC, human dermal fi-broblasts and HUVEC showed a high survival rate even at 10 mM AA treatment (60–80%) (Fig. 1E).
3.2. H2O2generation and GSH oxidation underlie AA-induced cytotoxicity
while GSH oxidation plays a partial role in DHA-induced lower cytotoxicity
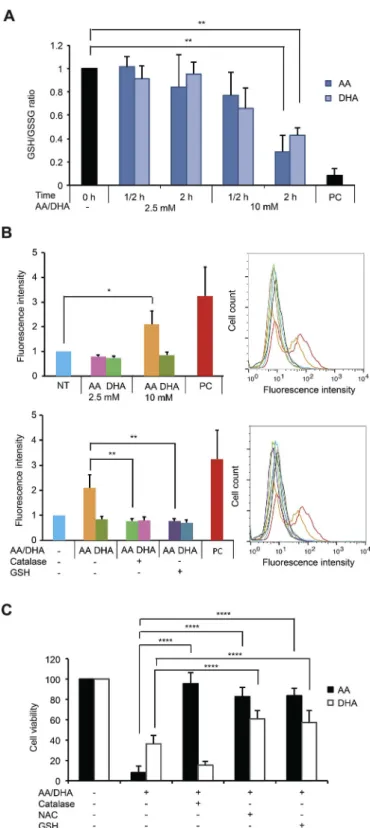
In order to understand the mechanism of action of AA and DHA, we used MDA-MB-231 cells, one representative TNBC cell line that is commonly studied in literature, to evaluate the redox alteration in-duced by VitC treatments. For this purpose, two concentrations of VitC were further used, the non-cytotoxic 2.5 mM and the cytotoxic 10 mM. Since DHA was shown to be responsible for GSH oxidation upon in-creased uptake through the glucose transporter GLUT1 in colorectal cancer model [10], we first determined the reduced and oxidized levels of this main cellular antioxidant after AA and DHA treatments in MDA-MB-231 cells. As shown inFig. 2A, a significant decrease in GSH/GSSG ratios, indicating GSH oxidation, is observed after 2-h treatment with 10 mM AA or DHA but not with 2.5 mM. Next, we performed a general ROS assessment using carboxy-H2DCFDA. A 2-fold increase in
fluores-cence intensity was detected upon treatment for 4 h with 10 mM but not with 2.5 mM AA (Fig. 2B). Co-treatment with 10 mM AA and either catalase or GSH abolished the increase in the fluorescence intensity
Fig. 1. Sensitivity of TNBC, non-TNBC and noncancerous cells toward AA and DHA. (A-B) Seven TNBC cell lines were treated with AA (A) or DHA (B) ranging from 0 to 10 mM for 24 h. Cell viability (%) relative to non-treated condition was measured with MTT assay for each cell line. Data are means ± SD of at least 6 independent experiments. Statistical significance is assessed by two-way ANOVA with Sidak's multiple comparisons test. (C) MDA-MB-231 cells were treated with AA or DHA for 24 h. Cell viability (%) relative to non-treated condition was measured by MTT assay (left panel). Data are means ± SD of at least 6 independent experiments. Representative images of colonies formation of MDA-MB-231 cells after AA or DHA treatments for 24 h are shown (right panel). (D) Six non-TNBC cells were treated with AA ranging from 0 to 10 mM for 24 h. Cell viability (%) relative to non-treated condition was measured with MTT assay. Data are means ± SD of at least 6 independent experiments. Statistical significance is assessed by two-way ANOVA with Sidak's multiple comparisons test. (E) HMEC, normal human dermal fibroblasts and HUVEC were treated with AA ranging from 0 to 10 mM for 24 h. Cell viability (%) relative to non-treated condition was measured with MTT assay for each cell line. Data are means ± SD of 4 independent experiments. Statistical significance is assessed by ordinary two-way ANOVA with Tukey's multiple com-parisons test. ****, P < 0.0001.
observed. In contrast, 10 mM DHA did not result in change in fluores-cence intensity that was not affected either by the presence of catalase or GSH (Fig. 2B). This indicates that cytotoxic dose of AA treatment, but not DHA, induces general intracellular ROS accumulation.
We then questioned the link between these redox alterations and VitC cytotoxicity. Noticeably, AA-induced cytotoxicity in MDA-MB-231 cells could be totally or largely suppressed by the presence of either catalase, NAC or GSH (Fig. 2C). NAC serves as a prodrug toL-cysteine which is a precursor to GSH. On the other hand, DHA-induced cell death was not rescued by catalase, while partially by GSH or NAC, with mean cell viability 58% and 61% respectively. These observations in-dicate the role of H2O2generation and GSH oxidation in AA cytotoxicity
and a partial implication of GSH oxidation in DHA cytotoxicity. To further verify the generation of H2O2in AA-treated condition, we
used Amplex-Red Kit to measure H2O2concentration in the medium.
After 10 mM AA treatment for 5 min, ½ hour and 2 h, H2O2
con-centrations in the medium with or without MDA-MB-231 cells increased more than 20 times (Fig. 3A). Furthermore, the co-treatment by AA and catalase abolished H2O2 accumulation, validating the extracellular
generation of H2O2by AA. Next, we used genetically encoded HyPer
sensors addressed to several cellular compartments in MDA-MB-231cells to determine whether H2O2accumulated intracellularly in one
or more cellular compartments. HyPer sensors specifically react with H2O2 [29,30]. Cytoplasm-localized HyPer oxidation was visible in
presence of 10 mM AA for 5 min, ½ hour and 2 h, indicating a con-tinuous H2O2 accumulation in the cytoplasm of the cells upon AA
treatment (Fig. 3B). The same results were obtained with nucleus-, mitochondrial matrix- and membrane-targeted HyPer. Furthermore, co-treatment with AA and catalase abolished the oxidation of HyPer. Fi-nally, the redox states of two compartment-specific antioxidant pro-teins, cytoplasmic PRDX1 and mitochondrial PRDX3, were analyzed by redox Western blot. Cytotoxic dose of AA (10 mM) increased PRDX3 oxidation (50–60% dimer) and PRDX1 oxidation (~10% dimer) after 5 min, ½ hour and 2 h of treatment, indicating mitochondrial and cy-tosolic H2O2accumulation (Fig. 3C). These data are in agreement with
an important role of H2O2in AA-induced cytotoxicity.
3.3. AA treatment alters the redox state of cysteine-containing proteins
Our observations described above linked AA cytotoxicity to extra-cellular and intraextra-cellular H2O2 accumulation and showed the redox
state alteration of some cysteine-containing antioxidants upon AA treatment. As many proteins with highly reactive cysteine residues are implicated in different critical pathways and could be impacted by
H2O2, we decided to examine the alterations of the redoxome, the
oxidized proteome of cysteine-containing proteins, by redox mass spectrometry approach [31,32]. Using a biotin switch approach that allows the enrichment of proteins containing oxidized thiols [25], we compared the redoxome of non-treated and treated (10 mM AA, ½ hour) MDA-MB-231 cells in two independent biological replicates, each with three technical replicates (SupplementaryFig. 1). Upon short AA treatment, we expected to identify early events in cellular response to AA that might be linked to AA-induced cell death.
Quantitative proteomic analysis by LC-MS/MS allowed the identi-fication of 2910 cysteine-containing proteins. Among them, 203 pro-teins (6.97%) were commonly identified in both biological experiments and exhibited a significant change in cysteine oxidation levels between non-treated and treated cells (over 1.5-fold in at least one of the two biological experiments with P < 0.05) (Supplementary Table 1). 38.42% of these proteins were more oxidized while 61.58% were more reduced in 10 mM AA-treated cells compared to the non-treated con-dition. The high proportion of more reduced proteins following AA treatment is intriguing but could be explained by the fact that in-tracellularly AA could not only generate H2O2but also act as a
con-ventional reducing agent, generating both oxidized and reduced pro-teins upon AA treatment. Compartment-specific redox response could also be taken into account. Proteins in some compartments could be more oxidized while those in other compartments could be more re-duced through antioxidant system response against the AA-inre-duced H2O2 and oxidative stress, thus protecting some important cellular
signaling pathways and proteins from oxidation.
As expected, antioxidant enzymes including glutathione S-trans-ferase Mu 3 (GSTM3), γ-glutamylcyclotransS-trans-ferase (GGCT) and PRDX1 were among the identified oxidized targets of AA treatment (SupplementaryTable 1), compromising antioxidant capacity. On the other hand, proteins belonging to the glycolysis and gluconeogenesis pathway (PYGM, PGK1), and tricarboxylic acid cycle (ACOT7, DLAT, FADS2), exhibited also a significant increase in oxidation upon AA treatment. Thus, energetic metabolism enzymes were also among the targets of AA, in accordance with the energetic crisis and metabolic alterations described in other studies [33]. Interestingly, several pro-teins implicated in DNA and RNA metabolism as well as in protein metabolism were oxidized in treated cells, including chromosome-as-sociated kinesin KIF4A (accession number O95239), histone-binding protein RBBP4 (Q09028), ATP-dependent RNA helicase DHX8 (Q14562), U5 small nuclear ribonucleoprotein 40-kDa protein (Q96DI7), tRNA-splicing ligase RtcB homolog (Q9Y3I0), 26S protea-some non-ATPase regulatory subunit 3 (O43242), Cullin-4A (Q13619), E3 ubiquitin-protein ligase RING2 (Q99496), E3 ubiquitin-protein li-gase UBR4 (Q5T4S7), E3 ubiquitin-protein lili-gase XIAP (P98170), and E3 SUMO-protein ligase RanBP2 (P49792) (SupplementaryTable 1). These data indicate that AA leads to the oxidation of thiol-containing proteins implicated in several essential cellular processes such as energy production, nucleic acid and protein metabolisms.
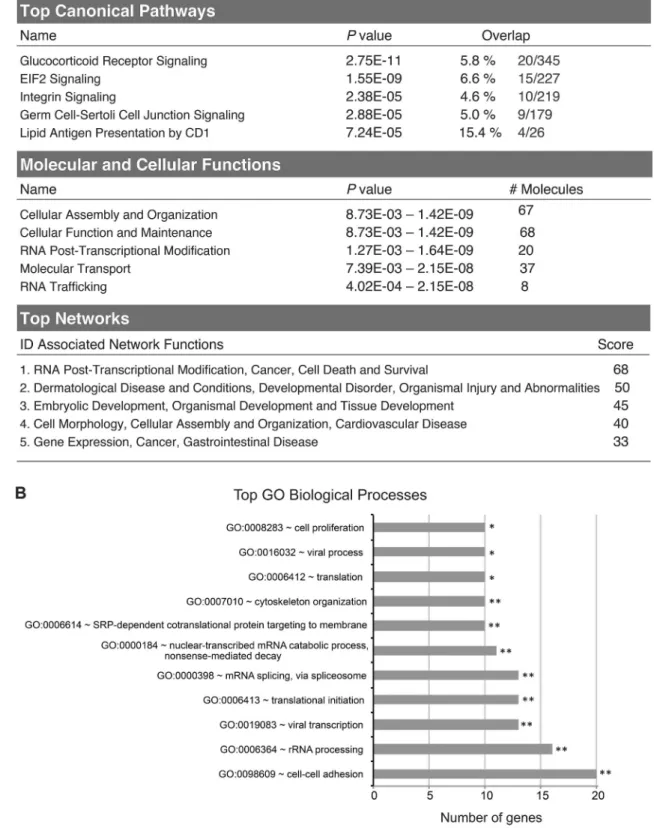
IPA software for enrichment analysis of these 203 proteins differ-entially oxidized between AA-treated and non-treated conditions re-vealed that glucocorticoid receptor signaling and EIF2 signaling path-ways were among the top significant canonical pathpath-ways (Fig. 4A). The top five significantly enriched molecular and cellular pathways in-cluded cellular assembly and organization, cellular function and maintenance, RNA post-transcriptional modification, molecular trans-port and RNA trafficking (Fig. 4A). These proteins’ main networks were dominated by RNA post-transcriptional modification, cancer, cell death and survival (Fig. 4A). Moreover, protein classification according to their GO biological processes in DAVID database fall into categories of cell-cell adhesion, rRNA processing, translational initiation, viral tran-scription, and cell proliferation, among others (Fig. 4B). Taken to-gether, redoxome data seem to point to the possible effect of AA treatment on DNA replication and transcription/translation, among other pathways.
Fig. 2. Glutathione oxidation and ROS generation in response to AA and DHA treatments in MDA-MB-231 cells. (A) GSH and GSSG quantities were assessed in non-treated cells and cells treated with 2.5 or 10 mM AA or DHA for ½ hour and 2 h. Treatment with 250 μM diamide for 10 min was used as a positive control (PC). GSH/GSSG ratio value in non-treated cells is set as 1 and relative GSH/GSSG ratios calculated in treated conditions are represented as means ± SD of 4 independent experiments. Statistical significance is assessed by ordinary one-way ANOVA with Tukey's multiple comparisons test. (B) General intracellular ROS was assessed by flow cytometry using carboxy-H2DCFDA probes in non-treated cells (NT), cells treated with 2.5 or 10 mM AA
or DHA for 4 h (upper panel), cells treated with 10 mM AA, 10 mM AA plus 2000 U/ml catalase or 10 mM AA plus 10 mM GSH (lower panel). Treatment with 100 μM H2O2for 20 min was used as a positive control (PC). Mean
fluorescence value in non-treated MDA-MB-231 cells is set as 1 and relative fluorescence intensity is represented. Data are means ± SD of 4 independent experiments. Statistical significance is assessed by ordinary one-way ANOVA with Tukey's multiple comparisons test. (C) MTT assay was performed on cells treated with 10 mM AA or DHA alone or in the presence of 2000 U/ml catalase, 10 mM NAC or 10 mM GSH for 24 h. Data are means ± SD of at least 6 independent experiments. Statistical significance is assessed by two-way ANOVA with Tukey's multiple comparisons test. ****, P < 0.0001; **,
3.4. S-phase of cell cycle is affected by AA treatment
As a first attempt, we performed cell cycle analysis on MDA-MB-231 cells upon AA treatment using BrdU. BrdU is a thymidine analogue which can be incorporated into the DNA during replication. BrdU staining thus allows to follow newly synthesized DNA together with total DNA staining by PI to measure total DNA content and assign the cells to the various stages of the cell cycle. Cells were left non-treated or treated with 10 mM AA for 2 h. Then, at various time points of post-treatment recovery (from 0 to 24 h), cells were pulse-labeled with BrdU followed by PI staining and FACS analysis. A significant decrease in BrdU incorporation was observed after 2 h of AA treatment, indicating an S-phase arrest when compared to non-treated cells (Fig. 5A and B). To support these data, cells were first labeled with BrdU, and then treated or not with 10 mM AA for 2 h before being analyzed by FACS at various time points during post-treatment recovery. Cells subjected to AA treatment showed an immediate and prolonged S-phase delay (Fig. 5C). Moreover, catalase efficiently prevented S-phase slowdown in both conditions of BrdU pulse, post and prior AA treatment (Fig. 5A–C), suggesting that H2O2production is causal in the inhibition of DNA
re-plication. Taken together, these observations points to the possibility that the inhibition of DNA replication is one of the causes of AA cyto-toxicity.
3.5. Translation inhibition in response to AA treatment
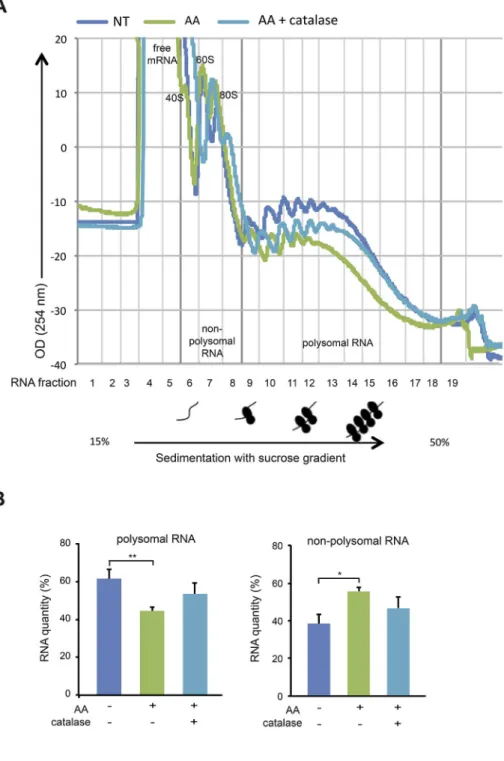
We next performed polysome profiling to monitor translation ac-tivity of mRNA in MDA-MB-231 cells upon AA treatment. Cellular RNAs were extracted and fractioned in a 15–50% sucrose gradient. When comparing nonpolysomal RNA and polysomal RNA quantities between non-treated cells and cells treated with 10 mM AA for 2 h, a significant decrease in polysomal RNA (62 ± 5% vs 44 ± 2%) accompanied with a significant increase in nonpolysomal RNA (38 ± 5% vs 56 ± 2%) occurred, reflecting a decrease of cellular translation activity upon AA treatment (Fig. 6A and B). Moreover, adding catalase (2000 U/ml) that rescued cell viability rescued partially the cellular translation activity as seen for polysomal RNA (44 ± 2% in AA-treated cells vs 53 ± 6% in AA plus catalase-treated cells) and for nonpolysomal RNA (38 ± 5% vs 47 ± 6%) (Fig. 6A and B). Taken together, these data suggest that the AA-induced inhibitory effect on mRNA translation contributes to AA cytotoxicity.
3.6. H2O2scavenging system including PRDX1 is linked to variable cellular
sensitivity to AA
The different sensitivity to AA among TNBC and non-TNBC cells prompted us to identify gene and protein expressions that correlate with AA anticancer activity. Pattern comparison using the NCI-60 CellMiner web tool [34,35] was performed to assess the correlation between gene expression and AA cytotoxicity. Significant negative Pearson's correlations (meaning that the more a gene is expressed, the more cells are resistant to AA) were defined at r < −0.334 based on a minimum of 35 informative cell lines, and P value < 0.05 in the ab-sence of multiple comparisons. This analysis allowed us to identify 246
genes with transcript levels correlated negatively and significantly with AA cytotoxicity (SupplementaryTable 2). PTGR1 had the highest sig-nificant correlation value (r = −0.608, P = 0) and was already high-lighted in our earlier work as a predictive biomarker for resistance of breast cancer cell lines to auranofin/VitC combinational cytotoxicity [28]. For AA alone, expressions of some antioxidant genes such as
TXNRD1 (r = −0.401, P = 1.624 × 10⁻³) and PRDX1 (r = −0.384,
P = 2.678 × 10⁻³) also correlated negatively with AA cytotoxicity.
We performed a pathway analysis using the IPA software for the 246 genes. NRF2-mediated oxidative stress response was the first significant canonical pathway enriched (SupplementaryFig. 2A). Top statistically significant molecular and cellular pathways for these genes included cellular movement and cell death and survival, among others. Finally, the top networks of these genes included cancer, cell death and survival and carbohydrate metabolism. Protein classification according to their GO biological processes in DAVID database highlighted a significant association with signal transduction, oxidation-reduction process, and response to oxidative stress, among others (SupplementaryFig. 2B). All these data directed us to conclude that oxidative stress response genes play a role in the resistance of cancer cells to H2O2-mediated
cyto-toxicity of AA.
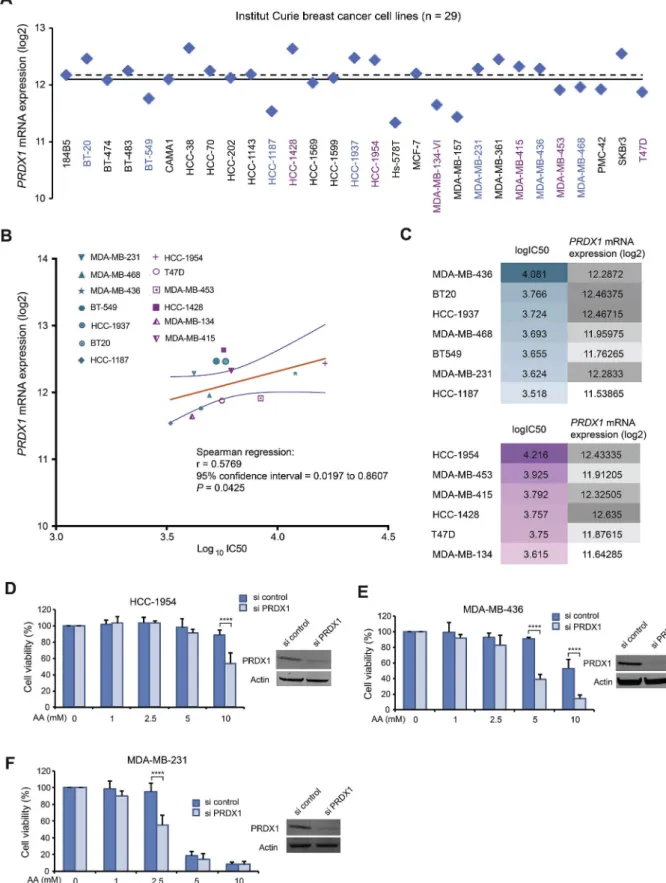
We wanted to ascertain that, for these genes, the predicted negative correlation of their expression with AA activity according to NCI-60 database are indeed valid on breast cancer cell lines. We thus calculated IC50 of AA on 13 breast cancer cell lines (SupplementaryFig. 3) and correlated them with the retrieved gene expression data from the In-stitut Curie database.Fig. 7A shows PRDX1 gene expression (mRNA) distribution of 29 breast cancer cell lines. A correlation between AA activity (log10IC50) and PRDX1 expression levels (log2) was statistically
significant and valid for most of the breast cancer cell lines studied (Spearman's correlation r = 0.5769, P = 0.0425) (Fig. 7B and C). By knocking down PRDX1 gene, the highly resistant HCC-1954 became significantly more sensitive to 10 mM AA, MDA-MB-436 cells became significantly more sensitive to 5 or 10 mM AA (Fig. 7D and E), and MDA-MB-231 cells became significantly more sensitive to 2.5 mM AA (Fig. 7F). Consistently, we previously showed that PRDX1 knockdown sensitizes HeLa and A549 cancer cells toward ROS-generating antic-ancer molecules [24,36]. More recently, other researchers reported inhibitory effect of PRDX1-knockout on growth of mammary tumor in mouse model, enhancing VitC cytotoxicity [37]. Finally, NCI-60 data also indicate that lung cancer cells that are mostly resistant to AA have high PRDX1 expression (SupplementaryFig. 4). Further experiments on larger panel of cells in each cancer type are needed for achieve firm conclusions on the predictive value of PRDX1 expression.
4. Discussion
Anticancer effect of VitC at pharmacologic concentrations has been largely attributed to H2O2 extracellular generation from AA
[4,6–8,38,39]. However, one study reported that VitC selectively kills KRAS and BRAF mutant colorectal cancer cells by targeting GAPDH via DHA [10]. Here we showed that AA displayed much higher cytotoxicity than DHA in 13 breast cancer cell lines. Normal cells including HMEC, human dermal fibroblasts and HUVEC were much less affected by AA
Fig. 3. Extracellular and intracellular H2O2accumulation upon AA treatment in MDA-MB-231 cells. (A) Using Amplex-Red Kit, H2O2concentration was
measured in the medium in the presence of MDA-MB-231 cells, without treatment or treated with 10 mM AA alone, 10 mM AA plus 2000 U/ml catalase, for 5 min, ½ hour and 2 h. The same measurements were done on the medium without cells as controls. Quantifications are means ± SD of 3 independent experiments. (B) Cells transiently expressing respectively cytoplasm-, nucleus-, mitochondria- and cell membrane-targeted HyPer were not treated or treated with 10 mM AA alone or together with 2000 U/ml catalase for 5 min, ½ hour and 2 h. Treatment with 100 μM H2O2for 20 min was used as a positive control (PC). HyPer redox state was
evaluated by redox Western blot. ox, oxidized form; red, reduced form. Graphs show the quantification of oxidized HyPer (%) vs total HyPer protein. Quantifications are means ± SD of 3 independent experiments. (C) Redox state of PRDX1 and PRDX3 was assessed using redox Western blot in cells without treatment or treated with 10 mM AA alone, 10 mM AA plus 2000 U/ml catalase, for 5 min, ½ hour and 2 h. Treatment with 100 μM H2O2for 20 min was used as a positive control (PC).
ox, oxidized form; red, reduced form. Quantifications of oxidized PRDX1 or PRDX3 (%) vs total protein in MDA-MB-231 cells are means ± SD of 3 independent experiments. Statistical significance is assessed by ordinary one-way ANOVA with Tukey's multiple comparisons test. ****, P < 0.0001; ***, P < 0.001; **,
Fig. 4. Pathway, function and network analysis of the differentially oxidized cysteine-containing proteins identified by “redoxome” upon AA treatment. The alterations of the oxidized proteome of cysteine-containing proteins, after 10 mM AA treatment for ½ hour in MDA-MB-231 cells were analyzed by mass spectrometry. 203 differentially oxidized proteins with P < 0.05 and a fold change over 1.5 in at least one of the two biological experiments were identified between AA-treated and non-treated cells. (A) Significantly altered cysteine-containing proteins were mapped by the IPA analysis software. The top 5 significantly associated canonical pathways, molecular and cellular functions and networks of these proteins are represented. (B) Altered proteins were classified according to their GO biological process pathways in DAVID database. The top significantly (Fisher's modified test) associated biological processes are represented. **, P < 0.01; *,
treatment. While most of breast cancer cell lines were sensitive to AA similar to MDA-MB-231 cells, some cell lines, such as HCC-1954 and MDA-MB-436, were more resistant. AA-induced cytotoxicity toward MDA-MB-231 cells was entirely linked to extracellular H2O2generation
and intracellular accumulation in different compartments together with GSH oxidation.
Since H2O2is the main player in AA cytotoxicity, we analyzed
re-doxome in MDA-MB-231 cells in order to reveal a general oxidation
spectrum of cysteine-containing proteins in response to AA. The short-time AA treatment (½ hour) unlikely affects basal protein abundance and therefore is less likely to bias protein oxidation data. Indeed, Western blot for several randomly selected individual proteins that showed a significant change in oxidation/reduction state of cysteines following AA treatments indicated no change in total protein abun-dance under the same condition as used in redoxome study (data not shown). As expected, AA oxidizes antioxidant proteins such as PRDX1
Fig. 5. Effect AA treatment on cell cycles of MDA-MB-231 cells. (A) Non-treated (NT) cells, cells treated for 2 h with 10 mM AA, 10 mM AA plus 2000 U/ml catalase were released in flesh medium. At various time points of post-treatment recovery (from 0 to 24 h), these cells were stained with BrdU for 1 h followed by PI staining and FACS analysis. Dot plots of samples from 0, 6 and 24 h post-treatment recovery are presented with values of the percentages (%) of the population in each phase of cell cycle (G0-G1, S, G2-M). (B) Histogram shows the percentages (%) of cells in G0-G1, S, G2-M phases at 0 h post-AA treatment as means ± SD calculated from 3 independent experiments. Statistical significance is assessed by one-way ANOVA with Tukey's multiple comparisons test. *, P < 0.05. (C) MDA-MB-231 cells were labeled with BrdU for 1 h and then subjected to three treatment conditions for 2 h: non-treatment (NT), treated with 10 mM AA, or 10 mM AA plus 2000 U/ml catalase. Cells were then analyzed by flow cytometry after PI staining at different time points during recovery in growth media (0, 6 or 24 h). Representative graphs of at least 3 experiments are shown.
Fig. 6. Effect AA treatment on polysome gradient profiles of MDA-MB-231 cells. (A) Non-treated (NT) cells, cells treated for 2 h with 10 mM AA, 10 mM AA plus 2000 U/ml catalase were incubated for 15 min with cycloheximide to stop ribosomal elongation. Cellular RNA was extracted and frac-tioned in a 15–50% sucrose gradient. Optical density profiles (OD 254 nm) of polysome gradient profiles are shown, and non-polysomal RNA corresponding to fractions 1 to 8 (containing ribosomal RNAs present in 40S, 60S, and 80S ribosomal complexes and free mRNAs) and polysomal RNA corresponding to frac-tions 9 to 18 (containing mRNAs bound to more than one ribosome) are indicated. (B) The areas under the curve (AUC) of the optical density profiles of non-polysomal and non-polysomal RNA were measured, the percentage of non-polysomal or polysomal RNA re-lative to total was then calculated. Quantifications are represented in graphs as means ± SD of 3 in-dependent experiments. Statistical significance is assessed by ordinary one-way ANOVA with Tukey's multiple comparisons test. **, P < 0.01; *,
Fig. 7. PRDX1 expression and its link to breast cancer cellular response to AA. (A) PRDX1 mRNA expression patterns in log2values in 29 breast cancer cells
retrieved from publicly available transcriptomic datasets of the Institut Curie breast cancer cell lines. Mean and median values are shown as solid and dashed lines, respectively. (B) Spearman's correlation analysis corresponding to PRDX1 mRNA expression vs IC50 for AA on 13 breast cancer cell lines. IC50 values were calculated from MTT assays for cell viability. Spearman's correlation was performed using GraphPad software. The 7 TNBC cell lines are indicated by green symbols and the 6 non-TNBC cell lines by purple symbols. The best-fit line is in solid orange line and the 95% confidence bands of the best-fit line are indicated in blue lines. Mathematical parameters are represented next to the graphs. (C) logIC50 of AA for breast cancer cell lines and their PRDX1 mRNA expression in log2 values. (D-E-F) MTT assay on HCC-1954, MDA-MB-436 and MDA-MB231 cells transiently transfected with PRDX1 specific siRNA or control siRNA for 48 h followed by treatments with different concentrations of AA for 24 h. The insert is Western blot to verify efficiency of PRDX1 knockdown in siRNA transfected cells. Statistical significance is assessed by two-way ANOVA with Sidak's multiple comparisons test. ****, P < 0.0001.
and GGCT, very probably affecting the thioredoxin and glutathione scavenging systems. Furthermore, AA alters the redox state of many proteins implicated in the metabolic process, providing a rational ex-planation for a set of previously reported data that AA induced meta-bolic alterations, impairing glycolysis [10], pentose phosphate pathway, glycolysis and tricarboxylic acid cycle [18], impairing the Warburg metabolism and downregulating glucose transporters and pyruvate kinase M2 in cancer cells [33].
Several proteins involved in RNA metabolism and related pathways such as rRNA processing and translational initiation were significantly enriched in redoxome data upon AA treatment. Consistently, we showed a strong inhibitory effect of AA on mRNA translation in MDA-MB-231 cells, indicating that mRNA translation inhibition is one of the possible mechanisms responsible for oxidative stress-based AA cyto-toxicity. This is in accordance with the fact that cells globally down-regulate translation as quick adaptive response to stress [40]. In fact, cells resort to translational reprogramming toward selective translation of mRNAs encoding vital proteins, involved in survival and stress re-covery, in an attempt to alleviate cellular burden under unfavorable conditions [41]. It is worth noting that since recognizing the important role played by deregulated translation in carcinogenesis [42], the re-pression or blockage of protein synthesis has gained a significant in-terest as a promising anticancer strategy [43,44]. Similarly, a set of proteins implicated in DNA metabolism and related cell proliferation pathway were found among the proteins with oxidized cysteine upon AA treatment. Indeed, cell cycle of MDA-MB-231 cells was impaired upon AA treatment for 2 h, suggesting potential involvement of DNA replication inhibition in AA cytotoxicty. It is shown that AA, via H2O2
generation, induces time- and concentration-dependent genotoxic stress and DNA damage and activates the ataxia telangiectasia mutated (ATM)/adenosine monophosphate-activated protein kinase (AMPK) pathway, all of which inhibit the mammalian target of rapamycin (mTOR) signaling pathway connected to cell proliferation, inducing cell death in ovarian cancer cells [19]. On the other hand, a direct impact of VitC and vitamin K3 combination on ribonucleotide reductase (RNR) was observed [45]. RNR activity was directly inhibited by the H2O2
generated along with the limited electron supply upon thioredoxin and glutathione oxidation by the combination of the two molecules. RNR is essential for de novo production of deoxyribonucleotides that is highly needed in cancer cells, thus RNR could be the link between VitC, DNA replication impairement and cancer cell death [45].
The mechanism by which VitC kills cancer cells while sparing normal cells is not entirely clear. It could be linked to a differential ability to metabolize H2O2between normal and cancer cells [11],
dif-ferential SVCT2 expression [14], or to cancer cells altered redox-active iron metabolism [15]. Our redoxome data and bioinformatics analysis indicate that AA-generated H2O2can target multiple pathways at the
same time, which might be particularly deleterious for cancer cells that strongly rely on antioxidants and metabolic reprogramming for sur-vival, contributing cytotoxic selectivity of AA in cancer vs normal cells. Our bioinformatics analysis also revealed that proteins belonging to the antioxidant system or NRF2-mediated oxidative stress response are linked to variable cellular sensitivity to AA (SupplementaryFig. 2A). Precisely, PRDX1 gene expression correlated significantly with the re-sponse of breast cancer cell lines to AA, as cells with higher PRDX1 expression were more resistant to AA, and PRDX1 knockdown enhanced cellular sensitivity to AA. PRDX1 is a key antioxidant that is directly involved in H2O2elimination, thus has a protective activity against
AA-generated H2O2and could indeed be linked to AA resistance. PRDX1
prediction value to AA treatment outcome warrants further validation in pre-clinical and clinical studies.
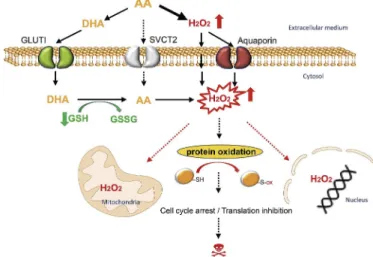
In summary, combined with previously reported data in the litera-ture, this work provides insights on differential breast cancer cell line response toward AA and DHA treatments (Fig. 8). We first showed an extracellular generation of H2O2by AA, but also an intracellular
ac-cumulation of H2O2. Intracellular H2O2 can be transported from the
extracellular medium by aquaporins or by passive diffusion across plasma cellular membranes [46] but also generated by intracellular AA upon import through SVCTs (mainly SVCT2) [47]. Although in breast cancer cells, AA may not be imported by SVCT2, but only to mi-tochondria via mimi-tochondrial SVCT2 (mitSVCT2), AA can be oxidized extracellularly to DHA and then imported through glucose transporters to be reduced by GSH-dependent mechanisms to AA intracellularly [48], consuming intracellular GSH [49,50]. AA treatment was cytotoxic toward most of breast cancer cells tested and its higher cytotoxicity compared to DHA was mainly linked to H2O2generation. We identified
that proteins involved in DNA replication, cell cycle progression and translations are among the principal targets of AA-induced cysteine redox alterations and could be linked to AA-induced cytotoxicity.
Clinical data demonstrate that plasma VitC concentrations even greater than 10 mM are achievable in humans without causing apparent adverse effects [51,52], and that pharmacological AA are well tolerated by patients and can increase the efficacy of conventinal radiotharapy and chemotherapy [15,23]. In our study, such AA concentrations were cytotoxic toward most of breast cancer cell lines without severely af-fecting normal cells, suggesting that VitC and VitC-based rational drug combinations could be novel therapeutic opportunities for triple-ne-gative breast cancer and other cancers with similar redox properties.
Financial support
This work was supported by the CNRS, the Institut Curie, the Institut National du Cancer SiRIC grant (INCa-DGOS-4645 to MEH), la Fondation ARC grant (PJA 20151203330 to MEH). NEB is supported by PhD program from the Université Paris-Saclay and by the Fondation pour la Recherche Médicale grant (FDT201805005397), EH is sup-ported by a postdoctoral fellowship from the Ligue Nationale Contre le Cancer and Crédit Agricole île de France Mécénat. LV is supported by INSERM.
Fig. 8. A model for AA- and DHA-induced cytotoxicity in breast cancer cells. Upon AA-treatment, H2O2is generated in the extracellular medium and
then imported to breast cancer cells by aquaporins or by passive diffusion across plasma cellular membranes. Extracellularly generated H2O2appears to
be the main source responsible for pro-oxidant properties of AA at pharmaco-logic concentrations. Although AA may not be imported to cells from the ex-ternal environment by sodium-dependent VitC transporters (mainly SVCT2) in breast cancer, AA can be oxidized extracellularly into DHA and then imported through glucose transporters (mainly GLUT1). DHA is reduced to AA in-tracellularly by GSH-dependent mechanisms, consuming intracellular reduced glutathione. AA thus generated further enhances H2O2accumulation in
dif-ferent cellular compartments. A substantial increase in H2O2causes redox
modifications of cysteine-containing proteins, including those involved in translation and cell cycle progression. These effects contribute to AA-induced cytotoxicity toward breast cancer cells.
Disclosure of potential conflicts of interest
The authors disclose on potential conflicts of interest.
Acknowledgements
We thank Fabien Reyal and Alice Pinheiro for kindly providing us some of the breast cancer cell lines used. We also thank Hélène Malka-Mahieu, Pierre-Marie Girard, Charlène Lasgi and Marie-Noëlle Soler for advice and technical assistance.
Appendix A. Supplementary data
Supplementary data to this article can be found online athttps:// doi.org/10.1016/j.redox.2019.101290.
References
[1] C. Gorrini, I.S. Harris, T.W. Mak, Modulation of oxidative stress as an anticancer strategy, Nat. Rev. Drug Discov. 12 (12) (2013) 931–947.
[2] D. Trachootham, J. Alexandre, P. Huang, Targeting cancer cells by ROS-mediated mechanisms: a radical therapeutic approach? Nat. Rev. Drug Discov. 8 (7) (2009) 579–591.
[3] L. Chaiswing, W.H. St Clair, D.K. St Clair, Redox paradox: a novel approach to therapeutics-resistant cancer, Antioxid Redox Signal 29 (13) (2018) 1237–1272. [4] J. Du, J.J. Cullen, G.R. Buettner, Ascorbic acid: chemistry, biology and the
treat-ment of cancer, Biochim. Biophys. Acta 1826 (2) (2012) 443–457.
[5] A.J. Michels, B. Frei, Myths, artifacts, and fatal flaws: identifying limitations and opportunities in vitamin C research, Nutrients 5 (12) (2013) 5161–5192. [6] Q. Chen, M.G. Espey, A.Y. Sun, J.H. Lee, M.C. Krishna, E. Shacter, P.L. Choyke,
C. Pooput, K.L. Kirk, G.R. Buettner, et al., Ascorbate in pharmacologic concentra-tions selectively generates ascorbate radical and hydrogen peroxide in extracellular fluid in vivo, Proc. Natl. Acad. Sci. U.S.A. 104 (21) (2007) 8749–8754. [7] Q. Chen, M.G. Espey, A.Y. Sun, C. Pooput, K.L. Kirk, M.C. Krishna, D.B. Khosh,
J. Drisko, M. Levine, Pharmacologic doses of ascorbate act as a prooxidant and decrease growth of aggressive tumor xenografts in mice, Proc. Natl. Acad. Sci. U.S.A. 105 (32) (2008) 11105–11109.
[8] M. Levine, M.G. Espey, Q. Chen, Losing and finding a way at C: new promise for pharmacologic ascorbate in cancer treatment, Free Radic. Biol. Med. 47 (1) (2009) 27–29.
[9] K.E. Brandt, K.C. Falls, J.D. Schoenfeld, S.N. Rodman, Z. Gu, F. Zhan, J.J. Cullen, B.A. Wagner, G.R. Buettner, B.G. Allen, et al., Augmentation of intracellular iron using iron sucrose enhances the toxicity of pharmacological ascorbate in colon cancer cells, Redox Biol. 14 (2018) 82–87.
[10] J. Yun, E. Mullarky, C. Lu, K.N. Bosch, A. Kavalier, K. Rivera, J. Roper, Chio II, E.G. Giannopoulou, C. Rago, et al., Vitamin C selectively kills KRAS and BRAF mutant colorectal cancer cells by targeting GAPDH, Science 350 (6266) (2015) 1391–1396.
[11] C.M. Doskey, V. Buranasudja, B.A. Wagner, J.G. Wilkes, J. Du, J.J. Cullen, G.R. Buettner, Tumor cells have decreased ability to metabolize H2O2: implications for pharmacological ascorbate in cancer therapy, Redox Biol. 10 (2016) 274–284. [12] S.W. Hong, S.H. Lee, J.H. Moon, J.J. Hwang, D.E. Kim, E. Ko, H.S. Kim, I.J. Cho,
J.S. Kang, D.J. Kim, et al., SVCT-2 in breast cancer acts as an indicator for L-as-corbate treatment, Oncogene 32 (12) (2013) 1508–1517.
[13] C. Wohlrab, E. Phillips, G.U. Dachs, Vitamin C transporters in cancer: current un-derstanding and gaps in knowledge, Front Oncol. 7 (2017) 74.
[14] C. Wang, H. Lv, W. Yang, T. Li, T. Fang, G. Lv, Q. Han, L. Dong, T. Jiang, B. Jiang, et al., SVCT-2 determines the sensitivity to ascorbate-induced cell death in cho-langiocarcinoma cell lines and patient derived xenografts, Cancer Lett. 398 (2017) 1–11.
[15] J.D. Schoenfeld, Z.A. Sibenaller, K.A. Mapuskar, B.A. Wagner, K.L. Cramer-Morales, M. Furqan, S. Sandhu, T.L. Carlisle, M.C. Smith, T. Abu Hejleh, et al., O2•–and H2O2 -mediated disruption of Fe metabolism causes the differential susceptibility of NSCLC and GBM cancer cells to pharmacological ascorbate, Cancer Cell 32 (2) (2017) 268.
[16] J.D. Schoenfeld, Z.A. Sibenaller, K.A. Mapuskar, M.D. Bradley, B.A. Wagner, G.R. Buettner, V. Monga, M. Milhem, D.R. Spitz, B.G. Allen, Redox active metals and H2O2mediate the increased efficacy of pharmacological ascorbate in combi-nation with gemcitabine or radiation in pre-clinical sarcoma models, Redox Biol. 14 (2018) 417–422.
[17] H. Pelicano, D. Carney, P. Huang, ROS stress in cancer cells and therapeutic im-plications, Drug Resist Updat. 7 (2) (2004) 97–110.
[18] M. Uetaki, S. Tabata, F. Nakasuka, T. Soga, M. Tomita, Metabolomic alterations in human cancer cells by vitamin C-induced oxidative stress, Sci. Rep. 5 (2015) 13896. [19] Y. Ma, J. Chapman, M. Levine, K. Polireddy, J. Drisko, Q. Chen, High-dose
par-enteral ascorbate enhanced chemosensitivity of ovarian cancer and reduced toxicity of chemotherapy, Sci. Transl. Med. 6 (222) (2014) 222ra218.
[20] J. Du, J.A. Cieslak 3rd, J.L. Welsh, Z.A. Sibenaller, B.G. Allen, B.A. Wagner, A.L. Kalen, C.M. Doskey, R.K. Strother, A.M. Button, et al., Pharmacological as-corbate radiosensitizes pancreatic cancer, Cancer Res. 75 (16) (2015) 3314–3326.
[21] J. Du, S.M. Martin, M. Levine, B.A. Wagner, G.R. Buettner, S.H. Wang, A.F. Taghiyev, C. Du, C.M. Knudson, J.J. Cullen, Mechanisms of ascorbate-induced cytotoxicity in pancreatic cancer, Clin. Cancer Res. 16 (2) (2010) 509–520. [22] X. Wei, Y. Xu, F.F. Xu, L. Chaiswing, D. Schnell, T. Noel, C. Wang, J. Chen, D.K. St
Clair, W.H. St Clair, RelB expression determines the differential effects of ascorbic acid in normal and cancer cells, Cancer Res. 77 (6) (2017) 1345–1356. [23] K. Polireddy, R. Dong, G. Reed, J. Yu, P. Chen, S. Williamson, P.C. Violet,
Z. Pessetto, A.K. Godwin, F. Fan, et al., High dose parenteral ascorbate inhibited pancreatic cancer growth and metastasis: mechanisms and a phase I/IIa study, Sci. Rep. 7 (1) (2017) 17188.
[24] T. He, E. Hatem, L. Vernis, M. Lei, M.E. Huang, PRX1 knockdown potentiates vi-tamin K3 toxicity in cancer cells: a potential new therapeutic perspective for an old drug, J. Exp. Clin. Cancer Res. 34 (2015) 152.
[25] P. Liu, H. Zhang, H. Wang, Y. Xia, Identification of redox-sensitive cysteines in the Arabidopsis proteome using OxiTRAQ, a quantitative redox proteomics method, Proteomics 14 (6) (2014) 750–762.
[26] Y. Perez-Riverol, A. Csordas, J. Bai, M. Bernal-Llinares, S. Hewapathirana, D.J. Kundu, A. Inuganti, J. Griss, G. Mayer, M. Eisenacher, et al., The PRIDE da-tabase and related tools and resources in 2019: improving support for quantification data, Nucleic Acids Res. 47 (D1) (2019) D442–D450.
[27] D. Graindorge, S. Martineau, C. Machon, P. Arnoux, J. Guitton, S. Francesconi, C. Frochot, E. Sage, P.M. Girard, Singlet oxygen-mediated oxidation during UVA radiation alters the dynamic of genomic DNA replication, PLoS One 10 (10) (2015) e0140645.
[28] E. Hatem, S. Azzi, N. El Banna, T. He, A. Heneman-Masurel, L. Vernis, D. Baille, V. Masson, F. Dingli, D. Loew, et al., Auranofin/vitamin C: a novel drug combi-nation targeting triple-negative breast cancer, J Natl Cancer Inst. 111 (6) (2019) 597–608.
[29] A.J. Meyer, T.P. Dick, Fluorescent protein-based redox probes, Antioxid Redox Signal 13 (5) (2010) 621–650.
[30] V.V. Belousov, A.F. Fradkov, K.A. Lukyanov, D.B. Staroverov, K.S. Shakhbazov, A.V. Terskikh, S. Lukyanov, Genetically encoded fluorescent indicator for in-tracellular hydrogen peroxide, Nat. Methods 3 (4) (2006) 281–286. [31] Y.M. Go, D.P. Jones, The redox proteome, J. Biol. Chem. 288 (37) (2013)
26512–26520.
[32] Y.M. Go, J.D. Chandler, D.P. Jones, The cysteine proteome, Free Radic. Biol. Med. 84 (2015) 227–245.
[33] O. Aguilera, M. Munoz-Sagastibelza, B. Torrejon, A. Borrero-Palacios, L. Del Puerto-Nevado, J. Martinez-Useros, M. Rodriguez-Remirez, S. Zazo, E. Garcia, M. Fraga, et al., Vitamin C uncouples the Warburg metabolic switch in KRAS mutant colon cancer, Oncotarget 7 (30) (2016) 47954–47965.
[34] W.C. Reinhold, M. Sunshine, H. Liu, S. Varma, K.W. Kohn, J. Morris, J. Doroshow, Y. Pommier, CellMiner: a web-based suite of genomic and pharmacologic tools to explore transcript and drug patterns in the NCI-60 cell line set, Cancer Res. 72 (14) (2012) 3499–3511.
[35] U.T. Shankavaram, S. Varma, D. Kane, M. Sunshine, K.K. Chary, W.C. Reinhold, Y. Pommier, J.N. Weinstein, CellMiner: a relational database and query tool for the NCI-60 cancer cell lines, BMC Genomics 10 (2009) 277.
[36] T. He, A. Banach-Latapy, L. Vernis, M. Dardalhon, R. Chanet, M.E. Huang, Peroxiredoxin 1 knockdown potentiates beta-lapachone cytotoxicity through modulation of reactive oxygen species and mitogen-activated protein kinase signals, Carcinogenesis 34 (4) (2013) 760–769.
[37] M. Bajor, A.O. Zych, A. Graczyk-Jarzynka, A. Muchowicz, M. Firczuk, L. Trzeciak, P. Gaj, A. Domagala, M. Siernicka, A. Zagozdzon, et al., Targeting peroxiredoxin 1 impairs growth of breast cancer cells and potently sensitises these cells to proox-idant agents, Br J Cancer 119 (7) (2018) 873–884.
[38] Q. Chen, M.G. Espey, M.C. Krishna, J.B. Mitchell, C.P. Corpe, G.R. Buettner, E. Shacter, M. Levine, Pharmacologic ascorbic acid concentrations selectively kill cancer cells: action as a pro-drug to deliver hydrogen peroxide to tissues, Proc. Natl. Acad. Sci. U.S.A. 102 (38) (2005) 13604–13609.
[39] M. Levine, S.J. Padayatty, M.G. Espey, Vitamin C: a concentration-function ap-proach yields pharmacology and therapeutic discoveries, Adv Nutr. 2 (2) (2011) 78–88.
[40] E. de Nadal, G. Ammerer, F. Posas, Controlling gene expression in response to stress, Nat. Rev. Genet. 12 (12) (2011) 833–845.
[41] B. Liu, S.B. Qian, Translational reprogramming in cellular stress response, Wiley Interdiscip Rev RNA 5 (3) (2014) 301–315.
[42] D. Silvera, S.C. Formenti, R.J. Schneider, Translational control in cancer, Nat. Rev. Cancer 10 (4) (2010) 254–266.
[43] L.M. Lindqvist, I. Vikstrom, J.M. Chambers, K. McArthur, M. Ann Anderson, K.J. Henley, L. Happo, L. Cluse, R.W. Johnstone, A.W. Roberts, et al., Translation inhibitors induce cell death by multiple mechanisms and Mcl-1 reduction is only a minor contributor, Cell Death Dis. 3 (2012) e409.
[44] M. Bhat, N. Robichaud, L. Hulea, N. Sonenberg, J. Pelletier, I. Topisirovic, Targeting the translation machinery in cancer, Nat. Rev. Drug Discov. 14 (4) (2015) 261–278. [45] X. Ren, S.M. Santhosh, L. Coppo, F.T. Ogata, J. Lu, A. Holmgren, The combination of ascorbate and menadione causes cancer cell death by oxidative stress and re-plicative stress, Free Radic. Biol. Med. 134 (2019) 350–358.
[46] G.P. Bienert, J.K. Schjoerring, T.P. Jahn, Membrane transport of hydrogen peroxide, Biochim. Biophys. Acta 1758 (8) (2006) 994–1003.
[47] H. Tsukaguchi, T. Tokui, B. Mackenzie, U.V. Berger, X.Z. Chen, Y. Wang, R.F. Brubaker, M.A. Hediger, A family of mammalian Na+-dependent L-ascorbic acid transporters, Nature 399 (6731) (1999) 70–75.
[48] E. Pena, F.J. Roa, E. Inostroza, K. Sotomayor, M. Gonzalez, F.A. Gutierrez-Castro, M. Maurin, K. Sweet, C. Labrousse, M. Gatica, et al., Increased expression of mi-tochondrial sodium-coupled ascorbic acid transporter-2 (mitSVCT2) as a central
feature in breast cancer, Free Radic. Biol. Med. 135 (2019) 283–292.
[49] J.C. Vera, C.I. Rivas, R.H. Zhang, C.M. Farber, D.W. Golde, Human HL-60 myeloid leukemia cells transport dehydroascorbic acid via the glucose transporters and ac-cumulate reduced ascorbic acid, Blood 84 (5) (1994) 1628–1634.
[50] J.M. May, Z.C. Qu, D.R. Neel, X. Li, Recycling of vitamin C from its oxidized forms by human endothelial cells, Biochim. Biophys. Acta 1640 (2–3) (2003) 153–161. [51] C.M. Stephenson, R.D. Levin, T. Spector, C.G. Lis, Phase I clinical trial to evaluate
the safety, tolerability, and pharmacokinetics of high-dose intravenous ascorbic acid in patients with advanced cancer, Cancer Chemother. Pharmacol. 72 (1) (2013) 139–146.
[52] L.J. Hoffer, M. Levine, S. Assouline, D. Melnychuk, S.J. Padayatty, K. Rosadiuk, C. Rousseau, L. Robitaille, W.H. Miller Jr., Phase I clinical trial of i.v. ascorbic acid in advanced malignancy, Ann. Oncol. 19 (11) (2008) 1969–1974.