HAL Id: hal-02871770
https://hal.archives-ouvertes.fr/hal-02871770
Submitted on 17 Jun 2020
HAL is a multi-disciplinary open access
archive for the deposit and dissemination of
sci-entific research documents, whether they are
pub-lished or not. The documents may come from
teaching and research institutions in France or
abroad, or from public or private research centers.
L’archive ouverte pluridisciplinaire HAL, est
destinée au dépôt et à la diffusion de documents
scientifiques de niveau recherche, publiés ou non,
émanant des établissements d’enseignement et de
recherche français ou étrangers, des laboratoires
publics ou privés.
Data Augmentation for Automatic Identification of
Spatiotemporal Dispersion Electrograms in Persistent
Atrial Fibrillation Ablation Using Machine Learning
Amina Ghrissi, Douglas Almonfrey, Rafael Costa de Almeida, Fabien Squara,
Johan Montagnat, Vicente Zarzoso
To cite this version:
Amina Ghrissi, Douglas Almonfrey, Rafael Costa de Almeida, Fabien Squara, Johan Montagnat, et
al.. Data Augmentation for Automatic Identification of Spatiotemporal Dispersion Electrograms in
Persistent Atrial Fibrillation Ablation Using Machine Learning. 42nd Annual International
Confer-ences of the IEEE Engineering in Medicine and Biology Society, IEEE, Jul 2020, Montreal, Canada.
�hal-02871770�
Data Augmentation for Automatic Identification of Spatiotemporal
Dispersion Electrograms in Persistent Atrial Fibrillation Ablation Using
Machine Learning
Amina Ghrissi
1, Douglas Almonfrey
2, Rafael Costa de Almeida
3, Fabien Squara
1,4,
Johan Montagnat
1and Vicente Zarzoso
1Abstract— Catheter ablation is increasingly used to treat atrial fibrillation (AF), the most common sustained cardiac arrhythmia encountered in clinical practice. A recent breakthrough finding in AF ablation consists in identifying ablation sites based on their spatiotemporal dispersion (STD). STD stands for a delay of the cardiac activation observed in intracardiac electrograms (EGMs) across contiguous leads. In practice, interventional cardiologists localize STD sites visually using the PentaRay multipolar mapping catheter. This work aims at automatically characterizing STD by classifying EGM data into STD vs. non STD groups using machine learning (ML) techniques. A dataset of 23082 multichannel EGM recordings acquired by the PentaRay coming from 16 persistent AF patients is included in this study. A major problem hampering the classification performance lies in the highly imbalanced dataset ratio. We suggest to tackle data imbalance using adapted data augmentation techniques including 1) undersampling 2) oversampling 3) lead shift 4) time reversing and 5) time shift. These tools are designed to preserve the integrity of the cardiac data and are validated by a partner cardiologist. They provide enhancement in classification performance in terms of sensitivity, which increases from 50% to 80% while maintaining accuracy and AUC around 90% with oversampling. Bootstrapping is applied to check the variability of the trained classifiers.
Clinical relevance The machine learning techniques devel-oped in this contribution are expected to aid cardiologists in performing patient-tailored catheter ablation procedures for treating persistent AF.
I. INTRODUCTION
Atrial fibrillation (AF) is the most common sustained arrhythmia encountered in clinical practice. Hospitalizations with AF as the primary diagnosis represent nearly half million annually and this disease is estimated to contribute to almost one-hundred thousand deaths per year in the United States alone [1]. Among the existing treatments, ablation interventions prove more efficient than drug therapies to cure persistent AF. Ablation consists in burning atrial tissue areas thought to be responsible for the presence and maintenance
1 Universit´e Cˆote d’Azur, CNRS, I3S
Labora-tory, Sophia Antipolis, France {amina.ghrissi, fabien.squara, johan.montagnat,
vicente.zarzoso}@univ-cotedazur.fr
2 Federal Institute of Esprito Santo, Vitoria, Brazil
3 Federal University of Esprito Santo, Vitoria, Brazil
4 Universit´e Cˆote d’Azur, CHU Pasteur, Cardiology Department, Nice,
of AF by applying radiofrequency (RF) energy with the use of catheters. A recent breakthrough finding consists in identifying ablation sites without the stepwise approach [2]. The procedure gives 95% procedural success rate. It uses multipolar catheters to target areas of spatiotemporal dis-persion (STD) in the atria as potential AF drivers. The clustering of electrograms (EGMs) exhibiting STD allows for a wholly patient-tailored ablation. The PentaRay catheter used for STD localization has a five-branched star design allowing high-density mapping. According to preliminary guidelines for STD identification from visual inspection, the multichannel EGM recording acquired by the PentaRay would display a cardiac activation delay of 70% on a min-imum of three contiguous bipoles [2]. The major drawback of this visual identification is that it may be biased by the cardiologist’s subjectivity and the difficulty to quantify accurately the signal delay and fractionation degreee at each mapped location in real time. It is worth highlighting that thousands of cardiac sites are mapped in a typical ablation procedure.
The goal of this work is to automatically characterize STD-based ablation by classifying data acquired from the PentaRay multipolar catheter into STD vs. non STD cat-egories. Supervised machine learning (ML) techniques are utilized for this purpose [3]. We first build a dataset of 23082 multichannel EGM signals from 16 different persistent AF patients ablated using STD procedure. Second, anatomical points of the heart are automatically classified using two ML techniques: 1) a 5-layered convolutional neural network (CNN) and 2) a multivariate logistic regression (MLR). The main problem we encounter in the training process is that the dataset is highly imbalanced with a class ratio equal to 5%. The issue of insufficient amount of training samples from the STD class is addressed through data augmentation (DA) solutions. We restrict the study to DA techniques that preserve the integrity of EGM data, mainly the STD pattern. We also present our own DA methods called lead shift and time shift. To our knowledge, this is the first time automatic STD detection is addressed using ML and that lead and time shift techniques are proposed for multichannel EGM classifi-cation. In addition, the bootstrap statistical tool is applied to quantify the uncertainty associated with classification model performance [4].
Accepted for presentation at the 42nd Annual Intl. Conference of the IEEE Engineering in Medicine and Biology Society (EMBC), Montréal, Canada, July 20-24, 2020. AUTHORS’ FINAL VERSION
II. AF ABLATION
A. Catheter Ablation of Persistent AF
AF consists of an irregular activation in the upper cham-bers of the heart, the atria. Instead of beating effectively to eject blood into the ventricles, the atria start quivering or fibrillating, thus causing non synchronized fluctuations in the associated electrical baseline. As a result, the ventricular rate becomes more rapid and disorganized [5]. Drug therapy shows limited results in curing persistent AF due to the complexity of this arrhythmia. An increasingly used therapy consists in burning the cardiac myocytes (cells) displaying irregularities with RF energy delivered through a catheter. This invasive procedure is called ablation.
In the classical stepwise approach for persistent AF abla-tion, interventional cardiologists isolate electrically the pul-monary veins (pulpul-monary veins isolation, PVI) thus ablating the triggers around the PVs responsible to initiate AF. Then, cardiac areas displaying complex fractionated electrograms (CFAE) are ablated using a bipolar mapping catheter. How-ever, a growing number of reports find little advantage in targeting CFAEs after PVI [6]. Instead, potential AF drivers are ablated as they are responsible for maintaining and self-perpetuating AF [2].
B. STD-Guided Ablation
A recent breakthrough study revealed that ablating only areas of STD in the atria can terminate AF in 95% of a cohort of 105 patients with a recurrence rate of 15% within 18 months of follow-up [2]. The STD is a visually recog-nizable electric footprint of AF that guides the interventional cardiologists in ablating persistent AF drivers. Before abla-tion with RF energy, the PentaRay catheter is sequentially positioned in various regions of the right atrium and left atrium (LA) and ten bipoles are simultaneously recorded per location. The PentaRay is a 20-pole high resolution mapping catheter (Biosense Webster Inc, Irvine, CA, USA) shown in Fig. 1. At each location, the catheter is maintained stable for at least 2.5 s. Locations exhibiting a non synchronous cardiac activity observable on a minimum of three contiguous bipoles are said to be dispersion points and are tagged for ablation. Hence, this is a fully patient-tailored process. It is claimed that the presence of an underlying source of AF is recognizable through the fractionation occurring in a non simultaneous fashion at neighboring electrode locations (time dispersion) and organized in well-defined clusters (spatial dispersion), as illustrated in Fig. 2. However, the identifica-tion of STD areas is performed visually by the cardiologist, which is prone to errors and lack of reproducibility. To overcome these drawbacks, the present work aims at an automatic identification of STD EGMs by means of ML techniques while handling the highly imbalanced dataset issue.
III. METHODOLOGY: EGM CLASSIFICATION
A. Study Dataset
Data are acquired at the Cardiology Department of Nice University Hospital Center (CHU). Data acquisition consists
Fig. 1: PentaRay multi-spline catheter (BioSense Webster Inc).
Fig. 2: Dispersion areas are defined and delineated via a mapping approach [2]. Channels A 1-2, A 3-4, B 5-6, B 7-8,C 9-10 and C 11-12 display STD contrarily to the remaining ones.
in several steps: 1) selection of persistent AF patients ablated for STD and mapped with PentaRay from the hospital database; 2) exporting cardiac data, including EGM, electro-cardiogram (ECG), dispersion points and annotations from BioSense CARTO system; 3) decompressing, anonymizing and preparing data (maps/signals) of interest. The learning set includes a cohort of 100 patients ablated in Nice CHU. At the time of writing this contribution, the study had exported the CARTO data of 16 patients and currently focuses on the analysis of their left atria (LA) mapping. EGMs presenting spatiotemporal dispersion according to the cardiologist are annotated as “STD”, while other labels are merged into the “non-STD” class.
B. Classification Model
For each cartography of each patient, 10 EGM bipoles are recorded per location (anatomical point inside the heart) with the PentaRay catheter. Each recorded EGM spans 2.5 s sampled at 1000 Hz and data can then be stored in a 10 × 2500 matrix which can be considered as an image. We suggest to classify these images via the following ML tools: 1) LeNet-STD, a CNN inspired by the state of the art LeNet5 architecture [7]; 2) MLR implemented as a fully connected neural network with a sigmoid activation function.
Multiple CNN architectures are used in biomedical data analysis and mainly ECG classification [8]. CNN captures automatically, with its deepest convolutional filters, charac-teristic features from the input images to make the classifica-tion decision. For this reason, we propose to consider EGM matrices as images and classify them using a LeNet5-based CNN [7] [3], which is a good reference in
computationally-affordable CNN models. In addition, logistic regression is a frequent choice in many medical data classification tasks [9], and is hence used here as a reference.
The ML model is trained to recognize dispersion patterns in contiguous electrodes and apply the rule to unseen data. A natural choice for the input convolutional filter size is 4 × α1 AFCL (α1 ≥ 1 ∈ Q), where AFCL is the
cycle length of AF. We opt for α1 = 32 in order to capture
the cardiac activation along one and a half AFCL. Indeed, dispersion is observable on a minimum of three electrodes positioned on two contiguous PentaRay branches and the average AFCL is typically 200 ms. For each sample, the first two channels (rows in terms of matrix representation) are replicated at the end of the sample, thus forming a 12×2500 matrix. This replication aims at mimicking the circularity of PentaRay branches and ensures that the neighborhood information between the first bipoles (A 1-2 and A 3-4) and the last ones (E 17-18 and E 19-20) is captured as shown in Fig. 1. We call it circularity transformation.
The metrics used for evaluating the models classification performance are the following; 1) binary cross-entropy; 2) area under the ROC curve (AUC): 3) sensitivity (true positive rate), measuring the proportion of actual STDs that are correctly identified as such; 4) specificity (true negative rate), measuring the proportion of actual non-STDs that are correctly identified as such. The LeNet-STD and MLR neural networks are trained with a mini-batch gradient descent optimizer. The early stopping criteria used for training is the validation AUC for a patience of 5 epochs.
C. Classification With Data Augmentation
As a first attempt, we train the classification models using the imbalanced dataset and we obtain a validation, train and test accuracy of 95% for LeNet-STD and MLR as shown in Fig. 3 (“no-DA” plots). However, accuracy alone is not enough to evaluate the classification performance, since the values of sensitivity and specificity are highly imbalanced. The networks classify properly the majority class (non-STD) with a very high specificity equal to 98% using LeNet-STD but fails to identify the minority STD samples yielding a low sensitivity of 50%. This problem is due to the uneven class balance and the lack of a sufficient number of STD samples needed for a fair learning process. One of the ways of dealing with this issue is applying DA methods that are adapted to the medical question and that are approved by cardiologists. Data augmentation [10], [11] consists in synthesizing new samples belonging to the minority class by applying transformations to its original samples. We propose the following techniques: 1) Undersampling: forming a balanced sub-dataset by keeping all STD samples and selecting randomly as many non-STD samples while discarding the rest [11]. This is actually a data reduction technique.
2) Oversampling: forming a balanced super-dataset by replicating randomly STD samples until they reach the number of non-STD ones [11].
3) Lead shift: recursively rotating the EGM channels so that each sample results into 9 new samples. Regarding the
circularity of the PentaRay branches, we consider the 10 channel version of EGMs and roll (cyclic shift) each one into 9 new versions. Finally, the circularity procedure is applied to the synthetic matrix as in Sec. III-B.
4) Time reversing: doubling the number STD samples by flipping along temporal dimension each sample from the end to the beginning, as if time inverting the heart beating mechanism. This operation is not expected to harm the STD identification process since the STD pattern is conserved, as if the propagation pattern traveled in the opposite direc-tion [11].
5) Time shift: truncating STD images of size 12×2500 in time dimension to form a sub-image of size 12×2250. The truncation limits are shifted each time by 25 samples, that is about 10% of typical AFCL values. As a result, each original STD image results into 10 synthetic samples.
The original dataset samples are split into 70% for train-ing, 15% for validation and 15% for test sets. Then, DA is only applied to training samples. The test and validation sets should be untouched to preserve the original data distribu-tion. In case of time shifting, only the dimensions of the test and validation samples are reduced to 12×2250 to be coherent with the training sample dimensions.
Implementation: We conduct these ML learning experi-ments using Python 3.6.8 programming language, Tensorflow 2.0 deep learning library for GPU and Keras API within Docker environment, running on nVidia GeForce 930 MX GPU and Ubuntu 16.4 operating system.
IV. RESULTS
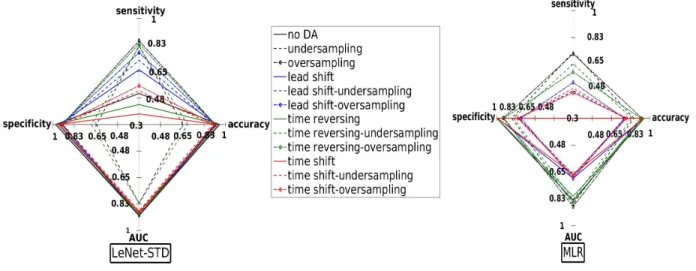
We benchmark the performances of LeNet-STD and MLR classifiers using different combinations of DA methods. The classifier is first trained on imbalanced dataset (no DA) then on augmented datasets. Combinations of DA techniques are also assessed as listed in Fig. 3. For instance, “lead shift-oversampling” refers to augmenting the training set (X) with lead shift to obtain a larger set (X1) then augmenting X1
with oversampling (X2), the model is then trained on X2.
The class imbalance ratio refers to the number of STD over non-STD samples (Tab. I). Using a DA method followed by undersampling aims at augmenting the number of STD samples before downsampling the non-STD class.
We notice from LeNet-STD results in Fig. 3 that the sensitivity increases from 50% to 80% with oversampling, undersampling, lead shift-oversampling, time reversing-undersampling and time reversing-oversampling while main-taining a high AUC (80%). The accuracy and specificity values are maintained at 90% except for undersampling and time reversing-undersampling where it decreases to 70%. Time shift does not enhance the sensitivity even when combined with oversampling and undersampling. The overall performance of the CNN is significantly better than that of MLR, especially in terms of sensitivity and AUC. The classification performance with time shift is poor with a sensitivity not exeeding 55% with both LeNet-STD and MLR. This DA method seemed to hide STD information needed for an accurate training.
Fig. 3: Classification performance on the test dataset.
Bootstrapping statistical tool is used to quantify the un-certainty of each trained classifier. First, 100 subdatasets of 300 samples (about 10% of the test set) are selected at random with replacement. Second, the model performance is calculated for each subdataset then the metrics are averaged. We notice that the means coincide perfectly with the metrics of the original test set and that the standard deviation is zero, showing the robustness of the trained classifiers.
TABLE I: Class imbalance ratio (CIR) calculated for the training datasets. DA CIR % no DA 5 undersampling or oversampling 100 lead shift 51 time reversing 10 time shift 56
V. CONCLUSIONS ANDPERSPECTIVES
The classification of multichannel EGM recordings allows the identification of STD bipoles, thus recognizing atrial areas potentially driving persistent AF to be targeted in ablation with a high degree of accuracy. ML approaches are used for classification combined with a set of DA methods in order to handle the issues of high dataset imbalance and insufficient amount of STD samples. Among the DA techniques proposed, oversampling performs well whether considered alone or combined with lead shift or time revers-ing. With LeNet-STD, the sensitivity increases from 50% to 80% while maintaining high AUC and accuracy values at 90% and slightly decreasing the specificity. The overall performance of LeNet-STD is better than that of MLR which can be explained by the expressive power of CNNs, the most successful deep learning architectures, added to the fact that the training dataset is large and needs a large model in order to be correctly classified. Bootstrapping showed that the trained classifiers are robust with respect to the test dataset. The benchmarking of DA methods can be extrapo-lated to further biomedical signal classification problems like
electrocardiograms and electroencephalograms. In order to enhance the convergence of these classifiers, further training algorithms, parameterizations and regularizations should be addressed. Future work will also investigate deeper and wider neural network architectures as larger networks can handle better the huge augmented dataset.
ACKNOWLEDGMENT
This work is partly funded by the French government PIA program, IDEX UCAJEDI project (ANR-15-IDEX-0001).
REFERENCES
[1] C. T. January, L. S. Wann, J. S. Alpert, H. Calkins, J. E. Cigarroa, J. C. Cleveland, J. B. Conti, P. T. Ellinor, M. D. Ezekowitz, M. E. Field, et al. “2014 AHA/ACC/HRS guideline for the management of patients with atrial fibrillation: a report of the American College of Cardiology / American Heart Association Task Force on Practice Guidelines and the Heart Rhythm Society,” Journal of the American College of Cardiology, 64(21), 2014.
[2] J. Seitz, C. Bars, G. Thodore, S. Beurtheret, Nicolas N. Lellouche, M. Bremondy, A. Ferracci, J. Faure, G. Penaranda, M. Yamazaki, et al. “AF ablation guided by spatiotemporal electrogram dispersion without pulmonary vein isolation: a wholly patient-tailored approach,” Journal of the American College of Cardiology, 69(3), pp. 303–321, 2017. [3] I. Goodfellow, Y. Bengio, and A. Courville. Deep Learning, MIT Press,
Chap. 8. 2016. www.deeplearningbook.org.
[4] R. W. Johnson. “An Introduction to the Bootstrap,” Teaching Statistics 23(2), p. 49, 2001.
[5] J. Malmivuo and R. Plonsey. Bioelectromagnetism: Principles and Applications of Bioelectric and Biomagnetic Fields, Oxford University Press, USA, 1995.
[6] A. Verma, et al. “Approaches to catheter ablation for persistent atrial fibrillation,” New England Journal of Medicine 372(19), pp. 1812– 1822, 2015.
[7] Y. LeCun, L. Bottou, Y. Bengio, P. Haffner, et al. “Gradient-based learning applied to document recognition,” Proceedings of the IEEE, 86(11), pp. 2278–2324, 1998.
[8] B. Pyakillya, N. Kazachenko, and N. Mikhailovsky. “Deep learning for ECG classification,” Journal of Physics: Conference Series, 913(1), IOP Publishing, 2017.
[9] S. Dreiseitl, O. M. Lucila. “Logistic regression and artificial neural network classification models: a methodology review,” Journal of Biomedical Informatics 35(5-6), pp. 352–359, 2002.
[10] M. Agnieszka and M. Grochowski, “Data augmentation for improving deep learning in image classification problem.” 2018 International Interdisciplinary PhD Workshop, IEEE, 2018.
[11] C. Shorten and L. K. Taghi. “A survey on image data augmentation for deep learning.” Journal of Big Data 6(1), p. 60, 2019.
![Fig. 2: Dispersion areas are defined and delineated via a mapping approach [2]. Channels A 1-2, A 3-4, B 5-6, B 7-8,C 9-10 and C 11-12 display STD contrarily to the remaining ones.](https://thumb-eu.123doks.com/thumbv2/123doknet/13430811.408842/3.918.473.851.224.422/dispersion-defined-delineated-mapping-approach-channels-contrarily-remaining.webp)