HAL Id: hal-03038341
https://hal.archives-ouvertes.fr/hal-03038341
Submitted on 3 Dec 2020HAL is a multi-disciplinary open access archive for the deposit and dissemination of sci-entific research documents, whether they are pub-lished or not. The documents may come from teaching and research institutions in France or abroad, or from public or private research centers.
L’archive ouverte pluridisciplinaire HAL, est destinée au dépôt et à la diffusion de documents scientifiques de niveau recherche, publiés ou non, émanant des établissements d’enseignement et de recherche français ou étrangers, des laboratoires publics ou privés.
Endosomal Confinement of Gold Nanospheres,
Nanorods, and Nanoraspberries Governs Their
Photothermal Identity and Is Beneficial for Cancer Cell
Therapy
Anouchka Sangnier, Aurore van de Walle, Romain Aufaure, Magali Fradet,
Laurence Motte, Erwann Guénin, Yoann Lalatonne, Claire Wilhelm
To cite this version:
Anouchka Sangnier, Aurore van de Walle, Romain Aufaure, Magali Fradet, Laurence Motte, et al.. Endosomal Confinement of Gold Nanospheres, Nanorods, and Nanoraspberries Governs Their Pho-tothermal Identity and Is Beneficial for Cancer Cell Therapy. Advanced Biosystems, Wiley-VCH, 2020, 4 (4), pp.1900284. �10.1002/adbi.201900284�. �hal-03038341�
1
Endosomal confinement of gold nanospheres, nanorods and nanoraspberries governs their photothermal identity and is beneficial for cancer cells therapy
Anouchka Plan Sangnier, Aurore Van de Walle, Romain Aufaure, Magali Fradet, Laurence Motte, Erwann Guenin, Yoann Lalatonne*, Claire Wilhelm*
A. Plan Sangnier, A. Van de Walle, C. Wilhelm. Laboratoire Matière et Systèmes, Complexes MSC, UMR 7057, CNRS & University Paris Diderot, 75205, Paris Cedex 13, France.
E-mail: claire.wilhelm@univ-paris-diderot.fr
A. Plan Sangnier, R. Aufaure, L. Motte, Y. Lalatonne. Inserm, U1148, Laboratory for Vascular Translational Science, Université Paris 13, Sorbonne Paris Cité, F-93017 Bobigny, France.
M. Fradet. ImagoSeine, Cytometry Facility, Institut Jacques Monod, CNRS UMR 7592, Université de Paris, 75205, Cedex 13, Paris, France.
E. Guenin. Sorbonne Universités, Université de Technologie de Compiègne, Integrated Transformations of Renewable Matter Laboratory (EA TIMR 4297 UTC-ESCOM), Compiègne, France.
Y. Lalatonne. Services de Biochimie et Médecine Nucléaire, Hôpital Avicenne Assistance Publique-Hôpitaux de Paris F-93009 Bobigny, France.
E-mail : yoann.lalatonne@aphp.fr
Keywords: gold nanoparticles, cell uptake, endosomes, photothermal therapy, cancer cells
Abstract. Gold nanoparticles can act as photothermal agents to generate local tumor heating
and subsequent depletion upon laser exposure. Herein, photothermal heating of four gold nanoparticles and resulting induced cancer cell death are systematically assessed, within extra- or intra-cellular localizations. Two state-of-the-art gold nanorods are compared with small nanospheres (single-core) and nanoraspberries (multi-core). Heat generation is measured in water dispersion and in cancer cells, using lasers at wavelengths of 680 nm, 808 nm and 1064 nm, covering the entire range used in photothermal therapy, defined as near infra-red first (NIR-I) and second (NIR-II) windows, with NIR-II offering more tissue penetration. When dispersed in water, gold nanospheres provide no significant heating, gold nanorods are efficient in NIR-I, and only gold nanoraspberries are still heating in NIR-II. However, in cells, due to endosomal confinement, all nanoparticles present an absorption red-shift translating visible and NIR-I absorbing nanoparticles into effective NIR-I and NIR-II nanoheaters, respectively. Gold nanorods then become competitive with the multicore nanoparticles (nanoraspberries) in NIR-II. Similarly, once in cells, gold nanospheres can be envisaged for NIR-I heating. Remarkably, nanoraspberries are efficient nanoheaters whatever the laser applied and the extra- versus intra- cellular localization demonstrating treatment versatility.
2
1. Introduction
Due to their unique plasmonic properties and their low toxicity,[1–3] gold nanoparticles have
been used for multiple biomedical applications such as biological sensing,[4–7] drug
delivery,[8–10] cellular imaging[11,12] or photothermal cancer therapy.[1,13–21] For long,
laser-mediated heating was not considered as a potential modality for tumor treatment, firstly because light was not specifically absorbed by cancerous tissues, leading to unavoidable side effects on surrounding healthy tissues, and secondly because biological tissues present a strong extinction coefficient in the visible range, limiting the treatment to superficial or optical fibre reachable tumors.[22,23] The use of gold nanoparticles as thermal enhancers has
addressed both issues. First, they are able to accumulate within tumors, either by active or passive targeting.[24–26] Then, they can be activated by a laser, allowing sufficient heat
generation at low laser powers to induce irreversible cell damages by denaturing proteins and disrupting cell membranes directly within the tumor, minimizing side effects.[23] The on-going
challenge has then been to design nanoparticles that absorb at wavelengths within the biological windows, defined as ranges in which the absorbance is minimal for biological tissues[27]. That way, the heating is specific to the nanoparticles leading to localized
therapeutic efficacy with minimal side effects. Moreover, it improves laser penetration within the body allowing to reach deeper tumors even though the maximal optical penetration depth is estimated to few centimeters.[28] Biological windows are located in the near infrared (NIR)
region and range from 650 to 980 nm for the first one (NIR-I), and from 1000 to 1400 nm for the second one (NIR-II).[22] In practice, NIR-I is less optimal due to limited tissue penetration
depth lower than 2 cm.[29] NIR-II is recognized to offer more efficient tissue penetration when
considering absorption and scattering effects in tissue.[30–33] To modulate the plasmonic
resonance to the NIR, anisotropic gold nanoparticles such as nanorods, nanostars and nanoshells have been proposed and experimented for cancer thermotherapy.[34–36] However
3
photothermal agents within NIR-II are still rare;[37–39] among them, multicore gold
nanoparticles were recently described as very effective NIR-II nanoheaters.[40,41]
As the final goal of photothermal therapy (PTT) is to destroy cancer cells, nanoparticles need to be delivered at the cellular level, within malignant cells, their ultimate target. While the cellular internalization of nanoparticles depends directly on their specific features including shape and surface charge,[42,43] the endosomal confinement resulting from this internalization
could have an immediate effect on their specific functions. Herein, the goal is to understand the influence of intracellular processing and endosomal confinement of gold nanoparticles on their heating efficiencies. Indeed, when gold nanoparticles are in close proximity (less than 0.5 nm apart), a plasmonic coupling occurs, leading to a red-shift of the surface plasmon[44,45]
as previously evidenced both theoretically and experimentally.[45] As a consequence, the
cellular uptake of gold nanoparticles and further aggregation within the endosomes[46] could
result in shifting the absorbance towards infrared wavelengths.[44,45,47]
We selected a panel of four gold nanoparticles in order to assess their nano-therapeutic potency in situ, in the cellular target environment, by means of heat generation. First, small gold nanospheres were assessed that are advantageous for their simplicity and small size (10-nm range), but their plasmon is located in the visible range, therefore they are generally not preferred for photothermal therapy. Gold nanorods with narrow plasmons at 680 and 808 nm were then chosen as state-of-the-art photothermal gold nanoparticles.[48] Finally, gold
nanoraspberries were produced, of size small enough (25-nm range), with the advantage of covering both the first and second NIR windows.[41] To assess the impact of cellular
internalization on the nanoparticle thermal efficiency, both absorption spectra and heat generation were measured after internalization in cancer cells and compared with measurements in aqueous dispersion, under the same settings. Next step has then been to quantify therapeutic efficiency in terms of induced cancer cell death. Overall, all results converge towards a dramatic change of the gold nanoparticle photothermal fingerprints in
4
cells, which can be highly beneficial for the ones initially absorbing only in the visible region, but harmful for other with initial narrow plasmon band within the NIR-I window.
2. Results
2.1. Structure and absorbance of a panel of four gold nanoparticles
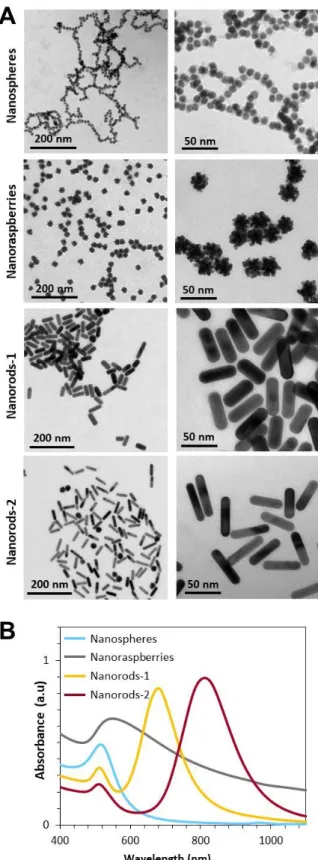
Transmission electron microscopy (TEM) images of all nanoparticles, nanospheres, nanorods and nanoraspberries, are shown in Figure 1A. Nanospheres are single-core nanoparticles composed of a spherical core measuring 9.3±0.6 nm in diameter. Gold nanoraspberries were produced by growing gold over one of these single-core nanoparticles, leading to a multi-core structure with diameter 25±3 nm range.[41] The dimensions (length x diameter) of the two gold
nanorods measure 48±5 nm x 16±1 nm (called nanorods-1) and 53±6 nm x 11±1 nm (called nanorods-2).
The nanospheres, nanorods-1 and nanorods-2 all exhibit a narrow plasmon resonance peak as observed on the absorbance spectra of Figure 1B, with a maximum at 520, 680 and 800 nm, respectively. By contrast, the nanoraspberries exhibit a much larger absorbance, covering both NIR-I and NIR-II regions, with a maximum at 550 nm. These spectra correspond to aqueous dispersions of the nanoparticles, further called “in water” conditions.
2.2. Internalization in cancer cells
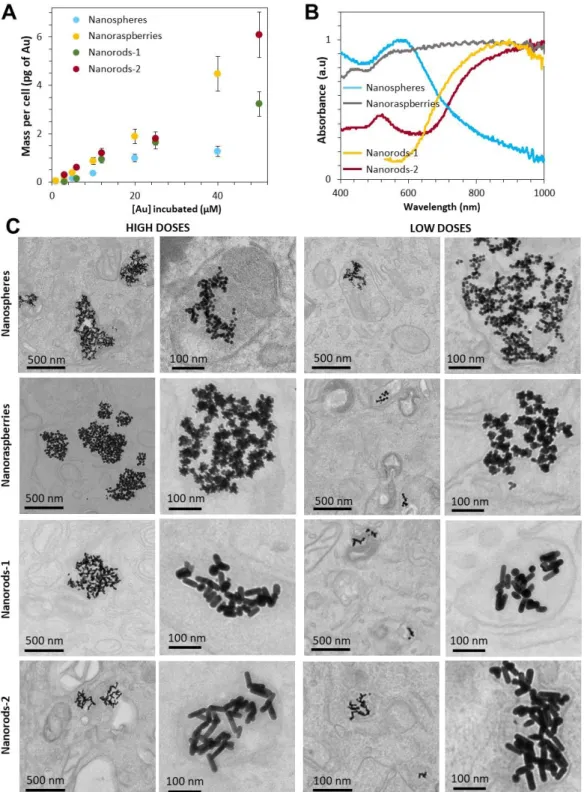
The nanoparticles were then internalized in cancer cells, by supplementing the culture medium with nanoparticles at varying incubation concentrations. The uptake and the resulting dose of nanoparticles internalized in the cells is strongly correlated to this extracellular concentration as shown in Figure 2A. For concentrations of gold between 1 µM and 50 µM, the resulting intracellular dose of gold lies between 0.1 and 6 pg per cell. The absorbance spectra of the cells loaded with nanoparticles (for the high cellular dose of nanoparticles of 2-6 pgAu per cell) were then measured as shown in Figure 2B (condition further called “in
5
predicting an impact on the thermal efficiency. Figure 2C shows TEM images of cancer cells following internalization of the gold nanoparticles, for low (0.1-0.4 pgAu/cell) and high (2-6
pgAu/cell) doses of nanoparticles. All nanoparticles are confined within cellular endosomes
and, in all situations, they are found in close proximity to one another.
2.3. Photothermal heating in cells differs from heating in water
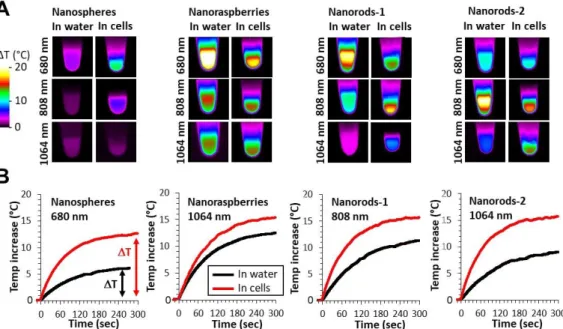
Figure 3A shows typical IR camera images (Figure S1 describes the set-up) of the samples containing nanoparticles and exposed for 5 min to the three lasers at 0.3 W/cm² covering both the NIR-I and the NIR-II windows (680, 808 and 1064 nm). Nanoparticles are either in aqueous dispersion (in water) or internalized within cells (in cells), for both at a resulting gold concentration of [Au]=0.5 mM. Figure 3B shows most typical temperature curves extracted from the IR camera recording, from the moment the laser is turned on. After a few minutes, a plateau temperature is reached, the value of this plateau being next described as T. For the specific laser exposure selected in this Figure 3B, striking differences of heating efficiency are observed when comparing the nanoparticles in water and in cells, with cell confinement systematically beneficial to the heating. All conditions (three lasers always at 0.3 W/cm², four nanoparticles, and two situations in water and in cells) are further detailed in Figure 4 where data are displayed as T. For aqueous dispersion (in water situation), the nanoparticles were diluted at gold concentrations ranging from [Au] = 0.125 mM to [Au] = 2 mM. This range was selected to reach the window where a therapeutic heating can be achieved. It corresponds also to the concentration range that can be further obtained on a tumor mass having internalized gold nanoparticles within the component cells. It is important first to emphasize that all differences in heating efficiency are mostly detected at low doses, which is the windows of applicability of photothermal therapy. Indeed, at high concentrations ΔT saturates around 20°C whatever the laser wavelength; increasing further the nanoparticle concentration is thus not beneficial for heat generation. We can understand this saturation of temperature
6
observed at high concentrations for all samples by writing the heat to light conversion equation as follows:
ΔT = 𝑃0..(1−10−𝐴).ɳ
𝑚.𝐶.𝐵 (1)
with ΔT = the temperature increase (at plateau), P0 the incident power brought by the incident
laser, A the absorbance of the sample, ɳ the light-to-heat conversion coefficient parameter, m the mass of the sample assimilated to the one of water, C the specific heat capacity of the sample approximated to the one of water (4185 J/g/K), and B the constant rate of heat dissipation. At high concentrations, 10-A becomes negligible, and 𝑃0..(1−10−𝐴)
𝑚.𝐶.𝐵 is almost
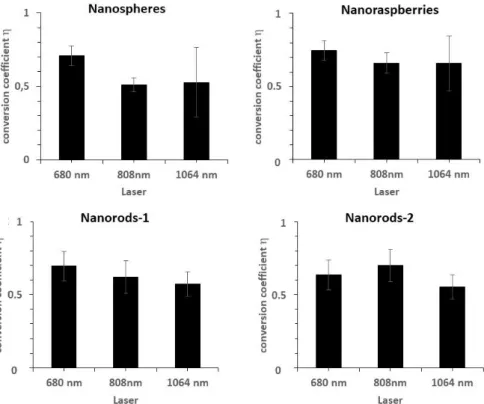
constant. As a consequence, ΔT becomes directly proportional to ɳ. This light-to-heat conversion coefficient ɳ can be calculated from experimental heating curves (see experimental section for calculation details). Figure S2 reports the ɳ values measured at the three wavelengths, for all nanoparticles. It was found in the range of 65 %, with no major differences between the nanoparticles or laser applied. This could be intriguing as clearly they do not have the same capacity for heat generation, but in fact η does not precisely account for the efficiency of an object to convert incident power into heat, but rather denotes the ratio of the power converted into heat to the total power lost in the specular direction of the incident light when interacting with the object. The fact that both nanorods exhibit same η is first due to their similar shape. For the nanoraspberries, it demonstrates that they are equally efficient to the nanorods, and for the nanospheres, similar high values are probably due to lower scattering. As ɳ is similar, it is expected that the saturation corresponds to same range (around 20 °C, for 0.3 W/cm² laser power density) of temperature increase, reached at high concentration. The expected (calculated) plateau temperature values are shown in Figure S3 for all conditions. It evidences the fact that all the studied nanoparticles reach eventually the same maximal temperature (of about 20 °C) and that the only differences are coming from the gold concentration necessary to reach this maximal temperature increase. This concentration
7
is directly imposed by the nanoparticles absorbance: the highest their absorbance, the smallest the concentrations will be required to reach the maximal temperature. Nevertheless, for single-core small nanospheres, the theoretical maximum temperature would be reached at [Au] = 10 mM for the 680 nm laser, and at about 25 and 80 mM for the 808 and 1064 nm lasers, respectively, concentrations which are far from being clinically relevant. By contrast, the maximum value of ΔT ~ 20°C is reached at a concentration as low as [Au] = 0.5 mM for the three other nanoparticles, with the 680 nm laser for the nanoraspberries and the nanorods-1, and with the 808 nm laser for the nanorods-2.
Important differences in thermal elevations can be observed in water depending on the nanoparticle type and the laser wavelength. In brief, when the nanoparticles are irradiated at 680 nm, nanorods-1 and nanoraspberries exhibit a temperature increase within the same range, with values of 18.6 and 20.3 respectively, almost 2-fold the value of nanorods-2 and 3.5-fold the one of nanospheres. At 808 nm, nanorods-2 provided the highest heating, 1.5 times higher than nanorods-1 and nanoraspberries, and 10 times higher than the nanospheres. Finally, at 1064 nm, the nanoraspberries show the highest heating, with a 1.5 times increase when compared with the nanorods-2, 7 times with the nanorods-1 and 9 times with the nanospheres. Only nanoraspberries were able to generate a temperature increase over 10 °C whatever the laser when in water, and nanospheres remained the less efficient thermal agents for all the three lasers.
To make similar measurements but in the cell environment, all nanoparticles were incubated with cells (prostatic adenocarcinoma PC3) at various extracellular gold concentrations, so that the amount of internalized nanoparticles (in pg of gold per cell) ranges from 0.2 to 6 pg or gold per cell, according to Figure 2A. Cells were then suspended in phosphate saline buffer (PBS), at a density of about 100 million cells per mL, so that the final cell sample concentrations ranged also from [Au] = 0.125 mM to [Au] = 2 mM. Temperature elevation as a function of gold concentration and for all conditions are displayed Figure 4. First, it has to
8
be noted that the maximum temperature reachable found in aqueous solution (ΔTmax ~ 20°C)
remained identical in cells. Then, and as predicted by the red-shift in plasmon absorbance following internalization of the nanoparticles in cells, the cellular confinement impacts the PTT properties of the nanoparticles. In the case of nanoraspberries, heating efficiency in cells was reduced at 680 nm, remained similar at 808 nm and increased at 1064 nm. Additionally, these three lasers led to similar temperature elevation in cells, due to the absorption plateau over the NIR-I and NIR-II regions. In the case of nanospheres, the temperature elevation was higher than in aqueous solutions for all three lasers, especially at 680 nm where they became competitive with nanorods and nanoraspberries. Nanorods-1 exhibited a reduction of their heating efficiency at 680 nm compared to water but an increase for the other two lasers, making them good candidates for PTT even at 1064 nm. Finally, nanorods-2 presented a slight reduction of their heating efficiency at 680 and 808 nm and a small increase at 1064 nm. As a consequence, the intracellular confinement was beneficial to the heating potential of the four studied nanoparticles.
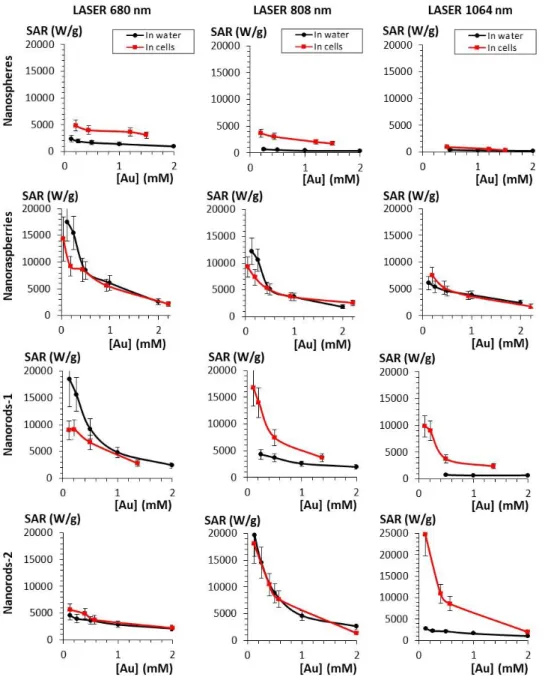
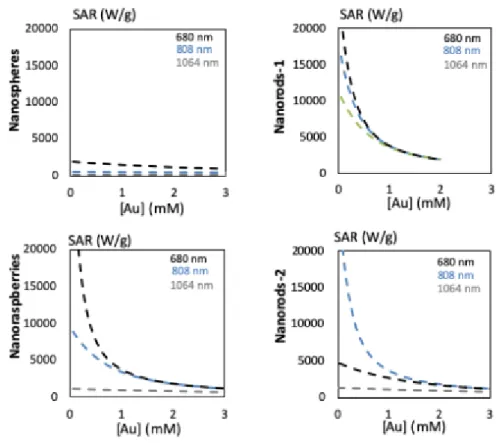
Another way to quantify the heating is with the concentration-normalized specific absorption rate (SAR), which corresponds to the heating capacity of the material expressed in watts per gram of gold. The SAR calculated for all concentrations ranging from 0.125 to 2 mM after exposure to lasers 680, 808 and 1064 for nanospheres, nanoraspberries and nanorods 1 and 2 are reported in Figure 5. Theoretically predicted SAR are shown in Figure S4. The SAR values are logically decreasing with increasing concentration. As expected, nanospheres have the lowest SAR values for all three lasers, but it massively increases after cellular internalization, especially for the 680 nm laser. Nanoraspberries are the most polyvalent, both in water and in cells, with only few variations due to cell internalization, and impressive SAR in the NIR-II. Nanorods are strongly impacted by the cellular confinement, which diminishes the interest of having a strong but very fine plasmon resonance perfectly adjusted to one laser
9
wavelength. Overall, the results demonstrate that cell processing importantly reduces the differences between samples.
2.4. Therapeutic efficiency in cancer cells: extracellular versus intracellular situations
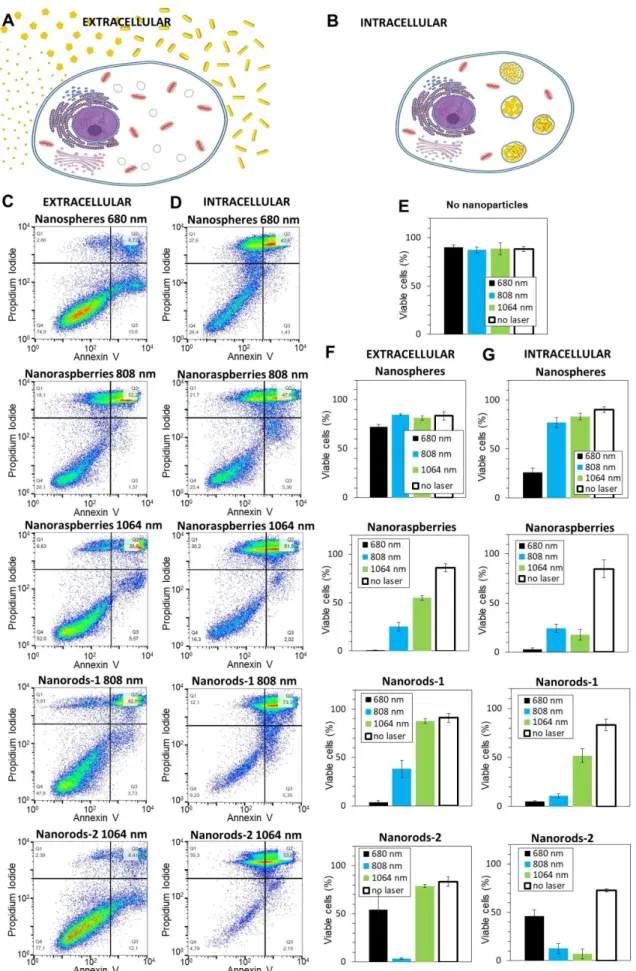
To confirm the therapeutic efficiency of the four selected nanoparticles, PC3 cancer cells were exposed to nanoparticles and treated with PTT for 10 minutes at safe laser power (0.3 W/cm²) with the three lasers at the set wavelengths of 680, 808 and 1064 nm. Cellular survival was assessed 24 hours upon PTT by flow cytometry in order to detect apoptotic and/or necrotic cells. Nanoparticles were either simply kept in the cell culture medium (extracellular condition, Figure 6A), situation close to the aqueous dispersion (in water), or internalized within the cells (intracellular condition, Figure 6B), same situation as the previous heating measurements in cells. For the extracellular condition, cells were detached, compacted on the form of small tumoral masses (100 million cells per mL), and the surrounding culture medium was supplemented with nanoparticles at [Au] = 0.5 mM during the 10 minutes of laser treatment. For the intracellular condition, nanoparticles were first internalized, and the cells nanoparticles-loaded were detached and treated in the form of small tumoral masses (100 million cells per mL). The final gold concentration of the cell sample was also equal to [Au] = 0.5 mM, adjusted through the initial incubation condition and the cell concentration in the pellets. Figures 6C and 6D show typical flow cytometry analyses of the extracellular and intracellular conditions, respectively. Only the conditions with the most striking effect of cell internalization on the therapeutic efficiency of the nanoparticles are displayed. First, the nanospheres (here heated at 680 nm) induce very limited decrease in viability when dispersed outside the cancer cells (76% of cells are still viable, situated in the left-bottom quadrant in the cytometry plot), while once inside the cells, only 26% of the cells remain viable after treatment. Similarly, for the nanorods-1 and nanorods-2 exposed to lasers at 808 and 1064 nm respectively (away from the plasmon peak), the number of viable cells
10
decreases from 38 % and 79 % in the extracellular situation to 11 % and 7 % in the intracellular situation. For the nanoraspberries, at 808 nm the impact of cell internalization is not pronounced (25% and 23 % viable cells before and after internalization), and at 1064 nm, while 52% of cells remained viable for the extracellular situation, it decreased to only 16% after internalization. All conditions are presented in Figure 6E-G, in terms of cells remaining viable after treatment. First, note that no toxicity was induced by laser treatment in the absence of nanoparticles (Figure 6E), confirming the absence of side effects on healthy tissues without nanoparticles within. It is also noticeable that nanoparticles themselves, without laser application, have reduced impact on cell viability, confirming their low toxicity (conditions no laser in Figures 6F and 6G). For all nanoparticles, intracellular confinement was mostly beneficial for therapy, leading to an increase of the cellular death as predicted from temperature elevation curves of Figure 2. Nanospheres only induced mortality in extracellular environment when submitted to the laser 680 (but less than 25 % cell death) and no cell death was reached at 808 and 1064 nm. Nevertheless, after the cellular confinement of nanospheres, more than 75 and 25 % cell death were induced after PTT treatments at 680 and 808 nm respectively. Concerning the nanoraspberries, in extracellular conditions, PTT treatment induced a quasi-complete cell death at 680 nm and was also efficient after treatments at 808 and 1064 nm, with respectively 75 and 50 % of cancer cells death. They become even more promising in cells with a similar efficiency at 680 nm but a higher therapeutic result at 808 and 1064 nm, with more than 75% cell death in both cases. However, because the absorbance of the nanoraspberries is large and covers both the NIR-I and NIR-II windows, they were already very efficient in both windows when extracellular, so that the impact of cell confinement is noticeable mostly for the 1064 nm only. Nanorods-1 were highly efficient at wavelength close from their surface plasmon resonance, with an almost complete cell death after laser treatment at 680 nm both in extracellular and intracellular environment. They were also promising candidates after 808 nm laser treatment by inducing more than 50 % cell death
11
when in the extracellular environment and an almost complete cell death after cellular internalization. In the NIR-II, they only became efficient when confined in cells, and induced 50 % cell death. For nanorods-2, when both extracellular and intracellular, laser treatment had a limited effect at 680 nm but induced a quasi-total cell death at 808 nm, where the absorbance was maximal. At 1064 nm, they induced no mortality of the cancer cells in the extracellular environment, whereas cellular confinement turned them into highly efficient nanoheaters, with an almost complete mortality. Figures S5-S7 finally show the percentage of apoptotic cells only (Figure S5, always below 5-10 %), of necrotic cells only (Figure S6, slightly higher, but never over 15 %), and the percentage of both apoptotic and necrotic cells (Figure S7, most common situation). Whatever the treatment, the cells damaged were found mostly both apoptotic and necrotic. Finally, Figure S8 shows another analysis of the photothermal treatment, by metabolic assay. The results are in agreement with cell death evaluated by flow cytometry, and even more marked, with an effective treatment generally leading to a collapse if not a total inhibition of the cells metabolic activity. Remarkably, the treatment was totally efficient for nanoraspberries, whatever the laser applied, and their cellular localization, demonstrating once again their unprecedented treatment versatility.
3. Discussion
The influence of the biological environment on nanoparticles-mediated thermal therapy has been rarely explored. Nanoparticle efficiencies are generally measured in aqueous dispersion rather than directly in the relevant cellular medium. Yet, it is mandatory to take into account all bio-nano-interactions to develop effective medical nanoparticles. The challenge is then to identify thermal fingerprints of nanoparticles in the cellular environment, and address the question of how the nanoparticles-mediated heating may evolve when tested from the suspension to the cancer cells. Once inside the cells, nanoparticles are confined within endosomes in very close contact with one another, and such confinement is likely to occur in
12
the final therapeutic applications. Notably, for the other well-known magnetic nanoparticles-mediated heating modality, magnetic hyperthermia, the intracellular confinement is already known to dramatically decrease the heat generation.[49–51] In the case of plasmonic heating,
will plasmon resonance, a surface phenomenon, be affected by nanoparticle confinement? Herein, the variety of the four nanoparticles investigated together with the original measurements in water and in cells using the exact same methodology were some major assets to resolve the fundamental question of the impact of nanoparticles endosomal confinement on heat generation. Overall, it appeared that this dense intracellular proximity is beneficial to the heating in the near infrared (NIR). Practically, nanoparticles heating in the visible range became efficient in the NIR first windows (NIR-I, 750-980 nm) after cell internalization, while nanoparticles initially designed for the first NIR-I biological window became efficient in the second window (NIR-II, 1000-1400 nm). This was due to a shift of their plasmons towards the infrared wavelengths. Nanoparticles might thus induce completely different temperature elevations according to their environment, aqueous or cellular, emphasizing the need of in situ cellular measurements of their therapeutic potential.
Nanoparticles-mediated PTT is an emergent and promising cancer treatment, already in clinical trials,[52] with the advantage of an ultra-focal therapy minimizing side effects. It is
known that irreversible damages after exposures comprised between 4 and 6 minutes are induced when the tumor is submitted to a temperature over 48 °C (corresponding to a 11°C temperature elevation).[22] This study clearly evidences all nanoparticles, exposed with laser
power as low as 0.3 W/cm², are able to generate this temperature increase. However, it also shows that the main difference between the selected nanoparticles is not coming from the temperature increase they are able to provide, but rather from the concentration needed to reach it. Indeed, at high concentrations, the heating saturates at similar temperature elevations of about 20 °C. Nanoparticles reaching this maximal temperature increase for the lowest gold concentrations must then be considered best candidates for PTT applications. Indeed, it means
13
smaller quantities will be necessary to induce a therapeutic effect that is beneficial for in vivo use. From the results, this candidate varies depending on the laser wavelength used; maximal heating at lowest concentration is reached with the nanoraspberries and nanorods-1 at 680 nm, and with the nanorods-2 at 808 nm. In this NIR-I window, such maximal temperature is reached for gold concentrations as low as 0.5 mM. In the NIR-II window, none of the nanoparticles attain such heating even for concentrations as high as 2 mM; however, when internalized in cells the heating efficiency increases and the nanoraspberries reach the maximal temperature at 1 mM followed by the nanorods-1 and -2 that approach it around 2 mM. It is also worth noticing, that the nanospheres are the most affected by endosomal confinement, transitioning from very limited heating when in water to competitive with the other designs once in cells. With their small size, they engender a quite spectacular cancer cell death of 75% at 680 nm.
Overall, the nanoraspberries are promising candidates that reach high heating efficiency in both water and upon internalization within cells due to their large plasmon absorbance spectra covering the NIR-I and –II regions. They reach maximal heating (20 °C) when irradiated with the 680 and 808 nm lasers and are the most efficient design at the 1064 nm wavelength. Additionally, when compared to the 25 nm photothermal state-of-the-art gold nanostars, these nanoraspberries have a comparable size as well as a high heating efficiency in the two NIR windows, while the 25 nm nanostars are efficient at the beginning of the NIR-I window.[35]
This NIR-II heating efficiency certainly is an advantage as NIR-II is recognized to offer more efficient tissue penetration when considering absorption and scattering effects in tissue.
4. Conclusion
Herein, we demonstrated that the efficiency of gold nanoparticles for PTT depends on the nanoparticles’ design as well as the inter-nanoparticles interactions. A switch in the heating profile from visible or NIR-I values to the NIR-I or NIR-II windows respectively has clearly
14
been determined when the nanoparticles are internalized in the endosomes of cells, where they are in close proximity to each other. The nanoraspberries revealed as a very versatile antitumoral nanotool since they are less impacted by the cellular internalization due to their large plasmon and their surprising heating efficiency in the two NIR windows.
5. Experimental Section
Gold nanoparticles
Gold nanorods: Two types of gold nanorods differing by their size that results in varying peak
absorbance, being at 680 nm for the nanorods-1 and at 800 nm for the nanorods-2, were purchased from nanoComposix (product number GRCH660 and GRCH800, respectively). The dimensions (length x diameter) specified by the manufacturer of the nanorods-1 are 40 nm ± 15 nm x 15 nm ± 5 nm and the ones of the nanorods-2 are 55 nm ± 18 nm x 15 nm ± 5
nm, these dimensions have here been confirmed via TEM analysis (48±5 nm x 16±1 nm for the nanorods-1 and 53±6 nm x 11±1 nm for the nanorods-2).
Gold nanospheres: The synthesis of the nanospheres consisted in two steps and was adapted
from Aufaure et al.[53] First, HMBPene were produced by mixing 4-pentenoyl chloride (5
mmol) frozen in a roundbottom flask with 5 mL of tris-trimethylsilylphosphite. The mixture was then evaporated under vacuum at 70 °C (0.1 Torr) for 20 minutes and hydrolyzed by adding 20 mL of MeOH during 4h. The solvent was further evaporated and the remaining yellow oil was crystallized at pH 2.3 in a MeOH–H2O 9:1 system. The resulting solid was
finally filtered on Büchner. Second, the single core nanoparticles were synthesised. Briefly, tetrachloroauric acid in water (2.8 mM, V=36 mL) was heated until ebullition. Then HMBPene at pH adjusted to 9.2 (50 mM, V=4 mL) was quickly added and mixed during 10 minutes. Unreacted products are removed with Amicon® Ultra centrifugal filters (30 K). All reagents were purchased from Sigma-Aldrich and Acros Organics.
15
Gold nanoraspberries: The synthesis of the gold nanoraspberries was adapted from Plan
Sangnier et al.[41] The first step consisted in producing HMBP-S-PEG45-COOH. To do so, 3
mL of ω-HS-PEG-carboxylic acid dissolved in dimethylformamide (83 mM) were mixed to 3 mL HMBPene dissolved in water (53 mM). A small amount of 1-hydroxycyclohexylphenyl ketone dissolved in dimethylformamide was then added to the mixture, the vial was sealed, and the mixture was stirred during 5 hours under UV light. Ultrapure water (8 mL) was added and the resulting solution was washed 3 times with dichloromethane and diethyl ether. All solvents were degassed prior use. The second step was the production of the nanoraspberries; 63 µL of tetrachloroauric acid (20 mM) were added to 2.5 mL of HMBP-S-PEG45-COOH in
water adjusted at pH=4 (2.1 mM) and manually homogenized. When the mixture became light yellow, 19 µl of ascorbic acid (100 mM) were added. Finally, 30 µl of single-core NPs (0.65 mM) was added and manually homogenized. Unreacted products were removed with Amicon® Ultra centrifugal filters (100 KDa). All reagents were purchased from Sigma-Aldrich and Acros Organics.
ICP analysis
Gold concentration in the aqueous samples and in the cells was determined by elemental analysis using Inductively Couple Plasma Atomic Emission Spectrometry (ICP-AES) (iCAP6200 duo THERMOFISHER). First, samples were digested in aqua regia (5 mL), then the acid solution was evaporated. Finally, they were solubilized in a 1% HCl solution for the analysis.
TEM in water
Diluted suspensions of gold nanoparticles were dropped onto copper grids covered by a carbon film. Grids were observed with a Philips Tecnai 12 transmission electron microscope.
16
UV-vis spectra were recorded on a Varian Cary 50 Scan UV-vis spectrophotometer. Gold solutions (0.1 M) were prepared by dissolving nanoparticles in water.
Photothermia in water
Aqueous measurements were made in 1.5 mL Eppendorf tubes containing 100 µl of nanoparticles solubilized in water. Concentrations were ranging from [Au] = 0.125 mM to [Au] = 2 mM. Each sample was illuminated with a 680 nm laser (Laser Components S.A.S France) positioned 4.5 cm above at 0.3 W/cm² (0.6 A), a laser 808 nm (Laser Components S.A.S France) positioned 4.5 cm above at 0.3 W/cm² (1.82 A) and a laser 1064 nm (Laser Components S.A.S France) positioned 4.5 cm above at 0.3 W/cm² (0.33 A). Temperature elevation was recorded with an infrared thermal imaging camera (FLIR SC7000) in real time and processed with the ALTAIR software. Heating was quantified both with the plateau temperature reached after 5 minutes of laser treatment and the specific absorption rate (SAR), meaning the power dissipated per unit mass of gold (W.g −1). SAR was determined using the
following equation:
𝑆𝐴𝑅 = 𝐶.𝑚𝑠
𝑚𝐴𝑢.
𝑑𝑇
𝑑𝑡 (2)
with C is the specific heat capacity of the sample (Cwater = 4.185 J/g/K), mAu is the total mass
of gold in the sample (g), ms is the total mass of the sample (g) and dT/dt is the temperature
increase at the initial linear slope (30 s).
Cell culture and nanoparticle internalization
Human prostate cancer (PC3) cells were purchased from ATCC and cultured in Dulbecco’s modified Eagle’s medium (DMEM) supplemented with 10% fetal bovine serum (FBS) and 1% penicillin-streptomycin (PS) at 37°C with 5% CO2 until they reach 90% confluence. Gold
nanoparticles were dispersed in RPMI-1640 medium. Cells were then incubated with 30 minutes with the nanospheres or 24 hours with the nanoraspberries, 1 and nanorods-2. The incubation concentrations were ranging from 1.5 to 25 µM for the nanospheres and the
17
nanoraspberries. For the nanorods-1 and -2, they were ranging from 3 to 50 µM. Cells were then washed twice with RPMI-1640 medium then left 2 hours in PS and FBS supplemented DMEM for a chase period.
Photothermia in cells
A T75 flask was prepared for each condition. PC3 cells were incubated with gold nanoparticles in order to get a panel of concentrations ranging from 0.2 to 4.4 pg/cell. Cells were detached, washed with cacodylate buffer, fixed with 2% glutaraldehyde in 0.1 M cacodylate and suspended in 40 µl in order to get solutions with concentration comprised between 0.125 and 2 mM. If the cells were used for viability assessment, they were covered with a sterile cover-slip (not fixed). Each sample was illuminated with lasers 680, 808 and 1064 nm positioned 4.5 cm above and set at 0.3 W/cm². PTT measurements were made in 1.5 mL Eppendorf tubes. The temperature was recorded with an infrared thermal imaging camera (FLIR SC7000) in real time and was processed with ALTAIR software. Heating was characterized as in water with the plateau temperature after 5 minutes of heating and the SAR.
Flow cytometry
Effect of PTT on the cells when nanoparticles are only in the media (extracellular condition) or when they are internalized within the cells (intracellular condition) was assessed via flow cytometry. For the extracellular condition, cells (not labelled with nanoparticles) were detached, resuspended in 1.5 ml Eppendorf tubes and centrifuged such as forming small tumoral masses (100 million cells per mL). The surrounding culture medium was then supplemented with nanoparticles during the 10 minutes of laser treatment only, at a concentration of [Au] = 0.5 mM. For the intracellular condition, nanoparticles were first internalized in the cells via a 30 minutes incubation for the nanospheres and 24 hours incubation for the nanorods and nanoraspberries followed by 2 hours chase. The cells loaded with nanoparticles were then detached and centrifuged such as forming small tumoral masses similarly to the extracellular condition (100 million cells per mL) and the final gold
18
concentration of the cell sample was also equal to [Au] = 0.5 mM, adjusted through the initial incubation condition and the cell concentration in the pellets. The small tumoral masses were then exposed to PTT for 10 minutes and directly after laser treatment, cells were seeded into 6 wells plates. 24 hours later, they were labeled with APC Annexin V Apoptosis Detection Kit with Propidium Iodide from Biolegend. They were detached, washed twice with PBS and suspended in 100 µl Annexin V binding buffer. 5 µl of Annexin V and 10 %l of propidium iodide were added. Cells were analyzed with a Cyan ADP 9C flow cytometer (Beckman Coulter, Imagoseine platform, Institute Jacques Monod, Paris). Each analysis is based on a minimum of 50,000 events. Each condition corresponds to three analyses on three independent cell samples.
TEM in cells
For TEM imaging of cellular samples, cells were detached after nanoparticle incubation, washed with cacodylate buffer, fixed with 2% glutaraldehyde in 0.1M cacodylate buffer. Oolong tea extract (0.5%) in cacodylate buffer was used to contrast the cells that were then post fixed with 1% osmium tetroxide. Finally, they were included in Epon after dehydration and ultrasectioned (70 nm). Sections were deposited onto cooper grids for observation with a Hitachi HT7700 electron microscope operated at 80 kV (Elexience – France), and images were acquired with a chargecoupled device camera (AMT). This work has benefited from the facilities and expertise of MIMA2 MET – GABI, INRA, Agroparistech, 78,352 Jouy-en-Josas, France.
UV-visible spectra in cells
Cells were cultured on 0.5 mm diameter glass coverslips. Culture medium was supplemented with the nanoparticles at highest gold concentrations of 50 µM. After incubation, cells were washed with DMEM supplemented with 10 % SVF and 1 % PS then 6 glass coverslips were overlaid in 96-well plates and the spectra were measured with an EnSpire Multimode Plate
19
Reader Perkin Elmer. Baseline corresponding to the absorbance of cells cultured in the same conditions and not loaded with nanoparticles was removed from all measurements.
Theoretical calculation of the light-to-heat conversion coefficient, ΔT and SAR
The light-to-heat conversion coefficient was calculated as previously described in the literature.[54]
η =∆T∗mW∗Cw∗B
P0−P0 10A
(3)
With ɳ the light-to-heat conversion efficiency coefficient, mW the mass of the sample
approximed to the mass of water, Cw the specific heat capacity of water, P0 the incident laser
power and A the absorbance of the sample. B is the constant rate of heat dissipation to the external environment and is given by the decreasing temperature profile when the laser is turned off:
B =−1
t . ln ( T(t)−T0
Tm−T0) (4)
Considering ɳ and B constant (experimentally calculated equal to 65 % and 9.7.10-3 s-1) a fitting of the temperature increase is possible thanks to the equation (1). SAR can also be fitted:[50] ∆T = η ∗ P0− P0 10A mW∗Cw∗B (5) SAR = 1 mFe. P0. (1 − 10 −A).ɳ (6) Statistical Analysis
All values are presented as mean ± standard error of the mean (SEM) and the number of independent measurements was systematically superior to 3 (n > 3).
Supporting Information
20
Acknowledgements
This work was supported by the Sorbonne Paris Cité program (CardioNanoStem) and the European Union (ERC-2014-CoG project MaTissE #648779). We thank technical support from CNanoMat-University Paris 13 for physico-chemical characterization and IPGP multidisciplinary program PARI, Paris–IdF region SESAME Grant no. 12015908, the European Union (FEDER), the Région Haut de France, ESCOM and UTC within the framework of the chair: “Green Chemistry and Processes”, the France BioImaging infrastructure from the ImagoSeine core facility (ANR-10-INBS-04).
Received: ((will be filled in by the editorial staff)) Revised: ((will be filled in by the editorial staff)) Published online: ((will be filled in by the editorial staff))
References
[1] E. C. Dreaden, A. M. Alkilany, X. Huang, C. J. Murphy, M. A. El-Sayed, Chem. Soc.
Rev. 2012, 41, 2740.
[2] R. Shukla, V. Bansal, M. Chaudhary, A. Basu, R. R. Bhonde, M. Sastry, Langmuir 2005,
21, 10644.
[3] A. M. Alkilany, C. J. Murphy, J Nanopart Res 2010, 12, 2313.
[4] J. Langer, D. Jimenez de Aberasturi, J. Aizpurua, R. A. Alvarez-Puebla, B. Auguié, J. J. Baumberg, G. C. Bazan, S. E. J. Bell, A. Boisen, A. G. Brolo, et al., ACS Nano 2019, DOI 10.1021/acsnano.9b04224.
[5] X. Wu, C. Hao, J. Kumar, H. Kuang, N. A. Kotov, L. M. Liz-Marzán, C. Xu, Chem. Soc.
Rev. 2018, 47, 4677.
[6] J. Langer, S. M. Novikov, L. M. Liz-Marzán, Nanotechnology 2015, 26, 322001. [7] Y. Wu, D. Bennett, R. D. Tilley, J. J. Gooding, Advanced Materials 2019, 1904339. [8] B. Kang, M. M. Afifi, L. A. Austin, M. A. El-Sayed, ACS Nano 2013, 7, 7420.
[9] P. Ghosh, G. Han, M. De, C. K. Kim, V. M. Rotello, Advanced Drug Delivery Reviews
2008, 60, 1307.
[10] A. M. Alkilany, L. B. Thompson, S. P. Boulos, P. N. Sisco, C. J. Murphy, Advanced
Drug Delivery Reviews 2012, 64, 190.
[11] C. Loo, A. Lowery, N. Halas, J. West, R. Drezek, Nano Lett. 2005, 5, 709.
[12] X. Huang, I. H. El-Sayed, W. Qian, M. A. El-Sayed, J. Am. Chem. Soc. 2006, 128, 2115. [13] A. M. Alkilany, L. B. Thompson, S. P. Boulos, P. N. Sisco, C. J. Murphy, Advanced
Drug Delivery Reviews 2012, 64, 190.
[14] L. Zhang, C. Liu, Y. Gao, Z. Li, J. Xing, W. Ren, L. Zhang, A. Li, G. Lu, A. Wu, et al.,
Advanced Healthcare Materials 2018, 7, 1801144.
[15] A. Espinosa, J. Kolosnjaj‐Tabi, A. Abou‐Hassan, A. P. Sangnier, A. Curcio, A. K. A. Silva, R. D. Corato, S. Neveu, T. Pellegrino, L. M. Liz‐Marzán, et al., Advanced
Functional Materials 2018, 28, 1803660.
[16] J. Liu, F. Zhai, H. Zhou, W. Yang, S. Zhang, Advanced Healthcare Materials 2019, 8, 1801300.
[17] L. R. Hirsch, R. J. Stafford, J. A. Bankson, S. R. Sershen, B. Rivera, R. E. Price, J. D. Hazle, N. J. Halas, J. L. West, Proc. Natl. Acad. Sci. U.S.A. 2003, 100, 13549.
[18] S. Lal, S. E. Clare, N. J. Halas, Acc. Chem. Res. 2008, 41, 1842.
[19] G. von Maltzahn, J.-H. Park, A. Agrawal, N. K. Bandaru, S. K. Das, M. J. Sailor, S. N. Bhatia, Cancer Research 2009, 69, 3892.
21
[20] E. B. Dickerson, E. C. Dreaden, X. Huang, I. H. El-Sayed, H. Chu, S. Pushpanketh, J. F. McDonald, M. A. El-Sayed, Cancer Letters 2008, 269, 57.
[21] T. Nunes, T. Pons, X. Hou, K. D. Van, B. Caron, M. Rigal, M. B. Di, B. Palpant, C. Leboeuf, A. Janin, et al., J Exp Clin Cancer Res 2019, 38, 306.
[22] D. Jaque, L. M. Maestro, B. del Rosal, P. Haro-Gonzalez, A. Benayas, J. L. Plaza, E. M. Rodríguez, J. G. Solé, Nanoscale 2014, 6, 9494.
[23] X. Huang, P. K. Jain, I. H. El-Sayed, M. A. El-Sayed, Lasers Med Sci 2007, 23, 217. [24] X. Huang, M. A. El-Sayed, Journal of Advanced Research 2010, 1, 13.
[25] F. Danhier, O. Feron, V. Préat, Journal of Controlled Release 2010, 148, 135. [26] M. Varna, P. Ratajczak, I. Ferreira, C. Leboeuf, G. Bousquet, A. Janin, Journal of
Biomaterials and Nanobiotechnology 2012, 3, 269.
[27] D. de Melo‐Diogo, C. Pais‐Silva, D. R. Dias, A. F. Moreira, I. J. Correia, Advanced
Healthcare Materials 2017, 6, 1700073.
[28] F. Chen, W. Cai, Nanomedicine (Lond) 2015, 10, 1.
[29] A. M. Smith, M. C. Mancini, S. Nie, Nature Nanotechnology 2009, 4, 710.
[30] E. Hemmer, A. Benayas, F. Légaré, F. Vetrone, Nanoscale Horizons 2016, 1, 168. [31] Y. Cai, Z. Wei, C. Song, C. Tang, W. Han, X. Dong, Chem. Soc. Rev. 2019, 48, 22. [32] Kenry, Y. Duan, B. Liu, Advanced Materials 2018, 30, 1802394.
[33] M. Zhao, B. Li, Y. Fan, F. Zhang, Advanced Healthcare Materials 2019, 8, 1801650. [34] D. Yin, X. Li, Y. Ma, Z. Liu, Chemical Communications 2017, 53, 6716.
[35] A. Espinosa, A. K. A. Silva, A. Sánchez‐Iglesias, M. Grzelczak, C. Péchoux, K. Desboeufs, L. M. Liz‐Marzán, C. Wilhelm, Advanced Healthcare Materials 2016, 5, 1040.
[36] P. Diagaradjane, A. Shetty, J. C. Wang, A. M. Elliott, J. Schwartz, S. Shentu, H. C. Park, A. Deorukhkar, R. J. Stafford, S. H. Cho, et al., Nano Lett 2008, 8, 1492.
[37] Y. Cao, J.-H. Dou, N. Zhao, S. Zhang, Y.-Q. Zheng, J.-P. Zhang, J.-Y. Wang, J. Pei, Y. Wang, “Highly Efficient NIR-II Photothermal Conversion Based on an Organic
Conjugated Polymer,” 2016.
[38] A. C. Anselmo, V. Gupta, B. J. Zern, D. Pan, M. Zakrewsky, V. Muzykantov, S. Mitragotri, “Delivering Nanoparticles to Lungs while Avoiding Liver and Spleen through Adsorption on Red Blood Cells,” DOI 10.1021/nn404853zcan be found under https://pubs.acs.org/doi/abs/10.1021/nn404853z, 2013.
[39] H.-H. Chang, C. J. Murphy, Chem. Mater. 2018, 30, 1427.
[40] J. Zhou, Y. Jiang, S. Hou, P. K. Upputuri, D. Wu, J. Li, P. Wang, X. Zhen, M. Pramanik, K. Pu, et al., ACS Nano 2018, 12, 2643.
[41] A. Plan Sangnier, R. Aufaure, S. Cheong, L. Motte, B. Palpant, R. D. Tilley, E. Guenin, C. Wilhelm, Y. Lalatonne, Chem. Commun. 2019, DOI 10.1039/C8CC09476D.
[42] S. Kralj, M. Rojnik, R. Romih, M. Jagodič, J. Kos, D. Makovec, J Nanopart Res 2012,
14, 1151.
[43] W. Wang, K. Gaus, R. D. Tilley, J. J. Gooding, Mater. Horiz. 2019, 6, 1538.
[44] M. Aioub, B. Kang, M. A. Mackey, M. A. El-Sayed, J Phys Chem Lett 2014, 5, 5, 2555. [45] S. R. Panikkanvalappil, N. Hooshmand, M. A. El-Sayed, Bioconjugate Chemistry 2017,
28, 2452.
[46] P. Nativo, I. A. Prior, M. Brust, ACS Nano 2008, 2, 1639.
[47] B. Kang, L. A. Austin, M. A. El-Sayed, Nano Lett. 2012, 12, 5369.
[48] C. J. Murphy, T. K. Sau, A. M. Gole, C. J. Orendorff, J. Gao, L. Gou, S. E. Hunyadi, T. Li, J. Phys. Chem. B 2005, 109, 13857.
[49] R. Di Corato, A. Espinosa, L. Lartigue, M. Tharaud, S. Chat, T. Pellegrino, C. Ménager, F. Gazeau, C. Wilhelm, Biomaterials 2014, 35, 6400.
[50] A. Plan Sangnier, S. Preveral, A. Curcio, A. K A Silva, C. T. Lefèvre, D. Pignol, Y. Lalatonne, C. Wilhelm, J Control Release 2018, 279, 271.
22
[51] A. Espinosa, R. Di Corato, J. Kolosnjaj-Tabi, P. Flaud, T. Pellegrino, C. Wilhelm, ACS
Nano 2016, 10, 2436.
[52] A. R. Rastinehad, H. Anastos, E. Wajswol, J. S. Winoker, J. P. Sfakianos, S. K. Doppalapudi, M. R. Carrick, C. J. Knauer, B. Taouli, S. C. Lewis, et al., Proc. Natl.
Acad. Sci. U.S.A. 2019, 116, 18590.
[53] R. Aufaure, Y. Lalatonne, N. Lièvre, O. Heintz, L. Motte, E. Guénin, RSC Adv. 2014, 4, 59315.
[54] K. Jiang, D. A. Smith, A. Pinchuk, The Journal of Physical Chemistry C 2013, 117, 27073.
23
Figure 1. Panel of gold nanoparticles. A. TEM images of the nanoparticles dispersed in
water, from top to bottom: single-core nanospheres, multi-core nanoraspberries, nanorods-1 and nanorods-2. B. Corresponding absorbance spectra for each nanoparticle type, dispersed in water, and obtained at a concentration [Au] = 0.12 mM.
24
Figure 2: Internalization of the gold nanoparticles (nanospheres nanoraspberries, nanorods-1
and nanorods-2) in cancer cells. A) The dose of internalized nanoparticles is assessed in function of the incubation concentration. B) Absorbance spectra of the nanoparticles when internalized in cells at high doses (2-6 pg of gold/cell). C) TEM images of the four types of nanoparticles right after internalization in cancer cells, for high (2-4 pg/cell) and low (0.1-0.4 pg/cell) doses. The nanoparticles are confined in the endosomal compartments of the cells. Higher doses lead to increased amount of both the endosomes and the nanoparticles within.
25
Figure 3: Nanoparticles in aqueous dispersion (in water situation) and cells containing
nanoparticles (in cells situation) are irradiated with the three lasers, with wavelengths at 680, 808, and 1064 nm, always at 0.3 W/cm². A) Typical IR images for all nanoparticles (nanospheres, nanoraspberries, nanorods-1 and nanorods-2, from left to right) are displayed for both in water and in cells situations, at global sample concentration [Au] = 0.5 mM. B) Representative temperature curves showing the progressive heating and illustrating the plateau temperature T are displayed for each nanoparticle, in conditions where the changes between the in water and in cells situations are the most pronounced (680 nm laser for the nanospheres, 808 nm laser for the nanorods-1, and 1064 nm laser for the nanoraspberries and nanorods-2).
26
Figure 4. Average temperature elevation T compared in water (black curves) and in cells (red curves) for nanospheres, nanoraspberries, nanorods-1 and nanorods-2 (from top to bottom), upon irradiation with the three lasers at 680, 808 and 1064 nm (from left to right) and 0.3 W/cm². Gold concentrations are ranging from 0.125 to 2 mM.
27
Figure 5: SAR values compared in water and in cells for (from top to bottom) nanospheres,
nanoraspberries, nanorods-1 and nanorods-2 irradiated with the three lasers at 0.3 W/cm² and at the wavelengths (from left to right) 680, 808 and 1064 nm. Concentrations are ranging from 0.125 to 2 mM.
28
Figure 6. Photothermal treatment of cancer cells with gold nanoparticles. The nanoparticles
are A) added to the culture medium for the 10 minutes of PTT treatment only (extracellular condition) or B) internalized in the cancer cells prior to PTT. C-D) Cancer cells were exposed
29
to PTT treatment at 0.3 W/cm² with three lasers (680, 808 and 1064 nm) for 10 minutes and cancer cell survival was assessed 24h upon exposure via flow cytometry. Early and late apoptosis and/or necrosis were determined by annexin V and propidium iodide (PI) staining after PTT treatment. For each condition the percentage indicated in each compartment represents: viable cells (left, bottom, annexin V- and PI-), early apoptosis (right, bottom, annexin V+ and PI-), late apoptosis and/or necrosis (left, up, annexin V+ and PI+) and the debris (right, up, annexin V- and PI +). From top to bottom: without nanoparticles, with nanospheres, nanoraspberries, nanorods-1 and nanorods-2. Only the most representative conditions are displayed and C) the left column corresponds to nanoparticles in extracellular conditions and D) the right column to nanoparticles in intracellular conditions. Cell viability was also assessed for E) the cells without nanoparticles exposed to the three lasers and for the cells with the nanoparticles F) in the extracellular medium or G) internalized in the cells.
Table of contents entry
A set of four plasmonic gold nanoparticles of multiple size and shape, spheres, rasbperries-like multicores and rods, are investigated for their photothermal therapeutic heat generation within cancer cells. All provide a better therapy once inside the cells, due to an absorbance shift towards the infra-red wavelengths, for some with a remarkable increase of the heat generated intracellularly.
Keyword: gold nanoparticles-based photothermal therapy
A. Plan Sangnier, A. Van de Walle, R. Aufaure, M. Fradet, L. Motte, E. Guenin, Y. Lalatonne*, C. Wilhelm*
Endosomal confinement of gold nanospheres, nanorods and nanoraspberries
fundamentally alters their photothermal identity: best agent differs from extracellular to intracellular
30
Supporting Information
Endosomal confinement of gold nanospheres, nanorods and nanoraspberries governs their photothermal identity and is beneficial for cancer cells therapy
Anouchka Plan Sangnier, Aurore Van de Walle, Romain Aufaure, Magali Fradet, Laurence Motte, Erwann Guenin, Yoann Lalatonne*, Claire Wilhelm*
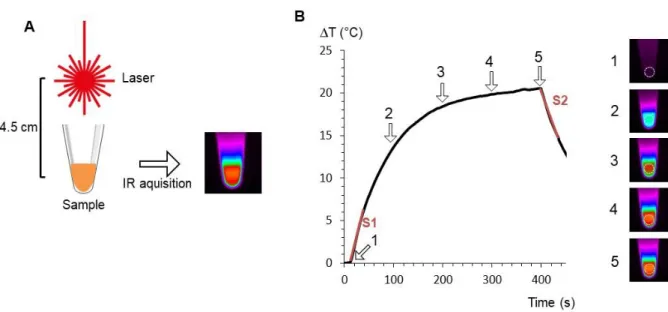
Figure S1. Photothermal experiment set up and recording. A. Typical set up for PTT
measurement. Sample is irradiated with a laser positioned 4.5 cm above. Acquisition is made with an infrared camera which provides a thermal fingerprint of the sample. B. Typical heating curve extracted from the IR time-stack in the area represented by a white dashed circle (right images). Temperature is equilibrated before laser is turned on (point 1, with corresponding IR image on the right). Then temperature is increasing during laser irradiation (points 2 and 3) before reaching a plateau temperature (point 4). Laser is turned off at point 5. Slope S1 is used to calculate the SAR, and slope S2 to calculate η.
31
Figure S2. Photothermal ligh-to-heat conversion coefficient parameter (η) calculated for each
laser at 680, 808 and 1064 nm wavelengths for all nanoparticles. The error bars represent the standard deviation between all measurements.
33
Figure S3. Theoretical temperature increase after laser submission of (from top to bottom)
nanospheres, nanoraspberries, nanorods-1 and nanorods-2 when submitted at different lasers (680, 808 and 1064 nm) for concentrations ranging from A. 0 to 2 mM at 0.3 W/cm² and B. 0 to 20 mM.
Figure S4. Theoretical SAR for nanospheres, nanoraspberries, 1 and
nanorods-2when submitted at different lasers (680, 808 and 1064 nm) for concentrations ranging from 0 to 3 mM at 0.3 W/cm²
34
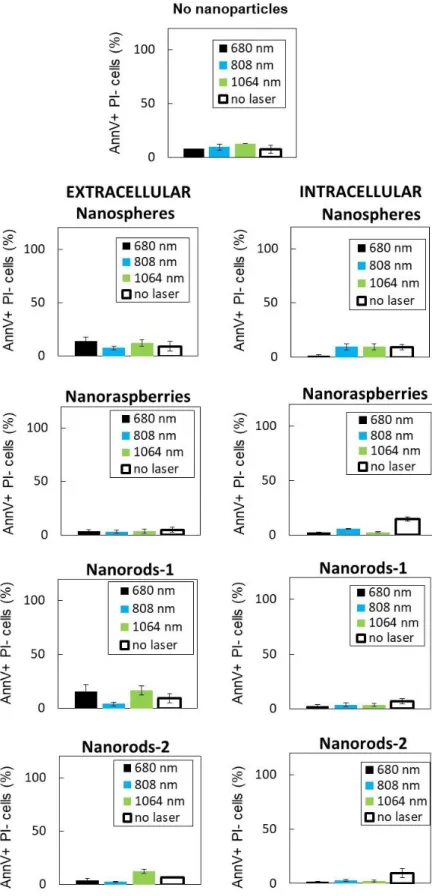
Figure S5. Flow cytometry analysis of the percentage of cells positive to Annexin V (AnnV)
35
Figure S6. Flow cytometry analysis of the percentage of cells negative to Annexin V (AnnV)
36
Figure S7. Flow cytometry analysis of the percentage of cells positive to both Annexin V
37
Figure S8. Impact of all conditions of photothermal treatments, measured via the resulting
metabolic activity of the cells 24 hours after the treatment. Nanospheres, nanoraspberries and nanorods-1 and -2 were applied to the cells extracellularly or intracellularly, upon the exact same protocol as used for flow cytometry analysis of induced cell death (compare with results in Figure 6E-G)