Publisher’s version / Version de l'éditeur:
Vous avez des questions? Nous pouvons vous aider. Pour communiquer directement avec un auteur, consultez la première page de la revue dans laquelle son article a été publié afin de trouver ses coordonnées. Si vous n’arrivez pas à les repérer, communiquez avec nous à [email protected].
Questions? Contact the NRC Publications Archive team at
[email protected]. If you wish to email the authors directly, please see the first page of the publication for their contact information.
https://publications-cnrc.canada.ca/fra/droits
L’accès à ce site Web et l’utilisation de son contenu sont assujettis aux conditions présentées dans le site LISEZ CES CONDITIONS ATTENTIVEMENT AVANT D’UTILISER CE SITE WEB.
Building Research Note, 1985-04
READ THESE TERMS AND CONDITIONS CAREFULLY BEFORE USING THIS WEBSITE.
https://nrc-publications.canada.ca/eng/copyright
NRC Publications Archive Record / Notice des Archives des publications du CNRC : https://nrc-publications.canada.ca/eng/view/object/?id=68697302-fb96-48ac-9741-153b9788257c https://publications-cnrc.canada.ca/fra/voir/objet/?id=68697302-fb96-48ac-9741-153b9788257c
NRC Publications Archive
Archives des publications du CNRC
This publication could be one of several versions: author’s original, accepted manuscript or the publisher’s version. / La version de cette publication peut être l’une des suivantes : la version prépublication de l’auteur, la version acceptée du manuscrit ou la version de l’éditeur.
For the publisher’s version, please access the DOI link below./ Pour consulter la version de l’éditeur, utilisez le lien DOI ci-dessous.
https://doi.org/10.4224/40000487
Access and use of this website and the material on it are subject to the Terms and Conditions set forth at
Field assessment of residential water source and ground source heat
pumps across Canada
,.>,: F:>i $%< &,*- a,?. .l I - , : : ;
FIELD ASSESSMEPIT
OF RESIDENTIAL
WATER SOlJRCEAND GROUND, SOURCE HEAT PUMPS ACROSS C A ~ n
-
cc r m f iKPG.
RlL
R.B. Chauhan
15-
o5-
z
I
~ I W L I Q T M Q U C :
Division of Building Research, National Research
~ 1 . 1 - c - 1 C l 5 f
Ottawa, A p r i l 1985
National R ' h Consdl national
FIELD ASSESSMENT OF lWSIDENT1A.L WATER SOURCE AND GROUND SOURCE HEAT PUMPS ACROSS CANADA
R.B. Chauhan
Seasonal Performance Factors between 1.5 and 2.4 were obtained when
five water source and one grwnd source heat pump system were monitored for
a designated period. These systems were located across Canada and, in some caaea, a l l or a portion of the domestic hot water
(Dm)
requfrements werea l s o supplied by the heat pumg systems. A l l systems operated sarisfactorily without any major problems, providing subst.antial savings on energy bills for heatfng and DHW.
INTRODUCTION
One of the obstacles t o a widespread use of air-to-air heat pumps is
the fact that their heat output decreases as the need for hear increases.
Water source and ground source hcat pumps do nar have this drawback and
have, therefore, been gainring an increasing shsre of the heat pump market in areas where w e l l water'is available, I n the fall o f 1982 t h e National
Research Council awarded seven contracts for monitoring the in-service
performance of six water source heat pumps and one ground source heat pump that were providing heat to homes in d i f f e r e n t regions of Canada.
The objective was t o determine the seasonal performance factor of each
hcat pump installatian. This was accomplished by monitoring the energy
extracted from the ground water or the ground coupled heat exchanger system-
These data, combined with the amount of electrical energy supplied to the heating system, uere used to calculate the seasonal performance factor.
This report describes the heat pump systems that were monitored and presents
the results.
TEST SITE; DESCRIPTION
The test site locatfoass type of heat pump system and related d e t a i l s are given in Table 1-
The intention was
ta
monitor seven systems, but a number of problemswere encountered at the Winnipeg l o a t i o n and monitoring was terminated before any usable data were obtained.
TPJSTRWNTATIBN AND
MONITORING
STRATEGYFigure 1 i l l u s t r a t e s a t y p i c a l setup used to monitor the heat pumps in
I ) flow rate of w e l l water or brine;
2) rate of heat trsnsfer between the evaporator and the sater/brine c i r c u i t ;
3) the electric energy consumed by the compressor, indoor blower and
submersible well pump or circulating pump ( f o r the ground source
system).
The heat: extracted from the water/brine was measured by an energy meter, s p e c i a l l y built for t h i s study by Ontario Research Foundation under
contract for NI(CC.'~ This energy meter measured the supply and return water (brine) temperature simultaneously with the flow rate, computed the rate of energy transfer and integrated it to g i v e the total to date.
The measured quantitles were recorded once each week and monthly reports on system performance were produced. The monthly summary Included a l l the quantities rel~ted to the heat pump system performance:
Q h ~ = Total season heating energy supplied by (kW-h) ; heat pump system during the heating PC = Electrical energy used by compressor (k~qh);
Pb = Electrical energy used by indoor blower (kT4.h);
Q, = T o t a l heat extracted f r o m the well water or brine (kW-h):
F
Php = Total e l e c t r i c a l energy used by the system during the heating season
CW-h);
P = Electrical energy used by the submersible well pump or t h e c i r c u l a t i n g
P
pump (kW-h);
Pa = Electrical energy qsed by the auxiliary resistance heaters in the furnace (k~ah).
for the e n t l r e heating season. for the entire h e a t i n g season.
These quantities were then used to calculate t h e foL10wing values.
Coefficient of Perfarmaace (COP) i s the ratio of rate of heat d e l i v e r e d to
the power supplfed t o t h e heat pump, expressed i n consistent units.
P o t water source heat pumps t h i s value is expressed for a certain inlet water temperatare and a specified flaw rate. The energy consumption of the
auxiliary heaters and the water pump (which is usually located fn the well)
is
excluded.For t h i s study, COP has been c a l c u l a t e d f o r each math as follows: (PC + Pb + Qe)
COP =
(PC + - p b ) *
Seasonal Performance Factor (SPF) is the "average1' COP of a heat pump system
for the entire heating season. Unlike the COP, the SPF takes i n t o accoufit
the input and output of the heat pump system under a l l of the varying conditions encountered during the season.
For this study SPF is calculated as follows:
Tables 1 and 2 summarize the performance data of the s i x heat pump systems for the perlod indicated.
Black P o i n t , Nova Scoria
The results of the moniroring, given in Table 2, indicate that t h i s
heat pump installation achieved an SPF of 1.9 while providing a l l t h e heat required and a portion of the domestic hot water CDHW). The manufacturer
claims a COP of 3.9 but the measured COP was only 2.3. Several factors p e c u l i a r to t h i s tnstallativn have the effect of lowering the performance rating, They have been incorporated I n t o the system for other than economic benefits.
The owner has found, for instance, that continuaus operation af the
warm air blower provides greater comfort through improved a i r distribution. This has t h e effect of lowering t h e SPF v a l u e , since the energy s u p p l i e d to
the blower is converted to heat at an SPF of 1, whereas the heat pump
s u p p l i e s heat at an SPF of 1.9.
*ring the 12 months immediately preceding the heat pump installatTon,
011 consumption w a s 6,435 L and total electricity consumption was
8,450 kWmh. At 1984 energy prices, the t o t a l annual energy c o s t for the
household would be $2,819, By comparison, the average annual e l e ~ t r i c f t y consumption since the installation of the heat pump has been 31 HW.h at a
current cost of $1,190 ( $ 3 8 . 4 1 ~ - h ) , which includes the cost of a i r
condftioning, a benefit that was not provided previously.
Camparatfve energy costs are illustrated on a monthly basis in
Figure 2. Essentfally all savings are realized during the heating season.
This is the time when the greatest b e n e f i t is d e r i v e d from the "free" energy
a v a i l a b l e in the ground water, since household electric energy costs are essentially the same for the two conditions.
Fredericton, Hew Brunswick
This heat pump system includes domestic water heating. Thus t h e t o t a l
energy used for DHW heating and the electrical energy consumed by the DHW
tank circulattng pump are included i n the calculations of SPF.
Table 2 shows that the space heating plus DHW energy supplied to the
house was 18.3 MWah*, of which 1 2 . 3 MW*h w a s o b t a i n e d from the ground water. Actual energy consumed by the heat pump was 7.8 MWmh; thus the SPF w a s 2.3.
*Units used in Table 2 a r e kW*h, Lo provide a more p r e c i s e figure (PIW. h = ZOO0 kW*h).
The heat pump system heatfng b i l l w a s about $3001yr (7.8 MU-h @
$38.4/MW- h) compared with approximately $850/yr w1th the previous o i l fired
system,
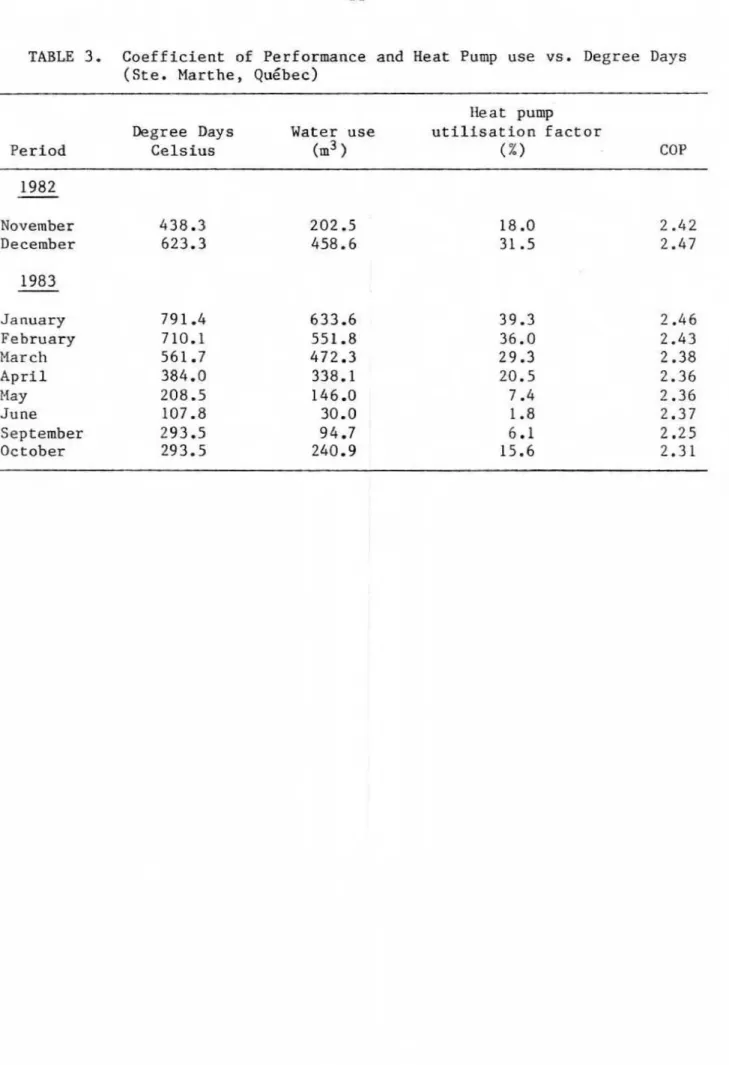
S t e . Piarthe, Qusbec
The SPF for thLs installation was 2.4 with a total purchased energy usage of 6.6 MWah. The energy extracted f r o m the well water was 10.7 W * h .
Total heating energy cost was $259'with the heat pump. Prior t o the heat pump fnstalLation, t h i s reskdence used an at1 fired furnace with a calculated annual oil usage equivalent to 19.8 MWmh. Cost of heating with oil was $587/yr.
Nobleton, Ontario
The SPF for t h i s ground coupled heat pump was 2 . 2 . In the calculation of the heat supplied, the energy used by t h e circulating brine pump was included, since it fs located within the heated space.
The monthly COP values show a slight d e c l i n e as the brfne Inlet
temperature to the heat pump drops during the winter. One unusual
observation is that the monthly COB'S were somewhat lower at the start af
the second heatfng season than at the start of the first, even though the
s o i l temperatures had recovered completely. It is possible that a slight
undetected refrigerant leak in the heat pump caused t h i s d e c l i n e .
Alternatively, there may have been a slight d e c l i n e in the efficiency of the
brine-to-refrigerant heat exchanger due to fouling of its surfaces.
In t h i s case the heat pump performance can only be compared with the estimated energy consumption for the same house, i f equipped with a forced
air electric furnace, as there is nu previous history of energy consumption.
Total heating energy supplied for one year by the heat pump/furnace s y s t e m
far heating and DHW was 36.4 MW-h at an SPF of 2.1 and a c o s t of $665/yr.
With an all-electric furnace the heating b i l l would be $I,398/pr. This
particular model heat pump was designed as a heating-only system and d i d n o t provide any air conditioning.
The heat pump operated at an SPF of 2.3, despite the continuous operation of the furnace blower at low speed. The heat pump supplied
42-4 MU-h of heating energy while consuming 18.8 MW*h. Energy obtained from
w e l l water was 25.8 MW-h. .
Heating costs can only be compared w i t h what they would have been w l t h an all-electric furnace, since the heat pump is the origfnal beating system.
Heating costs p e t year with an electric furnace cansumpt.lon of 4 2 - 4 W*h @ $38.4JMW.h would c o q t $1,628 versus 24.8 HW-b at a cost of $951 with the heat pump.
Langley, B r i t i s h Columbia
This heat .pump operated with an SPF of only 1.5 and provided all the space heating to the r e s i d e n c e . It d i d not perform as w e l l as
the
othersystems monitored in t h i s study. One reason for i t s poor performance is that i t is oversized for its application in Langley w i t h a design
temperature of -8°C. A heat pump of smaller capacity sized appropriately
could have served with a b e t t e r SPF, s i n c e the degradation due to c y c l i n g
would be less severe. Th5s was the only i n s t a l l a t t o n where the ratio of
energy recovered from the water or brine t o the energy consumed by the compressor was less than one. In the other five systems it varied from 1.3 to 2.2.
Stonewall, Manitoba
A number of problems were encountered with the heat pump and r e l a t e d equipment which prevented the heat pump from running. Thus monitoring was discontinued due to time cons~raints of this study.
A d i s c u s s i o n of the problems encountered is included in the following
sect ion.
DISCUSSION OF RESULTS
Test results showed that the SPF's for the systems monitored are
significantly lower than the coefficient of Performance c l a i m e d by the heat
pump manufacturers. The COP calculation daes not take fnto consideration the energy consumed by the w e l l pump or circulating pump. As shorn In Table 2, the calculated COP'S are greater than the SPF values, but are much less than the COP'S c l a i m e d by the manufacturers. For the Fredericton and
S t e . Marthe locations, the COPS are 6-l4% lower than those given by the
manufacturers. Qne reason for the reduced COP'S could be the on-off cycling of the heat pump i n mild weather.
The energy consumed by the circulating or well pump varies as a
percentage of compressor energy
-
from 13% for the Nobleton, Ont, l o c a t i o nt o 32% for the Fredericton location. As seed from the COP's i n Table 2,
well pump energy requirements lower the SPF significantly i n those I n s t a n c e s
where the we11 pump energy i s a large proportion of the t a t a l system consumption,
Figure 3 shows the electrical consumption p e r month of the various
components of t h e heat pump over t h e duration of the heating season for the
Fredericton locatfon. It indicates that the well pump energy has a
significant bearing on the overall system perfarmance. Figure 4 (also for
F r e d e r i c t o n ) shows very l i t t l e variation in heat pump performance due t o changing f l a w rate, water temperature and utilization factors ( i . e . , hours
of operatSon per day).
Figures 5 and 6 show the performance of the heat pump at Ste. Marthe, QuGbec. Figure 5 shows t h e Heat Pump Utilisation Factor (HPUF)* versus the monthly heating Degree Days. The highest HPUF was only 40%, despite t h e low
heatfng capacity of the system (12.0 kW3. This meansithat on a monthly
b a s i s the heat pump had sufficient reserve capacity to supply a d d i t i o n a l WPUF fs the ratio of heat pump operational hours I n a s p e c i f l e d period t o
heat if required and could have easily supplled DHW if it had come with the optional DHW heat exchanger.
Figure 6 shows the variation in heat pump COP with heat pump
utilfsation factor. The COP increases with an increase in the HFUF doe to a reduction in the number of ON/OFF cycles- The degradation of t h e CUP due t o cycling is less pronounced when the heat pump runs far longer cycles.
For the Nobletan location, F i g u r e 7 shows undisturbed f i e l d soil
temperatures at various d e p t h s , along with the observed average monthly a i r
and collector bed temperatures. The collector bed temperature a t one metre
d e p t h is a c t u a l l y lower than the outdoor a i r temperature during the late
w i n t e r aad s p r i n g period. The highest monthly average hear flow taken from
the collector bed was 10.9 watts per metre ( ~ / m ) in mid-January t o mid-February of 1983. During this p e r i o d , the heat pump ran 81Z of t h e time, SO the instantaneous heat flow was only slightly higher at 13..5 ~ / m .
During the coldest w i n t e r heating p e r i o d (December to April) the
collector bed operated with a brine temperature ( t h e average of the i n l e t and outlet readings) about 1.8 K lower than the fmmediately adjacent s o l 1 temperature. At t h i s same time, the undisturbed ground temperature at t h e
collector depth averaged 5 K warmer than the brine temperature. The field observation of a 1.8 K temperature difference across the p i p e can be
compared to the laboratory results of Svec e t a1, ,2 which indicated a t p t a l
temperature drop across the polyethylene p i p e wall and its associated contact resistance wfth the surrounding clay soil of 0.9 K at a similar f i e l d soil temperature difference. However, in Svec's experiment the p i p e was about half the thickness of the collector bed p i p i n g used in t h i s
installation. As Svec suggests, the thermal resistance of a plastic p i p e
wall plus the contact resistance between the p i p e and the sofl can account for a s i g n i f i c a n t fraction o f ehe total temperacure difference between the
heat exchange f l u i d and the undisturbed ground temperature (in t h i s case, about one t h i r d ) .
A final observation about the design of the collector bed can be made
from the record of brine temperatures over one year. Since the soil
temperatures at t h e s t a r t of the second heating season were at o r above
those at the start of the f i r s t season, the heat exchanger does n o t appear to be permanently depressing the s o i l temperature. Thus, t h e pipe is
certainly not buried too deep for complete recovery ro occur over t h e
summer. S5nce thermal recovery was so swift after the first heating season, the collector might well benefit from the wanaer mid-winter s a i l
temperatures available at a greater depth.
PROBLEM ENCOUNTERED
Only a f e w problems w e r e encountered d t h the heat pumps. The
Fredericton heat pump shut down due to a broken p u l l e y on the indoor blower. This was remedied under warranty by the installing contractor.
If there was a power failure at Ste. Marthe when the heat pump was
operating, t h e well pump lost its prime due to a motorized valve not closfng
q u i c k l y enough on the supply line f r o m the expansion t a n k Under such
re-establiehed by manually resetting their i n d i v i d u a l safety re-sets. This
condition could be critical when the house was not occupied for long periods and the o u t s i d e temperature was low.
This problea can be a l l e v i a t e d by adding a bigger expansion tank to t h e
water supply line, thus provldlng a water reserve lar.ge enough for the
motorized valve t o close before the pump l o s e s i t s prime.
The heat pump in Winnipeg had problems w i t h the reversing valve. It
stuck in the cooling mode several times. This caused the space temperature t o drop and the therlaostat second stage would call for heat from the
auxiliary electric furnace.
The reversing valve was replaced t w i c e between k c , 28, 1982 and
Feb. 6 , 1983 in an attempt to overcome this problem, but t h e problem kept
recurring. The refrigeration system may have ben contaminated with some
dirt and these p a r t i c l e s were getting trapped in the reversing v a l v e ,
causing it to stick,
There w a s a l s o a problem with ice formation in the water-freon heat exchanger during extended p e r i o d s of heat pump operation. This restricted water flow through t h e heat exchanger and caused the heat pump to shut down due t o low pressure in the evaporator.
A
new heat pump with an improved d e s i g n was installed in Sept. 1983.CONCLUSIONS
AND
RECOPIHENDATIONSSix of the seven heat p u p s monitored in t h i s study operated
s a t i s f a c t o r i l y , with
SPPts
between 1.5 and 2.4 w h i l e supplying the house heating requirements. I n some cases they a l s o supplied all or part of DHWrequirements.
The SPF could be improved by matching the water pump flow rate with the water flow requirements of Lhe heat pump, and thereby reducing energy
requirements for water pumping,
This study has also shown that if the water or ground source heat pumps are properly installed, they provide satisfactory operation aud substantial savings on energy b i l l s .
REFERENCES
1. Contractor report60
a) F i e l d Assessment of a Well Water Ueat Pump System, I n t e r p r o v i n c i a l Engineering Lrd., DSS No. OlSX.31155-2-444-0, Halifax, Nova Scotia, February 1984.
b) Field Assessment of Water Source. Residential Heat Pump Systems,
Adsett and Associates Ltd., DSS No. 01SX.31155-2-4436, Mouth of Keswiclc, Mew B l u a s w i c k , December 1983.
c) F i e l d Assessment of a Well Water Source Heat Pump System, CMA
Chalifour, Ikrcotta & Associates, DSS No. -0lSX.31155-2-4434,
Montreal, Qugbec, April 1984.
d ) Heasured Performance of a Dealer-Installed Residential Ground-Source Heat Pump System, Ontario Hydro Research Division, DSS
No. 31155-2-4435, Toronto, Dntarfo, March 1984,
e) F i e l d Assessment of a Well Water Source Residential Heat Pump System,
Ontario Research Foundation, BSS NO. 01SX.31155-2-4437, Mississarliga,
Ontario, January 1984.
f)
F i e l d Assessment of Ground Water Sour.ce Residential Reat Pump S y s t e m , Langley, British Columbia, E.J. Faraci and Associates, Ltd,, DSS No. 31155-2-4438, Winnipeg, Manitoba, March 198.4.2. 0.J. Svec, L.E. Goodrich, J.H.L. Palmer,
"Hem
transfer characteristics of In-ground heat exchangers", WRC 22674, r e p r i n t from Energy Research,R e ~ i d ~ n c e h p p l y well Pr;e@ioes Energy
T Y P ~ Heat Loss Watsr COP Energy Coot
(Floor Aree, kW System Type Type Depth Flaw rate D l ~ l p o s a l DHW Inetallad claimed Cost With
Location m2? (AT K$ ( N o m i n a l Size) (m) (TearpmQ) Method lupplted h a t byMEgr. YPP [AfinuaX] H.P.
-- -
Rleck P a i n t Bungalow 12 I(avera1ble Pumped 55 0 . 7 L / s Recharge Portion $7000 3.9 i.9 82819 $1190
W v s Scat La (2-32) (42) Lt7.6 kW) (9.5) well of (Total] (Tetal)
h t e r source DHW
Fr~daricton Rung~lm 10 Non-reversing Pumped 38 0 . 5 L / s Stream yes $5000 3,2 2,3 $850 $300
New Brufiawick (1021 (44) (14.6 WtV) (1.31 Htg. Htg.
Water oourca
-
SCC. Marthe Two I2 Reversible Pumped 27 0.6 L/s Creek no $5135 3.5 2.4 $587 $259
~uiibec aturey (503 ( L Z kw) ( 9 j
rurml Water source
1142)
---
N~blrtw mew 19 Non-reversing 3 , 8 cm, WO m long heat N/h Ye* $6500 ~ 2 . 8 2.1 M I A $665
Ontario Bungalaw (39) (14 kW) errhanger EilLad with
(234) h r t h nmlrce 201 by weight CaGL
burled 1 m deep a w r
1280 m2 area
---
- --
--
k m b g ~ ~ n gew tvp 17 ReversLbte Pumped 15. 1 L / s Rech~rgc? no Hew 3.3 2.3 NJA $723
Ontario etaray (37) ' ( 2 0 kw) ( 1 2 ) well house
1 2 7 ~ Hater rroi~reo
hd*-*p-4
Langley R\IOXB~.OW 2a Reversibla Purnwd 10 0.75 his Refirarge no 96iOQ -3.1 1,s $559 $363
R.C. without (401 (13.5 b ~ ) ( 1 1 ) weir
basement Watar aource
Clasl
---
--
+--
Ui,nnLpeg New cwo 17 Reversible Pumped 36 0.75 L/s Recharge ao New 33.8 System
-
-
Manftoba arorey (53) 114.6 k#) 15.53 we11 hau4e Fat led
[ 1643 2~ EI?C ~ O U ~ C E
---
---
FABLE 2. Heat P u m p Energy Conaumpeion Ear ~ e a t i n g l
Tam1 knergp
Purchased Recouarad Eaargy
Compressor Blower Wa~er/Brina Auxiliary Heat Pump f rora Supplied by COP
Monitorad Energy Fan Energy Pump Energy Beating Energy ~ a t e l r l ~ f n e R.F, to %use cLslIpRd
Lotat ion p e r i d PC ( k ~ . h) P,, (kW*h) P C ~ W * h) Pa (kU*hj Php ( k ~ * h ) Qa {k~mh) Php (kw-h) &eF COP by War.
Blrek Point 02/05/83- 10917 1770 2354
-
1SQ41 16347 29034 1.9 2.3 3-9 Nova Scotfa 01/25/84 Fredericton 09/13/82- 5514 537 1786-
7837 12295 18946 2.3 3.00 3.2 New Bxunmvlck 05/31/83 S t e , Martha 11/01/82- 4636 693.3 1273-
6604 10679 14010 2 . 4 3.00 3.5 Qu6bee 10/29/83 Nobleeon I1/16/82- 14L14 1108 1874 493 17509 16835 36422 2.1P 2.2 2.8 Ontario 11/17/63 tearaingtbh 11 /08/82- 12510 4 i W 2koO-
18830 25779 42409 2.3 2.55 3.3 Ontario 11/27183 b n g l e y 02/24/83- 5480 1D77 814-
7371 4786 11343 1,5 1.7 3.1 B . C . 02/23/ 84I~r6m eonPraetor8' reports. Reference 1.
TABLE
3 . Coefficient of Performance and Heat Pump use vs. Degree Days ( ~ t e . Marthe, ~ d b e c )Heat pump
Ikgree Days Water use u t i l i s a t i o n factor
Period Celsius (a3 )
(XI
COPNovember December January February March A p r i l May June September October
@ HOUSE ENERGY METER AUXlllARY ENERGY
METER (Pal
7 - - - L - - - 1 I
I
WATER FLOW METER
\
HEATEXCHANGER
TO RES l DENCE REVERS ING VALVE
COMPRESSDR R22
F I G U R E 1
PRE H. P . 1
AH RB MAR. APR MAY J U N JULY AI(G SEFi OCT MOY DEC
TIME FIGURE Z G O M P A R A T I V E EPJERG'I C O S T S [ B L A C K P O I I T , N . 9.. 1983-841 1601 - r 5 ) a n - Z C x
z
1200 - nc W L 0 iaoo-
- C n. s 3 g 800-
0 U > U 400 - Y r W u &DO - t u Y A "I ZOO -I
HEAT PU,MP CQMPRESSORI
9 1 1 I I ! I k I I
SEPT OCT NOV DEC JAN FEB MAR 4PR M A Y T l ME
-.
::
2 - 2 1 I 11
z 0.3 0.4 0 . 5 0 . 6
u!
z
(IC A V E R A G E H E A T PUMP FLOW RATE. L l s
A V E R A G E WATER TEMP 1.N HEAT P U h l P E V A P O R A T O R . *C
-
2 . 4 -
-
..
. .. ...
- . * -11 2 4 b 8 10 1 2 14
A V E k A G E O P E R A T I O N TIME.
hid
COEFFICIENT O F PERFORMANCE V S V>ARIOU5 d P E R A T l N G
PARAMETERS {FREDERICTON. hi.%. I
HEAT LOAD. O D C
FIGURE 5
HEAT PUMP UTILLSATIOH FACTETR V S H E A T LOAD D D C J ~ P D A Y 5
HEAT PUMP UTI L I S A T I R I FACTOR. %
F I G U R E 6
COEFFICIENT OF PERFORMANCE V A R I A T I O N WITH HEAT PUMP
U T l l l S A T l O N FACTOR I S T E , MARTHE, Q U E B E C I
-
AVG. MONTHLY OUTDOOR TEMPCOLLECTOR BED TEMP
30 UNOiSTZLRBW SOIL D E W : U 0 ; 20 a 3 C 4 w W L 2E 10 CY C -10
OCT NOW DEC JAN RB MAR APR M Y JUNE JULY AUG S E N OCT NOV DEC
F I G U R E 7
A I R AND .SOIL TEMPERATURE5 AROUND COLLECTOR BED (NOBLETON. ONTARIO1