HAL Id: ird-03044126
https://hal.ird.fr/ird-03044126
Submitted on 7 Dec 2020
HAL is a multi-disciplinary open access
archive for the deposit and dissemination of
sci-entific research documents, whether they are
pub-lished or not. The documents may come from
teaching and research institutions in France or
abroad, or from public or private research centers.
L’archive ouverte pluridisciplinaire HAL, est
destinée au dépôt et à la diffusion de documents
scientifiques de niveau recherche, publiés ou non,
émanant des établissements d’enseignement et de
recherche français ou étrangers, des laboratoires
publics ou privés.
Short-term impact of disturbance on genetic diversity
and structure of Indonesian populations of the
butterflyDrupadia thedain East Kalimantan
C Fauvelot, D Cleary, S Menken
To cite this version:
C Fauvelot, D Cleary, S Menken. Short-term impact of disturbance on genetic diversity and structure
of Indonesian populations of the butterflyDrupadia thedain East Kalimantan. Molecular Ecology,
Wiley, 2006, 15, pp.2069 - 2081. �10.1111/j.1365-294x.2006.02920.x�. �ird-03044126�
Molecular Ecology (2006) 15, 2069–2081 doi: 10.1111/j.1365-294X.2006.02920.x
Blackwell Publishing Ltd
Short-term impact of disturbance on genetic diversity and
structure of Indonesian populations of the butterfly
Drupadia theda
in East Kalimantan
C . F A U V E L O T ,† D . F . R . C L E A R Y* and S . B . J . M E N K E N
Institute for Biodiversity and Ecosystem Dynamics, Faculty of Science, Universiteit van Amsterdam, PO Box 94062, 1090 GB Amsterdam, The Netherlands
Abstract
We investigated the short-term impact of disturbance on genetic diversity and structure of the tropical butterfly Drupadia theda Felder (Lepidoptera: Lycaenidae). Populations were sampled from five landscapes in East Kalimantan (Borneo, Indonesia) which were differ-entially disturbed by selective logging and the 1997/1998 El Niño Southern Oscillation (ENSO)-induced drought and fires. Sampling occurred before (in 1997) and after the forest fires (in 1998, 1999, 2000, and 2004). Drupadia theda populations underwent serious popu-lation size reductions following the 1997/1998 ENSO event. For a total of 208 individuals, we sequenced a 509-bp segment of mtDNA containing the control region plus the 5’ end of the 12S rDNA gene. Haplotype diversity in D. theda populations ranged from 0.468 to 0.953. Just after the 1997/1998 ENSO event, number of recorded individuals and genetic diversity were very low in D. theda populations sampled in the two severely burned areas and in a small pristine forest fragment that was surrounded by burned forest and thereby affected by drought. Interestingly, higher levels of genetic diversity were observed in logged forest compared to proximate pristine forest. After 1998, the genetic composition within the three ENSO-disturbed areas diverged. In the twice-burned forest, the genetic diversity in 1999 already approached pre-fire levels, while it remained nearly unchanged in proximate once-burned forest. Our data suggest that the 1997/1998 ENSO-induced drought and fires caused massive reductions in the genetic diversity of D. theda and that population recoveries were linked to their geographical position relative to patches of unburned forest (and thus to source populations).
Keywords: bottleneck, disturbance, gene flow, genetic diversity, Lepidoptera, mtDNA
Received 10 November 2005; revision accepted 22 January 2006
Introduction
Disturbance is often cited as the principal factor regulating species diversity. It has been described as a force, often abrupt and unpredictable, that kills or badly damages organisms and alters the availability of resources (Mackey & Currie 2000). Different forms of disturbance can have different impacts on biotic assemblages with respect to
species richness. In tropical rainforests, the two prevalent forms of disturbance are logging and El Niño Southern Oscillation (ENSO)-induced disturbances. Previous studies have found that, despite often causing severe structural damage, legal logging seldom leads to reductions in species diversity (Cannon et al. 1998; Willott et al. 2000; Lewis 2001; Cleary 2003) and may be considered as an intermediate disturbance (i.e. intermediate in intensity or in frequency). On the contrary, drought and fires induced by ENSO events are a major disturbance because they can dramatically modify natural habitats over very large spatial and temporal scales (Holmgren et al. 2001; Siegert
et al. 2001; Laurance 2003). Effects of disturbance on tropical species diversity have been investigated in quite a number of organisms, such as flowering plants (Van Nieuwstadt
Correspondence: Cécile Fauvelot, Fax: +31 (0)20 5257878; E-mail: fauvelot@science.uva.nl or cecile.fauvelot@unibo.it
*Present address: National Museum of Natural History ‘Naturalis’, PO Box 9517, 2300 RA Leiden, The Netherlands.
†Present address: Environmental Science, University of Bologna, Via S. Alberto 143, I-48100 Ravenna, Italy.
2070 C . F A U V E L O T , D . F . R . C L E A R Y and S . B . J . M E N K E N
et al. 2001; Brown & Gurevitch 2004; Cleary & Priadjati 2005), birds (Thiollay 1992), mammals (Malcolm & Ray 2000), and insects (Willott et al. 2000; Lewis 2001; Cleary 2003; Cleary & Genner 2004; Cleary et al. 2004). However, little is known about its effect on genetic diversity within species.
The Indonesian province of East Kalimantan (Borneo) was severely affected by the 1997/1998 ENSO event (more than 5 million hectares burned), which was by far the most severe and widespread recorded event in Borneo (Harrison 2000; Siegert et al. 2001). Butterflies in Borneo have pre-viously been extensively studied in terms of community responses to both logging and ENSO-induced droughts and fires (Willott et al. 2000; Cleary 2003; Hamer et al. 2003; Cleary & Genner 2004; Cleary & Mooers 2004; Cleary et al. 2004). In East Kalimantan, the fires created a mosaic of unburned forests (some of which were affected by drought), isolating local populations of butterfly species and reducing species richness in the affected areas (Cleary 2003; Cleary & Genner 2004). Higher levels of species richness were observed in logged forests compared to pristine forest (Cleary 2003, 2004). However, we do not know the con-sequences of such disturbance at the intraspecific level.
Genetic diversity using the mitochondrial DNA control region (CR; also called D-loop) was assessed in Drupadia theda Felder (Lepidoptera: Lyceanidae), a rather common rainforest lycaenid that feeds on a wide range of plant fam-ilies including Fabaceae, Guttiferae, Meliaceae, Rubiaceae, Meliaceae, Clusiaceae, and Sapindaceae (Elliot 1992; Igarashi & Fukada 1997, 2000; Robinson et al. 2001; K. Fiedler, per-sonal communication). This species can thus be considered a generalist with respect to host plant use. However, D. theda
is considered a specialist in terms of myrmecophily as it is obligatorily and specifically associated with Crematogaster
ant species (Seufert & Fiedler 1996), which often form very large and quite territorial colonies. Egg laying typically occurs in close physical contact with host ants, mostly in small groups, and larvae are attended from the first instar onwards (K. Fiedler, personal communication). The average development time from egg to adult of D. theda is 28.3 days (Seufert & Fiedler 1996). Drupadia theda
populations underwent serious population size reduc-tions in East Kalimantan following the 1997/1998 ENSO-induced fires (Cleary 2003; Cleary & Grill 2004). These population size changes are expected to leave a genetic footprint, different from the one expected for constant size populations, which can be revealed by DNA sequencing (Slatkin & Hudson 1991; Rogers & Harpending 1992). Theoretically, population size reductions are predicted to result in a loss of genetic diversity (Wright 1931; Frankham 1995) and an increase of genetic differentiation between populations, due to the increased influence of genetic drift (Chakraborty & Nei 1976). In addition, small and isolated populations are vulnerable to inbreeding depression (Sakai et al. 2001; Frankham et al. 2002), that might reduce
their evolutionary potential and increase their risk of extinction (Frankham 1995; England et al. 2003). Histori-cally documented bottlenecks, such as those resulting from the 1997/1998 ENSO event, provide unique opportunities to study the consequences of such events on genetic variability and the evolutionary potential of natural populations.
We investigated the short-term impact of disturbance on genetic diversity and composition of differentially affected
D. theda populations. The analysed populations originated from pristine, logged, and burned forests in different land-scapes in East Kalimantan, which were sampled before (in 1997) and after the ENSO event (in 1998, 1999, 2000, and 2004). To our knowledge, this is the first study investigat-ing the short-term impact of logginvestigat-ing and ENSO-induced disturbance on the genetic diversity of a tropical rainforest species, with pre- and postdisturbance samples analysed.
Materials and methods
Sampling
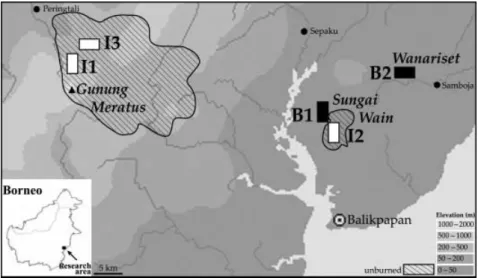
Specimens of Drupadia theda were collected during surveys conducted in 1997 (before the fires), 1998, 1999, 2000, and 2004 in the Balikpapan-Samarinda region of East Kalimantan, Indonesian Borneo (Fig. 1). Five differentially disturbed landscapes were sampled. The three landscapes in unburned isolates (I1, I2, I3) and the remaining two in burned forests (B1, B2) were located in the 5.2 million ha of East Kalimantan that changed from a habitat mosaic of primary forest with areas of secondary forest to an area dominated by secondary (burned) forest with only remnant unburned patches (Siegert et al. 2001). All landscapes are described in detail, in terms of location and dominant vegetation, in Cleary (2003). Briefly, I1 (unlogged primary) and I3 (logged in 1993/1994) landscapes are located in a 108 000 ha large unburned isolate located in part of the ITCI (International Timber Concessions Indonesia) and including the Gunung Meratus Protected Forest Reserve (c. 30 000 ha). The I2 landscape is located in a small, 3500-ha unburned primary isolate that is all that remains of the Sungai Wain Protected Forest; 6500 ha of the original 10 000 ha burned during the 1997/1998 ENSO event. The once-burned landscape B1 is located in the burned part of the Sungai Wain Nature Reserve and burned for the first time during the 1997/1998 ENSO event. The twice-burned landscape B2 was partially burned during the 1982/1983 ENSO event and severely burned during the 1997/1998 ENSO event; it is located in the Wanariset Samboja Research Forest. None of the burned landscapes have been commercially logged although they may have been subjected to unrecorded illegal logging.
Specimens of D. theda were sampled along 300-m transects as described in Cleary (2003). Individuals were immediately killed, after which three legs were removed and stored in 96% ethanol. Each individual was assigned a unique code
D I S T U R B A N C E I M P A C T O N B U T T E R F L Y P O P U L A T I O N G E N E T I C S 2071
that was recorded on the tube containing the legs and the papillote with the butterfly. Voucher specimens were pre-served (using silica gel) and have been deposited in the Zoological Museum of the University of Amsterdam (ZMA), the Netherlands.
Molecular analysis
Genomic DNA was isolated from one leg of each indi-vidual using a cetyltrimethyl ammonium bromide (CTAB) protocol (Hillis & Moritz 1990). Amplifications of the mtDNA control region (CR) plus a fragment of the 5′ end of the 12S rDNA gene were conducted using primers SeqLepMet and LepAT2B (Vila & Björklund 2004). Polymerase chain reaction (PCR) was performed in 25 µL containing 1× PCR buffer (HT Biotechnology), 3 mm MgCl2, 0.12 mm of each dNTP, 0.5 mg/mL bovine serum albumin, 0.05 µm of each primer, 0.4 U Taq polymerase (HT Biotechnology), and approximately 20 ng DNA. PCRs were carried out in PTC 100 Thermocycler (MJ Research): 2-min denaturation at 94 °C; 35 cycles of 1 min at 94 °C, 1 min at 54 °C, and 1 min at 65 °C; and a final extension of 5 min at 65 °C. Amplified fragments were purified with the Boom procedure (Boom
et al. 1990) and cycle sequenced in both directions with either SeqLepMet or LepAT2B using BigDye Terminator sequencing kit (Applied Biosystems). Sequences were run on an ABI 3100 Genetic Analyser (Applied Biosystems). Forward and reverse sequences were compared for each individual in bioedit (Hall 1999) and a single sequence was defined for each individual. Individual sequences were then aligned by eye in genedoc (Nicholas & Nicholas 1997).
Data analysis
Haplotypes were identified and their relative frequency within populations calculated using arlequin version
2.000 (Schneider et al. 2000). A Minimum spanning network displaying evolutionary relationships between haplotypes was obtained in arlequin and drawn by hand in adobe® illustrator® 9.0 (Adobe Systems Inc.). Pairwise distances between haplotypes or groups of haplotypes were estimated according to the uncorrected p distance using mega version 2.1 (Kumar et al. 1993). For further analysis, indels were coded as substitutions, and dinucleotide indels situated in the [TA]n-like stretch were coded as single base substitutions (see Results).
Genetic diversity within populations was measured as haplotype diversity (Hd, Nei 1987), nucleotide diversity (π, Nei 1987), and mean number of pairwise nucleotide differ-ences between individuals (k, Tajima 1983) using dnasp 4.0 (Rozas et al. 2003). Tajima’s D test (Tajima 1989) was conducted within each sample separately as well as within regions per year (by pooling samples), viz., Gunung Meratus (I1 + I3) in 2000, and Sungai Wain (B1 + I2) in 1998, and in 2000. Observed haplotype diversities were compared to the empirical distribution of this index generated using coalescent simulations in order to conduct the haplotype diversity test (H test; Depaulis & Veuille 1998), performed in dnasp. The computer simulations were based on the coalescent process for a neutral infinite-sites model under the assumption of a large constant population size (Hudson 1990). dnasp generates the empirical distribution of Hd, obtained from 10 000 simulations under the neutral coalescent process and given the number of segregating sites observed in each sampled population (the model therefore considers that the number of segregating sites is fixed and that muta-tions are uniformly distributed, at random, along lineages). dnasp thus estimates the probability of obtaining lower or higher values of Hd, computed from the simulation (Hdsim), than the one observed in each sample (Hdobs). These simu-lations were conducted within each sampled population and within the regions, pooling samples as described above.
Fig. 1 Map of the research area, located in
the Balikpapan-Samarinda region of East Kalimantan (Indonesian Borneo) showing location of landscapes in which individuals of Drupadia theda were sampled. Black rectangles represent burned landscapes; white rectangles represent unburned isolates. I1 and I3 landscapes are located in the Gunung Meratus region and were sampled in 2000. B1 and I2 landscapes are located in the Sungai Wain region and were sampled in 1998 and in 2000. B2 is located in the Wanariset region and was sampled in 1997, 1998, 1999, 2000, and 2004.
2072 C . F A U V E L O T , D . F . R . C L E A R Y and S . B . J . M E N K E N Analyses of the spatial and temporal genetic population
structure were performed with arlequin. Genetic diver-gences between pairwise samples were estimated using Φ statistics (ΦST based on haplotype frequencies and molec-ular divergence, using pairwise differences). P values were obtained using a nonparametric permutation procedure with 10 000 permutations (Excoffier et al. 1992) and the level of significance was adjusted according to the sequen-tial Bonferroni correction for α = 0.05 (Rice 1989). The matrix of pairwise ΦST was visualized by nonmetric multi-dimensional scaling (MDS) using the program xlstat® (Addinsoft SARL). The fit of the data in two dimensions was measured with a stress factor (Kruskal & Wish 1978). The spatial distribution of genetic variation was examined using an analysis of molecular variance (amova; Excoffier
et al. 1992). amovas were performed to test the null hypothesis that genetic variation was not associated (i) with temporal variation within sampled landscapes and (ii) with spatial structure in 2000 according to three regions: Gunung Meratus (I1 + I3), Sungai Wain (B1 + I2), and Wanariset (B2).
Results
Sequence analysis
A total of 208 individuals of Drupadia theda sampled from 11 spatial and temporal samples were analysed (Table 1). The percentage of individuals analysed compared to the number of recorded individuals during surveys varied from 4% to 63%. The amplified mtDNA fragment, varying from 502 to 509 bp, contained the control region (CR; 390– 397 bp) plus a fragment of 112 bp of the 5′ end of the 12S rDNA gene. Sequence length variations observed among individuals within the CR originated from length poly-morphism within region A (the poly thymidine stretch at
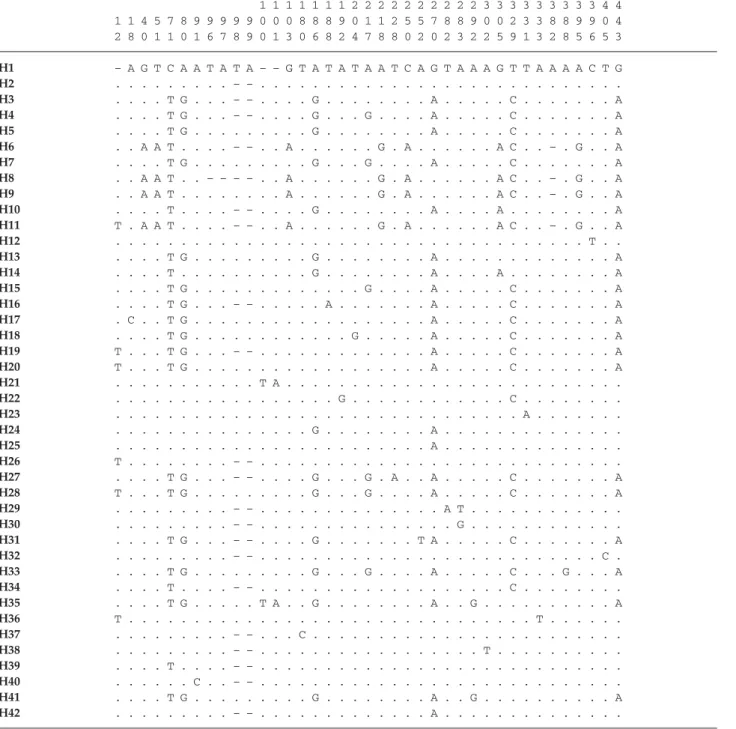
the 5′ end of the control region), within region D (the [TA]n -like stretch), and within the homopolymer described in Vila & Björklund (2004) (Table 2). Because length polymorphism observed in region D originated from dinucleotide indels ([TA] indels, bp 96–101, Table 2), each of these dinucleotide indels were treated as a single base substitution. Among the 208 individuals sequenced, we identified 42 different haplotypes, distinguished by 39 polymorphic sites, from which eight corresponded to indels and 15 were singletons (Table 2). Of the 39 polymorphic sites, five were found in the 12S gene and only one site in the CR presented multiple substitutions (bp 283). Among haplotypes, the overall mean uncorrected sequence divergence was 1.31% and haplotype pairwise divergence ranged from 0.2 to 3.16%. Considered over all individuals, adenine and thymine contents were on average 49.1 and 43.6%, respectively. Haplotype diversity was 0.882, nucleotide diversity was 0.0094, and the mean number of pairwise differences between two individuals for the entire data set was 4.75.
The minimum spanning network revealed a subdivision of the 42 haplotypes into three groups (Fig. 2). Groups 1 and 2 were 1.5 ± 0.4% divergent, and groups 1 and 3 were 2.5 ± 0.6% (average uncorrected p distance). The haplo-types from group 3 (H6, H8, H9, and H11) were exclusively found in seven individuals from the Gunung Meratus region (six individuals from I3-00 and one from I1-00; Table 3). Haplotypes H8, H9, and H11 were all length var-iants of H6. In order to verify if these seven individuals could belong to a cryptic species (these individuals were not morphologically distinct from the others based on their wing patterns), we sequenced a 757-bp fragment of the mtDNA cytochrome oxydase subunit 1 region (COI) for two individuals carrying haplotype H6, for one individual carrying haplotype H1 (the most common haplotype), and for one individual of Drupadia ravindra (closely related to
Table 1 Sampling information. The total number of recorded Drupadia theda as well as the number of sequenced D. theda is given within
each population. Ind./transect is the adjusted number of individuals recorded per transect and per day. Population names are given according to the sampled landscape (see Fig. 1) and the year of sampling. The forest status refers to the degree of disturbance of the landscape at the time of sampling. For example, B1 was sampled in an originally pristine forest that burned during 1997/1998 ENSO Population name Sampled region Sampled year Forest status Recorded individuals No. of sequenced individuals Ind./transect
I1-00 Gunung Meratus 2000 pristine 581 24 5.28
I3-00 Gunung Meratus 2000 logged 214 22 2.28
B1-98 Sungai Wain 1998 burned once 20 11 0.39
B1-00 Sungai Wain 2000 burned once 96 24 1.09
I2-98 Sungai Wain 1998 pristine 34 19 0.76
I2-00 Sungai Wain 2000 pristine 175 20 1.70
B2-97 Wanariset 1997 burned once 48 24 0.98
B2-98 Wanariset 1998 burned twice 4 2 0.08
B2-99 Wanariset 1999 burned twice 40 15 0.82
B2-00 Wanariset 2000 burned twice 249 25 2.27
D I S T U R B A N C E I M P A C T O N B U T T E R F L Y P O P U L A T I O N G E N E T I C S 2073
D. theda). We used primers C1-J-2183 and TL2-N-3014 (Simon et al. 1994) and the protocol described in Vila & Björklund (2004). A sequence divergence of 1.45% was observed at COI between individuals of H6 and H1. In comparison, a sequence divergence of 6.87% was found between COI sequences of D. theda (haplotype H1) and D. ravindra, and a sequence divergence of 6.47% was found
between COI sequences of haplotype H6 and D. ravindra. As these results (morphologically and genetically) were not final evidence that individuals carrying H6 were belonging to a cryptic species, we kept these seven individuals in the data set for further analyses to avoid reducing sample sizes. Nevertheless, it should be noted that removing the seven group 3 individuals did not significantly change the results.
Table 2 Sequence differences amongst the 42 haplotypes found in Drupadia theda populations. Dots indicate identical bases. The entire
sequence of haplotype H1 was deposited in GenBank, Accession no. DQ350438
mtDNA control region 12S rDNA 1 1 1 1 1 1 1 2 2 2 2 2 2 2 2 2 2 3 3 3 3 3 3 3 3 3 4 4 1 1 4 5 7 8 9 9 9 9 9 0 0 0 8 8 8 9 0 1 1 2 5 5 7 8 8 9 0 0 2 3 3 8 8 9 9 0 4 2 8 0 1 1 0 1 6 7 8 9 0 1 3 0 6 8 2 4 7 8 8 0 2 0 2 3 2 2 5 9 1 3 2 8 5 6 5 3 H1 – A G T C A A T A T A – – G T A T A T A A T C A G T A A A G T T A A A A C T G H2 . . . – – . . . . H3 . . . . T G . . . – – . . . . G . . . A . . . C . . . A H4 . . . . T G . . . – – . . . . G . . . G . . . . A . . . C . . . A H5 . . . . T G . . . G . . . A . . . C . . . A H6 . . A A T . . . . – – . . A . . . G . A . . . A C . . – . G . . A H7 . . . . T G . . . G . . . G . . . . A . . . C . . . A H8 . . A A T . . – – – – . . A . . . G . A . . . A C . . – . G . . A H9 . . A A T . . . A . . . G . A . . . A C . . – . G . . A H10 . . . . T . . . . – – . . . . G . . . A . . . . A . . . A H11 T . A A T . . . . – – . . A . . . G . A . . . A C . . – . G . . A H12 . . . T . . H13 . . . . T G . . . G . . . A . . . A H14 . . . . T . . . G . . . A . . . . A . . . A H15 . . . . T G . . . G . . . . A . . . C . . . A H16 . . . . T G . . . – – . . . A . . . A . . . C . . . A H17 . C . . T G . . . A . . . C . . . A H18 . . . . T G . . . G . . . A . . . C . . . A H19 T . . . T G . . . – – . . . A . . . C . . . A H20 T . . . T G . . . A . . . C . . . A H21 . . . T A . . . . H22 . . . G . . . C . . . . H23 . . . A . . . . H24 . . . G . . . A . . . . H25 . . . A . . . . H26 T . . . – – . . . . H27 . . . . T G . . . – – . . . . G . . . G . A . . A . . . C . . . A H28 T . . . T G . . . G . . . G . . . . A . . . C . . . A H29 . . . – – . . . A T . . . . H30 . . . – – . . . G . . . . H31 . . . . T G . . . – – . . . . G . . . T A . . . C . . . A H32 . . . – – . . . C . H33 . . . . T G . . . G . . . G . . . . A . . . C . . . G . . . A H34 . . . . T . . . . – – . . . C . . . . H35 . . . . T G . . . T A . . G . . . A . . G . . . A H36 T . . . T . . . . H37 . . . – – . . . C . . . . H38 . . . – – . . . T . . . . H39 . . . . T . . . . – – . . . . H40 . . . C . . – – . . . . H41 . . . . T G . . . G . . . A . . G . . . A H42 . . . – – . . . A . . . .
2074 C . F A U V E L O T , D . F . R . C L E A R Y and S . B . J . M E N K E N
Haplotypes H1 and H2 (length variants) were carried by 44% of the individuals from all sampled landscapes. Seven haplotypes were shared in at least two regions (Gunung Meratus, Sungai Wain or Wanariset), representing 66% of the individuals, while the rest of the individuals carried haplotypes that were restricted to a particular region (i.e. 35 haplotypes; see Table 3). Within landscapes, the number of haplotypes ranged from one (in B2-98) to 15 (in B2-97). Sample B2-98 was excluded from further analysis because only two individuals were collected in the Wanariset forest in 1998. However, it should be noted that this low sample size was the consequence of the low abundance of butter-flies observed in this landscape in 1998 (0.08 individuals vs. nearly one individual per transect per day in 1997, with similar sampling intensity; see Table 1).
Genetic diversity and neutrality tests
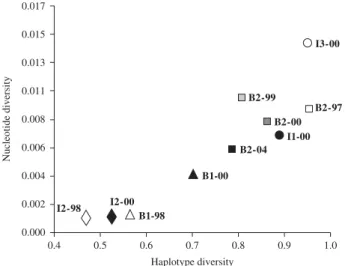
Within landscapes, haplotype diversity ranged from 0.468 (for I2-00) to 0.953 in B2-97 (Table 4). The highest values of gene diversity were found in B2-97 and I3-00, followed by I1-00 and B2 sampled after 1997, and the lowest values were found in Sungai Wain, both in 1998 and 2000 (Fig. 3). Haplotype diversity was not correlated with the mean number of individuals per transect per day (Spearman’s coefficient = 0.394, P = 0.260; Fig. 4) nor the numbers of recorded individuals within landscapes (Spearman’s coefficient = 0.382, P = 0.276), nor the sample size (Spear-man’s coefficient = 0.526, P = 0.123). Samples B1-98 and I2-00 were composed of individuals carrying haplotype H1 (the most common one) and length variants associated with H1 (i.e. H2, H21, and H26).
Within the population from the burned Wanariset forest (B2), the genetic diversity remained more or less stable through time (with the exception of the first postfire sampling in 1998 where only two individuals carrying identical haplotypes were sampled), but the haplotype composition changed. Apart from H5 (a length variant of H3), the most common haplotypes in B2 in 1997 (and over-all landscapes; H1, H2, H3, and H4) have been observed in the population after the fires. In contrast, the rare and endemic haplotypes from 1997 were not found later in samples from the same landscape (see Table 3). Interestingly, in B2, a number of haplotypes, which were not encoun-tered in 1997 and in any other landscapes, were observed in 1999, 2000, and 2004 (Table 3). These haplotypes might
Fig. 2 Minimum-spanning network displaying evolutionary
relationships among the 42 Drupadia theda mtDNA haplotypes (see Table 3 for haplotype distribution). Each circle corresponds to one haplotype; each line between two haplotypes corresponds to one mutation (see Table 2 for reference). A small black circle indicates a missing, one-mutational step haplotype.
Fig. 3 Genetic diversity (presented as haplotype diversity, Hd, vs.
nucleotide diversity, π) within Drupadia theda sampled populations.
Fig. 4 Relation between the observed haplotype diversity and the
number of individuals of Drupadia theda recorded per transect and per day within each sample (Spearman’s coefficient = 0.394, P = 0.260).
D I S T U R B A N C E I M P A C T O N B U T T E R F L Y P O P U L A T I O N G E N E T I C S 2075
represent postdisturbance immigration or rare haplotypes that were not encountered in B2-97.
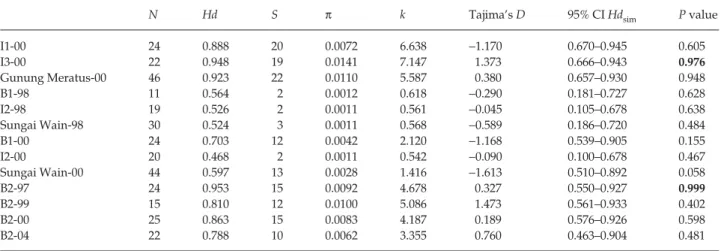
Tajima’s D neutrality test revealed no significant devi-ation from neutral expectdevi-ations in any sample (Table 4, all
P > 0.05). H test revealed significantly higher values of
haplotype diversity in I3-00, and in B2-97 compared to those
expected under the neutral coalescent process (Table 4). The analysis of sequence polymorphism using both Tajima’s
D test and Depaulis & Veuille’s H test did not reveal a
significant departure from neutral expectations in any of the disturbed landscapes after the 1997/1998 ENSO-induced drought and fires.
Table 3 Distribution of 42 haplotypes in Drupadia theda populations. N, number of individuals sequenced per sample; h, total number of
haplotypes per sample
Gunung Meratus Sungai Wain Wanariset
I1-00 I3-00 B1-98 B1-00 I2-98 I2-00 B2-97 B2-98 B2-99 B2-00 B2-04 Overall
H1 1 — 7 12 12 14 2 2 1 1 3 55 H2 — 3 3 6 6 5 3 — 3 8 — 37 H3 1 2 — — — — 1 — 2 4 9 19 H4 1 — — 2 — — 2 — — 3 3 11 H5 5 2 — — — — 4 — — — — 11 H6 1 3 — — — — — — — — — 4 H7 — 2 — — — — 2 — — — — 4 H8 — 1 — — — — — — — — — 1 H9 — 1 — — — — — — — — — 1 H10 6 3 — — — — — — — — — 9 H11 — 1 — — — — — — — — — 1 H12 — 1 — — — — — — — — — 1 H13 — 1 — — — — — — — — — 1 H14 4 1 — — — — — — — — — 5 H15 — 1 — — — — — — — — — 1 H16 1 — — — — — — — — — — 1 H17 1 — — — — — — — — — — 1 H18 1 — — — — — — — — — — 1 H19 1 — — — — — — — — — — 1 H20 1 — — — — — 1 — — — — 2 H21 — — 1 1 — — — — — — — 2 H22 — — — 1 — — — — — — — 1 H23 — — — 1 — — — — — — — 1 H24 — — — 1 — — — — — — — 1 H25 — — — — 1 — — — — — — 1 H26 — — — — — 1 — — — — — 1 H27 — — — — — — 1 — — — — 1 H28 — — — — — — 2 — — — — 2 H29 — — — — — — 1 — — — — 1 H30 — — — — — — 1 — — — — 1 H31 — — — — — — 1 — — — — 1 H32 — — — — — — 1 — — — — 1 H33 — — — — — — 1 — — — — 1 H34 — — — — — — 1 — — — — 1 H35 — — — — — — — — 6 2 2 10 H36 — — — — — — — — 2 1 — 3 H37 — — — — — — — — 1 1 — 2 H38 — — — — — — — — — 3 — 3 H39 — — — — — — — — — 1 — 1 H40 — — — — — — — — — 1 — 1 H41 — — — — — — — — — 4 4 H42 — — — — — — — — — 1 1 N 24 22 11 24 19 20 24 2 15 25 22 208 h 12 13 3 7 3 3 15 1 6 10 6 26
2076 C . F A U V E L O T , D . F . R . C L E A R Y and S . B . J . M E N K E N
Population structure
Over all pairwise comparisons, ΦST estimates ranged from negative to 0.654 (Table 5). Within regions at time t, none of the pairwise ΦST were significant after sequential Bonferroni adjustment of the significance level (within Gunung Meratus in 2000, ΦST = 0.092, P = 0.018; within Sungai Wain in 1998, ΦST = −0.152, P = 0.883; in 2000, ΦST = 0.015, P = 0.302). In 2000, 32.63% of the total variance was attributed to variation among the five landscapes (global ΦST = 0.317, P < 0.001; Table 6). However, the genetic variation in 2000 did not appear significantly associated with the three regions, Gunung Meratus, Sungai Wain and Wanariset (among group genetic variance = 0.909, P = 0.063). After Bonferroni corrections, the Wanariset population sampled in 1997 (B2-97) did not appear significantly different from Gunung Meratus populations (I1 & I3) sampled in 2000, but the P values were lower than 0.01 (ΦST = 0.118, P = 0.005, and ΦST = 0.109, P = 0.009, respectively; Table 5). Within Wanariset, genetic divergences between years appeared significant between 2000 and 2004 (ΦST = 0.222, P = 0.001), but not significant after Bonferroni correction between 1997 and 1999 (ΦST = 0.102, P = 0.030), and between 1999 and 2000 (ΦST = 0.075, P = 0.062). Also, no significant genetic divergence was observed within Sungai Wain landscapes between 1998 and 2000 (all P > 0.05). Interestingly, no significant divergence was observed in Wanariset between 1997 and 2004 samples (ΦST = 0.045, P = 0.091). Amongst Wanariset (B2) and the two sampled landscapes from Sungai Wain (B1 and I2), 9.59% of the genetic variance was attributed to temporal variation among years within landscapes (P = 0.001; Table 6).
The genetic divergences found amongst D. theda samples (with the exception of B2-98) are visualized with pairwise ΦST estimates using a two-dimensional non-metric MDS in Fig. 5. This method gives a good representation of the data with a stress value of 0.019. The MDS graphically illustrates the evolution of patterns of genetic divergences within as well as between populations. It depicts the increase of genetic divergence between B1 and I2 from 1998 to 2000, and the decline of genetic divergence between Wanariset (B2) and Sungai Wain (B1 + I2) from 1997 to 2000. It also illustrates the temporal evolution of genetic composition within Wanariset.
Table 4 Genetic diversity and results of neutrality tests in populations of Drupadia theda. N, number of individuals; Hd, haplotype diversity
(Nei 1987); S, number of polymorphic sites; π, nucleotide diversity (Nei 1987); and k, mean number of pairwise nucleotide differences between individuals (Tajima 1983). For Tajima’s D test (Tajima 1989), the value of D in reported. For the H test (Depaulis & Veuille 1998), the 95% confidence interval (CI) of simulated values of haplotype diversity based on the number of polymorphic sites under neutrality is reported, as well as the probability that Hdsim < Hdobs (see Material and methods). Significant departures from neutral expectations are indicated in bold
N Hd S π k Tajima’s D 95% CI Hdsim P value
I1-00 24 0.888 20 0.0072 6.638 −1.170 0.670–0.945 0.605 I3-00 22 0.948 19 0.0141 7.147 1.373 0.666–0.943 0.976 Gunung Meratus-00 46 0.923 22 0.0110 5.587 0.380 0.657–0.930 0.948 B1-98 11 0.564 2 0.0012 0.618 −0.290 0.181–0.727 0.628 I2-98 19 0.526 2 0.0011 0.561 −0.045 0.105–0.678 0.638 Sungai Wain-98 30 0.524 3 0.0011 0.568 −0.589 0.186–0.720 0.484 B1-00 24 0.703 12 0.0042 2.120 −1.168 0.539–0.905 0.155 I2-00 20 0.468 2 0.0011 0.542 −0.090 0.100–0.678 0.467 Sungai Wain-00 44 0.597 13 0.0028 1.416 −1.613 0.510–0.892 0.058 B2-97 24 0.953 15 0.0092 4.678 0.327 0.550–0.927 0.999 B2-99 15 0.810 12 0.0100 5.086 1.473 0.561–0.933 0.402 B2-00 25 0.863 15 0.0083 4.187 0.189 0.576–0.926 0.598 B2-04 22 0.788 10 0.0062 3.355 0.760 0.463–0.904 0.481
Fig. 5 Non-metric multidimensional scaling ordination of Drupadia
theda populations based on ΦST values estimated between samples using both haplotype frequencies and molecular divergence of mtDNA sequences. Samples from the same landscape are connected by a line. Dash lines encircle regions.
D I S T U R B A N C E I M P A C T O N B U T T E R F L Y P O P U L A T I O N G E N E T I C S 2077
Discussion
mtDNA control region sequence polymorphism in
Drupadia theda
Amongst 208 Drupadia theda individuals and the 509-bp mtDNA fragment analysed (CR+ 12S 5′ end), we identified 42 haplotypes, including alignment gaps; the overall nucleotide diversity was 0.0069. When analysing the same mtDNA region as assessed by Vila & Björklund (2004), i.e. exclusively the CR 5′ end prior to the homopolymer, we found a much higher nucleotide diversity in D. theda (325 bp; π = 0.011) than in the two nymphalid butterflies
Erebia triaria (361 bp; π = 0.0044) and Erebia palarica (354 bp;
π = 0.0005) (Vila & Björklund 2004). Among the 42 haplotypes, one group of haplotypes was highly divergent compared to the rest of the haplotypes (group 3; H6, H8, H9, and H11, see Fig. 2). The seven individuals carrying these divergent
haplotypes might possess an ancient mitochondrial variant preserved in the Gunung Meratus region, belong to a cryptic species, or be of hybrid origin. The analyses of the COI sequences revealed that the sequence divergence between related species (Drupadia theda and Drupadia ravindra) was nearly fivefold the divergence found between indi-viduals carrying haplotypes of each of the groups 1 and 3. Moreover, we did not find evidence of wing pattern differences between the individuals belonging to different groups. Therefore, the lack of evidence for the occurrence of cryptic species or hybrids leaded us to maintain all sequenced haplotypes in the data set. Further investigations on male genitalia and other genetic markers will be needed to be more conclusive about the origin of this divergent group of haplotypes. Although the utility of the mtDNA CR for species-level phylogenies and population-level studies in insects remains controversial (Taylor et al. 1993; Zhang & Hewitt 1997; Caterino et al. 2000), our results on sequence
Table 5 Pairwise ΦST estimates between Drupadia theda populations (above the diagonal). Significance levels are indicated below the
diagonal as *** if significant after adjustment of the significance level α = 0.05 according to the sequential Bonferroni correction (corresponding ΦST values are indicated in bold), ** for P < 0.01, * for P < 0.05, and NS for P > 0.05
Table 6 Results of amova for among-population differences and population structure in relation to the spatial (according to geographic
regions) and temporal (according to landscapes) grouping. The analysis partitions total molecular variance into different components, whose significance was obtained by randomization after 10 000 permutations
Gunung Meratus Sungai Wain Wanariset
I1-00 I3-00 B1-98 B1-00 I2-98 I2-00 B2-97 B2-99 B2-00 B2-04
G. Meratus I1-00 0.092 0.604 0.532 0.643 0.653 0.118 0.219 0.294 0.089 I3-00 * 0.370 0.341 0.423 0.435 0.109 0.161 0.173 0.158 S. Wain B1-98 *** *** −0.015 −0.052 −0.053 0.413 0.317 0.226 0.602 B1-00 *** *** NS 0.003 0.015 0.334 0.255 0.148 0.513 I2-98 *** *** NS NS −0.043 0.458 0.387 0.259 0.642 I2-00 *** *** NS NS NS 0.470 0.401 0.275 0.654 Wanariset B2-97 ** ** *** *** *** *** 0.102 0.108 0.045 B2-99 *** ** *** *** *** *** * 0.075 0.126 B2-00 *** *** ** ** *** *** * 0.222 B2-04 *** *** *** *** *** *** NS * ***
Population structure tested d.f. Variance components
% of variance
explained P value
2000 only, 5 landscapes (I1, I2, I3, B1, B2), no grouping
Among populations 4 Va 0.874 32.63 < 0.0001
Within populations 110 Vb 1.788 67.17 —
2000 only, 5 landscapes (I1, I2, I3, B1, B2), 3 groups (Gunung Meratus, Sungai Wain, Wanariset)
Among groups 2 Va 0.909 32.06 0.063
Among populations within groups 2 Vb 0.138 4.88 0.017
Within populations 110 Vc 1.788 63.06 < 0.0001
Temporal: 3 landscapes (I2, B1, B2), 3 groups (Gunung Meratus, Sungai Wain, Wanariset)
Among groups 2 Va 0.609 27.57 0.023
Among populations within groups 6 Vb 0.212 9.59 0.001
2078 C . F A U V E L O T , D . F . R . C L E A R Y and S . B . J . M E N K E N variability of the mtDNA control region in D. theda suggest
that this molecular marker possesses a sufficient amount of polymorphism to conduct population genetic surveys at the spatial scales studied, in line with the results of the Vila & Björklund (2004) study on various species of Lepidoptera.
Genetic diversity vs. disturbance
Amongst D. theda sampled populations, the observed genetic diversity was spatially and temporally heterogeneous. Indeed, in 2000, levels of genetic diversity were relatively high in Gunung Meratus and Wanariset compared to those in Sungai Wain. Similarly, temporal changes were observed in the Wanariset population between 1997 and 2004. The Wanariset landscape B2 is located in the Wanariset Samboja Research Forest, which is not situated in a national park or reserve, but on land protected for research purposes. In 1997, the Wanariset forest presented a mosaic of forest in an advanced stage of regeneration together with primary dipterocarp forest (Slik et al. 2002) because it had already partially burned during the 1982/1983 ENSO event. Although numbers of D. theda recorded in 1997 in Wanariset per transect and per day were two to five times lower than reported in Gunung Meratus landscapes, levels of genetic diversity were comparable in these forests. In 1998, a massive population size reduction was observed in Wanariset, as the number of individuals recorded per transect and per day decreased by a factor of 10. This major bottleneck was obviously linked with the 1997/1998 ENSO-induced fires (Cleary & Grill 2004). Indeed, during the 1997/1998 win-ter, the Wanariset forest almost entirely (> 90%) burned (Cleary & Grill 2004). The D. theda that survived the fires were exclusively restricted to a c. 50-ha unburned forest fragment (namely W03 in Cleary & Grill 2004).
The Sungai Wain landscapes (B1 and I2) have been sampled in an originally pristine and protected forest (the Sungai Wain Nature Reserve) of 10 000 ha of lowland mixed dipterocarp rainforest with extensive swamp areas in low lying areas, similar to what was observed in Gunung Meratus protected forest. Despite its protected status, the forest has suffered considerable encroachment from adjacent human settlements, and fires early in 1998 destroyed about two-thirds of the pristine forest so that by mid 1998 only about 3500 ha of pristine forest remained. In 1998, both sampled landscapes B1 and I2 showed very low levels of genetic diversity combined with low number of recorded individuals. In 2000, population sizes increased while the levels of genetic diversity remained lower than in the pris-tine forest located in a large unburned area (I1). Because we lack temporal data from 1997, we do not have evidence that the low levels of genetic diversity originated from bottlenecks. However, because (i) the two landscapes were sampled in an originally pristine and protected forest, (ii)
D. theda densities in Sungai Wain forest were much lower
than in Gunung Meratus pristine forest, (iii) a population crash was observed in Wanariset following 1997/1998 ENSO-induced fires, and (iv) a population size increase was observed between 1998 and 2000 in both B1 and I2, the low levels of genetic diversity observed in 1998 probably result from population bottlenecks following population crashes due to the 1997/1998 ENSO-induced disturbance. The similar, low genetic diversity values observed in B1 and I2 further suggest that the drought associated with the fires had as negative an impact on the genetic diversity of
D. theda as the fire itself. Indeed, while I2 was located in a
small unburned isolated pristine forest, it was surrounded by burned forest. The ENSO-induced drought detri-mentally impacted available water and trophic resources (Cleary & Grill 2004). Such effects are known to have caused local extinctions of several fig wasp species in an unburned forest isolate in northern Borneo due to disrup-tion of their primary food resources (Harrison 2000). This result is further in agreement with the impact of drought on species richness (Cleary 2003; Cleary & Genner 2004; Cleary et al. 2004). Yet, it is still not clear if the drought affected the butterflies directly, or indirectly, through its host plants or mutualist ants. The latter was the case with most UK populations of the lycaenid Polyommatus bellargus that were affected by severe bottlenecks in the late 1970s when a drought caused its unique host plant (Hippocrepis
comosa) to wilt (Harper et al. 2003). Nevertheless, since D. theda feeds on a variety of host plants, it is unlikely that the
drought affected all the species host plants. Still, D. theda population bottlenecks could have been caused by popu-lation size reductions (or complete disappearance) of its mutualist ants of the genus Crematogaster (morphospecies A and B; Seufert & Fiedler 1996) which could be associated with humid soil conditions, similar to Lasius niger, the host ant of the lycaenid Plebejus argus (Seymour et al. 2003). Our results on genetic diversity in pre- and postdisturbed populations suggest that the ENSO-related population bottle-necks, together with genetic drift in small populations (possibly in combination with selection and variance in reproductive success), resulted in massive losses of haplotypes, leading to genetic compositions with one or two highly frequent haplotypes and a few rare haplotypes. Interestingly, the two samples showing the highest haplotype diversity values were nonpristine; I3-00 had been logged in 1993/94, and B2-97 partially burned during the 1982/83 ENSO event. Moreover within these two samples, a significant deviation from neutrality was detected as higher haplotype diversity than observed under the hypothesis of neutrality and stable population size. These higher values may originate from sample size bias or reflect nonequilibrium conditions within these two pre-viously disturbed forests. Interestingly, higher levels of species diversity were found in the same logged forest than the proximate pristine forest of Gunung Meratus (Cleary
D I S T U R B A N C E I M P A C T O N B U T T E R F L Y P O P U L A T I O N G E N E T I C S 2079 2003). The high genetic diversity found in the logged forest
may thus be suggestive of similar processes acting on genetic diversity and species diversity. However, because of the lack of replicates (relative to both species and logged areas), more investigations are needed to conclude that a species-genetic diversity correlation (Vellend 2003) is actually occurring in disturbed environments.
Genetic recovery following bottlenecks
A particularly interesting result from the short-term impact of droughts and fires on D. theda genetic diversity concerns the differences observed in genetic diversity patterns following the bottlenecks. Two years after the fires, levels of genetic diversity within Sungai Wain did not significantly increase, despite observed population expansions. On the contrary, in Wanariset, the number of individuals recorded in 1999 was similar to that in 1997, and levels of genetic diversity were reaching pre-ENSO levels. From the 40 recorded individuals in 1999, 39 were observed along the transect situated in the unburned fragment (W03 described in Cleary & Grill 2004). In 2000, high population densities were observed in Wanariset, although the recorded D. theda were no longer restricted to the W03 pristine fragment but were also recorded in high densities along transects in partially burned forest (e.g. W05 in Cleary & Grill (2004)).
In 1999, 2000, and 2004, new haplotypes were encountered in Wanariset, causing genetic diversity to rise. These new haplotypes most likely originated from incoming migrants because (i) none of these haplotypes were encountered in 1997 despite a large sampling effort (50% of recorded indi-viduals were randomly sequenced), (ii) the same sampling method was used during each sampling event to avoid sampling bias (Cleary 2003), and (iii) the sampling inten-sity conducted in the following years was not higher than in 1997 (50%, 37.5%, and 10.4% in 1998, 1999, and 2000, respectively). The rapid recovery of the genetic diversity of
D. theda in the Wanariset population is thereby certainly
due to an influx of genetic diversity through migration. Conversely, low levels of genetic diversity observed in Sungai Wain populations in 2000 may originate from sampling bias or the lack of incoming migrants with new haplotypes. However, the latter explanation is more likely given that similar sampling efforts were conducted in Sungai Wain and Wanariset in 2000 (11.5 and 10%, respec-tively, of recorded individuals were randomly sequenced). Because (i) Wanariset and Sungai Wain forests were simi-larly affected by the 1997/1998 ENSO-induced distur-bance in terms of burning (Cleary et al. 2004) and (ii) small pristine fragments remained unburned in both forests (although much smaller in Wanariset), the faster recovery rate in the Wanariset population than in Sungai Wain popu-lations may be due to their different proximities to larger
patches of unburned forest. In particular, the Wanariset forest is contiguous with the large (71 905 ha) Bukit Suharto Protected Forest Reserve to the north. Although most (93%) of this reserve also burned during the 1997/ 1998 ENSO event, an estimated 4800 ha escaped conflagra-tion (Hoffmann et al. 1999) and probably thus served as a source of migrants for the Wanariset population. The Sun-gai Wain forest, on the contrary, is isolated from proximate forest by the bay of Balikpapan and Balikpapan city itself to the west and south, and by various roads and settle-ments, as well as twice-burned forest (including Wanari-set) to the north and east (see Fig. 1). Thereby, the D. theda population expansion observed in I2 was not sufficient to raise genetic diversity levels in this isolated forest.
High levels of genetic diversity in documented bottle-necked populations are not uncommon and originate from sufficient allelic richness immediately after the bottlenecks (Brookes et al. 1997; Queney et al. 2000; Lefèvre et al. 2004) or from new haplotypes arriving via postbottleneck immig-rations (Hansson et al. 2000; Keller et al. 2001; Whitehouse & Harley 2001; Colson & Hughes 2004; Takami et al. 2004). In the latter case, the speed at which the recovery of the genetic diversity occurs depends on the dispersal capacities of the species, and whether the immigrants come from one (propagule pool) or more (migrant pool) source populations. Our study suggests that the degree of geographic isolation of the local population relative to source populations is as well a key factor in driving the recovery of genetic variation following bottlenecks in natural populations.
Acknowledgements
All field assistants in Kalimantan are thanked for their help. We further thank W. van Ginkel for sorting all the materials and P. Kuperus, B. Voetdijk, and Y. Jimenez for laboratory assistance. We thank M. Vila for her valuable advice concerning PCR amplifica-tions and J.A.J. Breeuwer, G. Lecaillon, and K.T.C.A. Peijnenburg who contributed to this work through insightful discussions. S. Planes, B. Emerson, and four anonymous reviewers provided helpful comments on earlier versions of the manuscript. This work was supported by grant 895.100.029 of the Netherlands Foundation for the Advancement of Tropical Research (NWO-WOTRO), within the Priority Programme ‘Biodiversity in Disturbed Ecosystems’.
References
Boom R, Sol CJA, Salimans MMM et al. (1990) Rapid and simple method for purification of nucleic acids. Journal of Clinical
Micro-biology, 28, 495–503.
Brookes MI, Graneau YA, King P et al. (1997) Genetic analysis of founder bottlenecks in the rare British butterfly Plebejus argus.
Conservation Biology, 11, 648–661.
Brown KA, Gurevitch J (2004) Long-term impacts of logging on forest diversity in Madagascar. Proceedings of the National
Aca-demy of Sciences, USA, 101, 6045–6049.
Cannon CH, Peart DR, Leighton M (1998) Tree species diversity in commercially logged Bornean rain forest. Science, 281, 1366–1368.
2080 C . F A U V E L O T , D . F . R . C L E A R Y and S . B . J . M E N K E N
Caterino MS, Cho S, Sperling FAH (2000) The current state of insect molecular systematics: a thriving tower of Babel. Annual
Review of Entomology, 45, 1–54.
Chakraborty R, Nei M (1976) Bottleneck effects on average heter-ozygosity and genetic distance with the stepwise mutation model. Evolution, 31, 347–356.
Cleary DFR (2003) An examination of scale of assessment, logging and ENSO-induced fires on butterfly diversity in Borneo.
Oeco-logia, 135, 313–321.
Cleary DFR (2004) Assessing the use of butterflies as indicators of logging in Borneo at three taxonomic levels. Journal of Economical
Entomology, 97, 429–435.
Cleary DFR, Genner MJ (2004) Changes in rain forest butterfly diversity following major ENSO-induced fires in Borneo. Global
Ecology and Biogeography, 13, 129–140.
Cleary DFR, Grill A (2004) Butterfly response to severe ENSO-induced forest fires in Borneo. Ecological Entomology, 29, 666– 676.
Cleary DFR, Mooers AØ (2004) Butterfly species richness and community composition in forests affected by ENSO-induced burning and habitat isolation in Borneo. Journal of Tropical
Eco-logy, 20, 359–367.
Cleary DFR, Priadjati A (2005) Vegetation responses to burning in a rain forest in Borneo. Plant Ecology, 177, 145–163.
Cleary DFR, Mooers AØ, Eichhorn KAO et al. (2004) Diversity and community composition of butterflies and odonates in an ENSO-induced fire affected habitat mosaic: a case study from East Kalimantan, Indonesia. Oikos, 105, 426–446.
Colson I, Hughes RN (2004) Rapid recovery of genetic diversity of dogwhelk (Nucella lapillus L.) populations after local extinction and colonization contradicts predictions from life-history char-acteristics. Molecular Ecology, 13, 2223–2233.
Depaulis F, Veuille M (1998) Neutrality tests based on the distri-bution of haplotypes under an infinite-site model. Molecular
Biology and Evolution, 15, 1788–1790.
Elliot JN (1992) The Butterflies of the Malay Peninsula. Malayan Nature Society Kuala Lumpur, Malaysia.
England PR, Osler GHR, Woodworth LM et al. (2003) Effects of intense versus diffuse population bottleneck. Conservation
Genetics, 4, 595–604.
Excoffier L, Smouse PE, Quattro JM (1992) Analysis of molecular variance inferred from metric distances among DNA haplo-types: application to human mitochondrial DNA restriction data. Genetics, 131, 497–491.
Frankham R (1995) Inbreeding and extinction: a threshold effect.
Conservation Biology, 9, 792–799.
Frankham R, Ballou JD, Briscoe DA (2002) Introduction to
Con-servation Genetics. Cambridge University Press, Cambridge, UK.
Hall TA (1999) bioedit: a user-friendly biological sequence align-ment editor and analysis program for Windows 95/98/NT.
Nucleic Acids Symposium Series, 41, 95–98.
Hamer KC, Hill JK, Benesick S et al. (2003) Ecology of butterflies in natural and selectively logged forests of northern Borneo: the importance of habitat heterogeneity. Journal of Applied Ecology, 40, 150–162.
Hansson B, Bensch S, Hasselquist D et al. (2000) Increase of genetic variation over time in a recently founded population of great reed warblers (Acrocephalus arundinaceus) revealed by micro-satellites and DNA fingerprinting. Molecular Ecology, 9, 1529– 1538.
Harper GL, Maclean N, Goulson D (2003) Microsatellite markers to assess the influence of population size, isolation and
demo-graphic change on the genetic structure of the UK butterfly
Polyommatus bellargus. Molecular Ecology, 12, 3349–3357.
Harrison RD (2000) Repercussions of El Niño: drought causes extinction and the breakdown of mutualism in Borneo.
Proceed-ings of the Royal Society of London. Series B, Biological Sciences, 267,
911–915.
Hillis DM, Moritz C (1990) Molecular Systematics. Sinauer Associ-ates, Sunderland, Massachusetts.
Hoffmann AA, Hinrichs A, Siegert F (1999) Fire damage in East Kalimantan in 1997/98 related to land use and vegetation classes: satellite radar inventory results and proposals for further actions. Integrated Forest Fire Management Project, Samarinda, East Kalimantan, Indonesia. IFFM – SFMP Report No. 1a, pp 44. Holmgren M, Scheffer M, Ezcurra E, Gutiérrez JR, Mohren GMJ (2001) El Niño effects on the dynamics of terrestrial ecosystems.
Trends in Ecology & Evolution, 16, 89–94.
Hudson RR (1990) Gene genealogies and the coalescent process. In: Oxford Surveys in Evolutionary Biology (eds Futuyma D, Antonovics J), pp. 1–44. Oxford University Press, Oxford. Igarashi S, Fukada H (1997) The Life Histories of Asian Butterflies,
Vol. 1. Tokai University Press, Tokyo, Japan.
Igarashi S, Fukada H (2000) The Life Histories of Asian Butterflies, Vol. 1. Tokai University Press, Tokyo, Japan.
Keller LF, Jeffery KJ, Arcese P et al. (2001) Immigration and the ephemerality of a natural population bottleneck: evidence from molecular markers. Proceedings of the Royal Society of London.
Series B, Biological Sciences, 268, 1387–1394.
Kruskal JB, Wish M (1978) Multidimensional Scaling. Sage Publica-tions, London.
Kumar S, Tamura K, Nei M (1993) MEGA: Molecular Evolutionary Genetics Analysis. Pennsylvania State University, University
Park, Pennsylvania.
Laurance WF (2003) Slow burn: the insidious effects of surface fires on tropical forests. Trends in Ecology & Evolution, 18, 209–212. Lefèvre F, Bady B, Fallour-Rubio D, Ghosn D, Bariteau M (2004)
Impact of founder population, drift and selection on the genetic diversity of a recently translocated tree population. Heredity, 93, 5542–5550.
Lewis OT (2001) Effects of experimental selective logging on tropical butterflies. Conservation Biology, 15, 389–400.
Mackey RL, Currie DJ (2000) A re-examination of the expected effects of disturbance on diversity. Oikos, 88, 483–493. Malcolm JR, Ray JC (2000) Influence of timber extraction routes on
Central African small mammals communities, forest structure, and tree diversity. Conservation Biology, 14, 1623–1638. Nei M (1987) Molecular Evolutionary Genetics. Columbia University
Press, New York.
Nicholas KB, Nicholas HB (1997) GENEDOC: a tool for editing and
anno-tating multiple sequence alignments. Distributed by the authors.
Queney G, Ferrand N, Marchandeau S et al. (2000) Absence of a genetic bottleneck in a wild rabbit (Oryctolagus cuniculus) popu-lation exposed to a severe viral epizootic. Molecular Ecology, 9, 1253–1264.
Rice WR (1989) Analysing tables of statistical tests. Evolution, 43, 223–225.
Robinson GS, Ackery PR, Kitching IJ, Beccaloni GW, Hernández LM (2001) Hostplants of the Moth and Butterfly Caterpillars of the
Oriental Region. The Natural History Museum, London, and
United Selangor Press Sdn Bhd, Kuala Lumpur, Malaysia. Rogers AR, Harpending H (1992) Population growth makes
waves in the distribution of pairwise genetic differences.
D I S T U R B A N C E I M P A C T O N B U T T E R F L Y P O P U L A T I O N G E N E T I C S 2081
Rozas J, Sanchez-Delbarrio JC, Messeguer X, Rozas R (2003) dnasp, DNA polymorphism analyses by the coalescent and other methods. Bioinformatics, 19, 2496–2497.
Sakai AK, Allendorf FW, Holt JS et al. (2001) The population bio-logy of invasive species. Annual Review of Ecological Systematics, 32, 305–332.
Schneider S, Roessli D, Excoffier L (2000) ARLEQUIN version 2.000: A software for population genetics data analysis. Genetics and
Bio-metry Laboratory, Department of Anthropology, University of Geneva, Geneva, Switzerland.
Seufert P, Fiedler K (1996) Life-history diversity and local co-existence of three closely related lycaenid butterflies (Lepidoptera: Lycaenidae) in Malaysian rainforests. Zoologischer Anzeiger, 234, 229–239.
Seymour AS, Gutiérrez D, Jordano D (2003) Dispersal of the lycae-nid Plebejus argus in response to patches of its mutualist ant
Lasius niger. Oikos, 103, 162–174.
Siegert F, Ruecker G, Hinrichs A, Hoffmann AA (2001) Increased damage from fires in logged forests during droughts caused by El Nino. Nature, 414, 437–440.
Simon C, Frati F, Beckenbach A et al. (1994) Evolution, weighting, and phylogenetic utility of mitochondrial gene sequences and a compilation of conserved polymerase chain reaction primers.
Annals of the Entomological Society of America, 87, 651–701.
Slatkin M, Hudson RR (1991) Pairwise comparisons of mito-chondrial DNA sequences in stable and exponentially growing populations. Genetics, 129, 555–562.
Slik JWF, Verburg RW, Kessler PJA (2002) Effects of fire and selective logging on the tree species composition of lowland dipterocarp forest in East Kalimantan, Indonesia. Biodiversity
and Conservation, 11, 85–98.
Tajima F (1983) Evolutionary relationship of DNA sequences in finite populations. Genetics, 105, 437–460.
Tajima F (1989) Statistical method for testing the neutral mutation hypothesis by DNA polymorphism. Genetics, 123, 585–595. Takami Y, Koshio C, Ishii M et al. (2004) Genetic diversity and
structure of urban populations of Pieris butterflies assessed using
amplified fragment length polymorphism. Molecular Ecology, 13, 245–258.
Taylor MFJ, McKechnie SW, Pierce N, Kreitman M (1993) The lepidopteran mitochondrial control region: structure and evolu-tion. Molecular Biology and Evolution, 10, 1259–1272.
Thiollay JM (1992) Influence of selective logging on bird species diversity in a Guianan rain forest. Conservation Biology, 6, 47–63. Van Nieuwstadt MGL, Sheil D, Kartawinata K (2001) The ecological consequences of logging in the burned forests of East Kalimantan, Indonesia. Conservation Biology, 15, 1183–1186.
Vellend M (2003) Island biogeography of genes and species.
American Naturalist, 162, 358–365.
Vila M, Björklund M (2004) The utility of the neglected mitochon-drial control region for evolutionary studies in Lepidoptera (Insecta). Journal of Molecular Evolution, 58, 280–290.
Whitehouse AM, Harley EH (2001) Post-bottlenecked genetic diversity of elephant populations in South Africa, revealed using microsatellite analysis. Molecular Ecology, 10, 2139–2149. Willott SJ, Lim DC, Compton SG, Sutton SL (2000) Effects of
selective logging on the butterflies of a Bornean rainforest.
Conservation Biology, 15, 1055–1065.
Wright S (1931) Evolution in Mendelian populations. Genetics, 28, 114–138.
Zhang DX, Hewitt GM (1997) Insect mitochondrial control region: a review of its structure, evolution, and usefulness in evolutionary studies. Biochemical Systematics and Ecology, 25, 99–120.
Dr Cécile Fauvelot is a molecular ecologist who has worked on both coral reef fish and rainforest butterfly population genetics. She is primarily interested in how dispersal and habitat changes affect the population structure in these groups. Dr Daniel Cleary is a community ecologist interested in explaining the spatial patterns of diversity. This work is part of a project headed by Professor Steph Menken that aims principally to understand the impact of disturbance on biotic assemblages.