HAL Id: hal-01534024
https://hal.archives-ouvertes.fr/hal-01534024
Submitted on 7 Jun 2017
HAL is a multi-disciplinary open access archive for the deposit and dissemination of sci-entific research documents, whether they are pub-lished or not. The documents may come from teaching and research institutions in France or abroad, or from public or private research centers.
L’archive ouverte pluridisciplinaire HAL, est destinée au dépôt et à la diffusion de documents scientifiques de niveau recherche, publiés ou non, émanant des établissements d’enseignement et de recherche français ou étrangers, des laboratoires publics ou privés.
Multi-photon Direct Laser Writing and 3D Imaging of
Polymeric Freestanding Architectures for Cell
Colonization
Angelo Accardo, Marie-Charline Blatché, Rémi Courson, Isabelle Loubinoux,
Christophe Thibault, Laurent Malaquin, Christophe Vieu
To cite this version:
Angelo Accardo, Marie-Charline Blatché, Rémi Courson, Isabelle Loubinoux, Christophe Thibault, et al.. Multi-photon Direct Laser Writing and 3D Imaging of Polymeric Freestanding Architectures for Cell Colonization. Small, Wiley-VCH Verlag, 2017, 13 (27), pp.1700621. �10.1002/smll.201700621�. �hal-01534024�
DOI: 10.1002/ ((please add manuscript number))
Article type: Full Paper
Multi-photon Direct Laser Writing and 3D Imaging of Polymeric Freestanding Architectures for Cell Colonization
Angelo Accardo*, Marie-Charline Blatché, Rémi Courson, Isabelle Loubinoux, Christophe Thibault, Laurent Malaquin, Christophe Vieu
Dr. A. Accardo, Dr. M.-C. Blatché, Dr. R. Courson, Dr. C. Thibault, Dr. L. Malaquin, Prof. C. Vieu
LAAS-CNRS, Université de Toulouse, CNRS, F-31400, Toulouse, France Dr. C. Thibault, Prof. C. Vieu
Université de Toulouse, Institut National des Sciences Appliquées - INSA, F-31400 Toulouse, France
Dr. I. Loubinoux
ToNIC, Toulouse NeuroImaging Center, Université de Toulouse, Inserm, UPS, France Corresponding Author
Dr. A. Accardo, LAAS-CNRS, Université de Toulouse, CNRS, F-31400, Toulouse, France E-mail: [email protected]
Keywords: Direct laser writing, 3D fabrication, Neuroblastoma cell, Multi-photon confocal imaging, Light sheet fluorescence microscopy
Abstract text.
The realization of 3D architectures for the study of cell growth, proliferation and differentiation is a task of fundamental importance for both technological and biological communities involved in the development of biomimetic cell culture environments. Here we report the combination of 3D freestanding scaffolds realized by multi-photon direct laser writing (DLW), seeded with neuroblastoma cells, and their multi-technique characterization using advanced 3D fluorescence imaging techniques. The high accuracy of the fabrication process (≈ 200 nm) provides a much finer control of the meso-, micro- and nano-scale features compared to other 3D printing technologies based on fused deposition modeling, inkjet printing, selective laser sintering or polyjet technology. Scanning electron microscopy
1 2 3 4 5 6 7 8 9 10 11 12 13 14 15 16 17 18 19 20 21 22 23 24 25 26 27 28 29 30 31 32 33 34 35 36 37 38 39 40 41 42 43 44 45 46 47 48 49 50 51 52 53 54 55 56 57 58 59 60
interconnections around the 3D architecture. On the other hand, the nature of the seeding in the inner core of the 3D scaffold, inaccessible by conventional SEM imaging, was unveiled by light sheet fluorescence microscopy and multi-photon confocal imaging which highlighted an optimal cell colonization both around and within the 3D scaffold as well as the formation of long neuritic extensions. The results open appealing scenarios for the use of the developed 3D fabrication/3D imaging protocols in several neuroscientific contexts.
1. Introduction
Since 1984, year in which the first patent about rapid prototyping based on stereolithography was filed,[1] the evolution of 3D fabrication techniques has enormously evolved and found
many applications in the biomedical area of research such as prosthetic implants,[2] organ
printing,[3,4] scaffolds for tissue engineering applications[5-7] and 3D models for disease/drug
investigation.[8] The main techniques employed for the realization of 3D architectures range
from fused deposition modeling/extrusion printing,[9,10] electrospinning,[11] ink-jet printing,[12]
polyjet technology,[13] selective laser sintering,[14] 3D bioprinting[15] to laser-assisted printing
systems.[16-23] From a technological point of view, although all these 3D fabrication
approaches provide great potential, many of them still present evident limitations such as fabrication speed, feature accuracy and versatility in terms of biocompatible materials that can be integrated in the fabrication setup.In the field of biology, and particular in neuroscience, it has been reported the possibility to guide neurite outgrowth and influence cell viability in neuronal cultures cultivated on 2D micro-structured surfaces.[24-28] Nevertheless, it is also true
that, in the long-term perspective of using these artificial supports for neural tissue engineering applications, where the role of cell guidance, cell placement and fine-tuning of cell-cell interaction is crucial, it would be desirable to have an evaluation of how cells behave in a more realistic/biomimetic 3D environment.
1 2 3 4 5 6 7 8 9 10 11 12 13 14 15 16 17 18 19 20 21 22 23 24 25 26 27 28 29 30 31 32 33 34 35 36 37 38 39 40 41 42 43 44 45 46 47 48 49 50 51 52 53 54 55 56 57 58 59 60 61 62
In this work we report the combination of advanced 3D fluorescence imaging techniques and 3D architectures realized by a two-photon polymerization[29-33] direct laser writing (DLW)
fabrication approach featuring a much higher level of accuracy at the meso-, micro- and nano-scale compared to other techniques such as single-photon stereolithography, extrusion based approaches, direct-ink writing and inkjet printing.[34,35] In order to assess the colonization
efficiency on and within the developed architectures, we choose a fast growing neuroblastoma cell line (N2A) known to express several properties of neurons such as the formation of neuritic extensions or interconnections.[36,37] This cell line represents thus an optimal
benchmark for evaluating the response of neural-like cells in the perspective of employing this 3D fabrication/3D characterization approach to develop architectures for bio-implantation purposes.[25] While the characterization of the cell morphology was performed using scanning
electron microscopy, the possibility to entirely access the inner core of the scaffold was ensured by exploiting two advanced 3D fluorescence imaging techniques: two-photon confocal imaging[38] (2PI) and light sheet fluorescence microscopy[39] (LSFM). These
technologies are well suited for the imaging of thick specimens and provided a detailed distribution of the cells both around and within the 3D architecture. Despite the presence of the intrinsic autofluorescence of the polymer employed for the 3D scaffold, the imaging protocols that we employed allowed us to depict a detailed scenario of the cell seeding throughout the whole 3D architecture with a high-density cell colonization both on the external shell and in the internal layers of the developed architecture. Furthermore, N2A cells showed also the ability to form freestanding networks and to generate long neuritic extensions. In summary, the combination of the proposed fabrication route with the advanced 3D imaging protocols provides, respectively, an ideal environment for neural-like cell cultures in three dimensions and an optimal 3D visualization routine of the scaffold colonization. Starting from these results it will be interesting to extend the use of such 3D scaffolds, along with more
1 2 3 4 5 6 7 8 9 10 11 12 13 14 15 16 17 18 19 20 21 22 23 24 25 26 27 28 29 30 31 32 33 34 35 36 37 38 39 40 41 42 43 44 45 46 47 48 49 50 51 52 53 54 55 56 57 58 59 60
tissue engineering.[25,41] Further, the proposed approach, both from a 3D fabrication and 3D
imaging point view, could serve as well as a 3D in-vitro model for evaluating the influence of neurodegenerative peptides, such as Amyloid-β[42-44] (Alzheimer’s disease) and
Alpha-synuclein[45] (Parkinson’s disease), on neural networks.
2. Results and discussion
Figure 1 illustrates the overall architecture of the 3D grid, whose fabrication protocol is reported in detail in the Experimental Section.
Figure 1 A: CAD design of the 3D scaffold; B: SEM micrograph of the 3D scaffold; C: Close-up on the micron-scaled cylindrical sub-units of the CAD design; D: Close-up on the micro- and nano-scale features of the 3D scaffold.
The architecture of the conceived 3D scaffold (whose overall dimension is of 300 (x) * 300 (y) * 300 (z) µm3) is made of cylindrical sub-units of 20 µm diameter, 60 µm horizontal spacing and 20 µm vertical spacing (Figure 1A,C). As evidenced by the comparison between
1 2 3 4 5 6 7 8 9 10 11 12 13 14 15 16 17 18 19 20 21 22 23 24 25 26 27 28 29 30 31 32 33 34 35 36 37 38 39 40 41 42 43 44 45 46 47 48 49 50 51 52 53 54 55 56 57 58 59 60 61 62
the CAD design (Figure 1A) and the SEM micrograph of the actual 3D architecture (Figure 1B), the direct laser writing technique features a high level of accuracy and reproducibility of the scaffold components, both at the meso- and micron-scale level. Further, in Figure 1D we show the effect of the adopted slicing and hatching fabrication configurations (Experimental section) on the nano-features morphology whose resolution (≈ 200 nm) is much higher compared to other 3D fabrication technologies.[9-19] The rationale behind the choice of the
adopted spacing and of the cylindrical sub-unit size parameters was to allow at the same time both an easy penetration of the neuroblastoma cell line and an optimal 3D imaging accuracy overwhelming the material intrinsic autofluorescence. Further, we used rough cylindrical shapes free from abrupt corners and characterized by a gradual curvature profile in order to provide to the cell an environment with less strong “artificial” features and closer to a putative natural host.
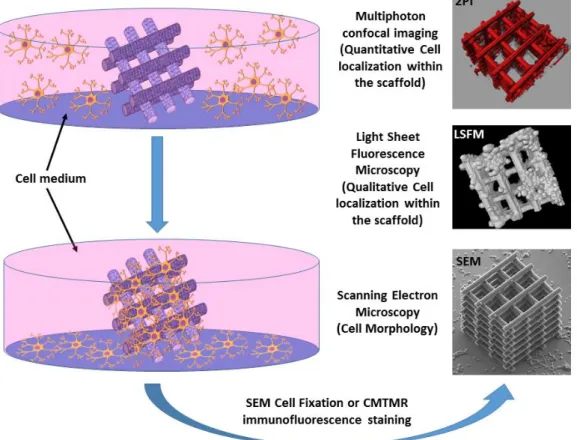
The general overview of the experimental approach developed in the framework of this research study is depicted in Figure 2. After the fabrication, the plasma-pretreatment, the UV sterilization and the application of functional biochemical coatings, the 3D scaffold was placed in a cell culture environment (Experimental section) where the N2A cells started to grow, proliferate and colonize the 3D architecture. Afterwards, the samples underwent different fixation protocols according to the desired imaging characterization. Indeed, in order to unveil the localization and the morphology of the cells not only around the 3D scaffold but also within the scaffold’s core, the conventional SEM characterization must be integrated with advanced 3D fluorescence imaging techniques able to “shine light” in the most inaccessible parts of the architecture.
1 2 3 4 5 6 7 8 9 10 11 12 13 14 15 16 17 18 19 20 21 22 23 24 25 26 27 28 29 30 31 32 33 34 35 36 37 38 39 40 41 42 43 44 45 46 47 48 49 50 51 52 53 54 55 56 57 58 59 60
Figure 2. Overall scenario of the developed experimental approach for cell colonization of the 3D scaffold and multi-technique imaging based on SEM, LSFM and 2PI.
Conventional confocal imaging of cells within a large architecture such as the one fabricated here is not trivial because of the intrinsic autofluorescence of the IP-DiP polymer employed during the fabrication (whose maximum emission is centred at 478 nm, under a 405 nm excitation, Figure S1 of the Supporting Information). In particular, the scattering of light travelling across thick samples, induced by a refractive index mismatch, can lead to different light excitation phenomena, causing a spread or a deviation of the excitation volume.[46,47] In
order to overcome these problematics as much as possible, we opted for two parallel approaches based on the use of a two-photon confocal imaging (2PI) setup and of a light sheet fluorescence microscopy (LSFM) one, both of them well suited for the imaging of samples up to about 1 mm size thanks to their deep sample penetration. In the first approach, near-infrared lasers induce two-photon excitation of fluorescent probes (following indeed the same principle of the two photon direct laser writing fabrication employed for the realization of the 3D scaffold) and at the same time minimize scattering in the sample. On the other hand,
1 2 3 4 5 6 7 8 9 10 11 12 13 14 15 16 17 18 19 20 21 22 23 24 25 26 27 28 29 30 31 32 33 34 35 36 37 38 39 40 41 42 43 44 45 46 47 48 49 50 51 52 53 54 55 56 57 58 59 60 61 62
LSFM is a fluorescence microscopy technique that, in contrast to conventional epifluorescence microscopy, employs a thin sheet of light (i.e. a laser beam focused only in one direction) in order to illuminate the sample perpendicularly to the direction of observation (Figure S2). Further, as only a tiny section of the sample is illuminated, such method reduces photobleaching and possible damages to the specimen although keeping a good level of resolution (thanks to a good optical sectioning) and a fast time acquisition (as samples are scanned by using a plane instead of a point).
In the following sections we show the achieved results coming from the multi-technique imaging of the developed 3D scaffold seeded with N2A cells, thus including: scanning electron microscopy (detailed insight on the cellular morphology, cellular adhesion, cellular distribution around the 3D architecture and morphology of the cellular extensions), light sheet fluorescence microscopy (qualitative scenario of the cell seeding within the 3D scaffold) and high-resolution two-photon confocal imaging (quantitative localization of the cells within the 3D scaffold and characterization of neuritic outgrowth). For comparison, seeding of N2A cells was performed as well on 2D micro-ridges surfaces and barely flat pedestals developed using the multi-photon direct laser writing technique and keeping the same fabrication parameters of the 3D scaffolds (material, slicing, hatching, laser power, fabrication speed, refer to Experimental section and Supporting Information).
2.1 2PI & LSFM imaging of the virgin 3D scaffolds and testing of the CMTMR staining.
Before seeding cells on the developed 3D architectures, we performed several imaging acquisitions of the virgin scaffolds to probe their autofluorescence emission range and we tested the CMTMR staining (see Experimental section), on cells cultured on flat glass supports to ensure the absence of a strong spectral emission overlapping between the fluorescent tracker and the IP-DiP polymer employed in the fabrication. Figures 3A,B show the emission coming from the 3D scaffold and highlights how IP-DiP polymer shows, as
1 2 3 4 5 6 7 8 9 10 11 12 13 14 15 16 17 18 19 20 21 22 23 24 25 26 27 28 29 30 31 32 33 34 35 36 37 38 39 40 41 42 43 44 45 46 47 48 49 50 51 52 53 54 55 56 57 58 59 60
expected (Figure S1), autofluorescence in the emission range 500-550 nm (Figure 3A), while being much more attenuated in the 565-610 nm range (Figure 3B).
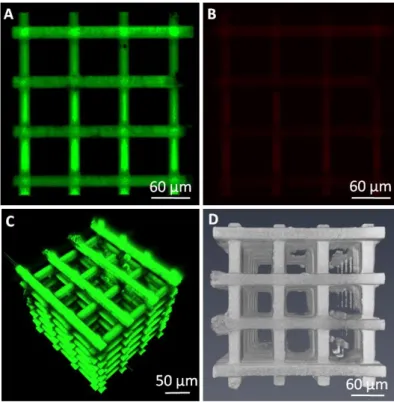
Figure 3. Fluorescent emission of IP-DiP polymer in the green (A) and red (B) channels; 3D reconstructions of the 3D scaffold by 2PI (C) and LSFM (D). (2PI: λexc = 820 nm, Emission collected in the 500-550 nm (green)
and 565-610 nm (red) spectral ranges; LSFM: λexc = 532 nm, Emission collected with a LP 593 nm filter)
In figure 3C,D the 3D architecture has been reconstructed by composing the z-slices acquired, respectively, by the 2PI and LSFM setup. Both the characterization approaches allowed imaging the whole object, although the LSFM configuration showed a lower level of resolution compared to 2PI as the cylindrical sections of the 3D scaffold look slightly squared. In order to probe the presence and the morphology of N2A cells not only around the scaffolds but also within the scaffold’s core, we stained the cells with the CellTracker™ Orange CMTMR fluorescent dye which is designed to freely pass only through cell membranes of living cells, where it is transformed into cell membrane-impermeant reaction products, thus staining the whole cytoplasm. Besides being resistant to cell fixation, the fluorescent probes are transferred to daughter cells through several generations, making this staining quite interesting also for in-vivo dynamic studies. Nonetheless, the main reason dictating the choice
1 2 3 4 5 6 7 8 9 10 11 12 13 14 15 16 17 18 19 20 21 22 23 24 25 26 27 28 29 30 31 32 33 34 35 36 37 38 39 40 41 42 43 44 45 46 47 48 49 50 51 52 53 54 55 56 57 58 59 60 61 62
of CMTMR is that its emission spectrum (whose maximum is around 578 nm) is well separated from the maximum autofluorescent emission of the IP-DiP polymer (Figure 3A,B and Figure S1). In such way, even if some parts of the fluorescent emission contributions of the polymer are still located in the emission range of CMTMR, it was possible to successfully locate and identify the morphology of the N2A cells. In Figures S3A,B of the Supporting Information, the 2PI characterization of N2A cells cultured on a flat glass slide shows how the CMTMR emission is particularly strong in the red channel while very attenuated in the green one (as expected). A further single-photon confocal imaging of this sample (Figures S3C,D) highlighted the ability of N2A cells to generate long interconnections that we may attribute to the presence of neurite extensions.[36,37] This confirms how such cell line, which can develop
many features of neural cell lines such as neurites and is as well widely used to screen novel compounds for neurotoxic properties and associated mechanisms,[48] represents an optimal
benchmark for probing the efficiency of the proposed 3D scaffolds in terms of neural-like cell colonization.
2.2 Optical and SEM investigation of N2A cells morphology and seeding around the 3D scaffold.
In order to assess the morphology and the seeding distribution of N2A cells around the 3D scaffold as well as the role of the cylindrical sub-units and of their nanogrooves in terms of cell adhesion, we report the overall exo-observation of the 3D scaffold (i.e. its outer surface layers), while the endo-observation (i.e. within the 3D architecture) of the cell seeding is shown in the next sections related to LSFM and 2PI imaging.
In Figures 4,5 and S4 of the Supporting Information, it is possible to appreciate some of the recurring features of the typical seeding around the 3D scaffold.
1 2 3 4 5 6 7 8 9 10 11 12 13 14 15 16 17 18 19 20 21 22 23 24 25 26 27 28 29 30 31 32 33 34 35 36 37 38 39 40 41 42 43 44 45 46 47 48 49 50 51 52 53 54 55 56 57 58 59 60
Figure 4. Optical (A) and SEM (B) micrographs of the 3D scaffold seeded with N2A cells; C: close-up on the cellular morphology and adhesion around the 3D scaffold cylindrical sub-units; D: N2A cells typical interconnection along the z-axis linking cylindrical sub-units at different z-heights.
N2A cells showed a homogenous colonization of the “artificial host” characterized by: a globular shape (Figure 4C, 5C, S4B) with good level of adhesion both around the cylindrical sub-units along their main axis (Figure 4C, S4B) and at their circular basement (Figure 5B); the creation of some local (Figure 4C, S4D) or more widely distributed cell networks (Figure 5A) showing the capability to seed the external shell of the 3D scaffold; the development of well adhering cellular interconnections (Figure 5B,D, S4C,D) that advanced also along the z-axis as shown in Figure 4D where the N2A cell links two cylindrical sub-units placed at different z-heights; the high adhesion of the N2A cells on the cylindrical subunits and the intercalation of the cellular interconnections within the cylindrical subunits’ nano-grooves (Figure 5B-D), induced by the multi-photon fabrication.
1 2 3 4 5 6 7 8 9 10 11 12 13 14 15 16 17 18 19 20 21 22 23 24 25 26 27 28 29 30 31 32 33 34 35 36 37 38 39 40 41 42 43 44 45 46 47 48 49 50 51 52 53 54 55 56 57 58 59 60 61 62
Figure 5. A: Dense N2A cells network on the external shell of a 3D scaffold; B: close-up on the high cell adhesion and formation of cellular interconnections at the basement of a cylindrical sub-unit; high-density seeding of a cylindrical sub-unit of the 3D scaffold (C) and intercalation of cellular interconnections within their nano-grooves (D).
In conclusion, the SEM morphological investigation allowed us to state that the proposed 3D grid provided favorable conditions for an optimal colonization of N2A cells on its outer shell but was not capable to provide an insight about the colonization scenario in the inner core of the scaffolds, for which we had to employ the advanced fluorescence imaging investigation reported hereafter.
2.3 LSFM investigation of N2A cell localization around and within the 3D scaffold.
In Figure 6A, we report the 3D imaging of the 3D scaffold by means of LSFM. The first evident feature is the high density of cell seeding around the architecture, in nice agreement with the results coming from the SEM investigation. In particular, it is possible to notice how
1 2 3 4 5 6 7 8 9 10 11 12 13 14 15 16 17 18 19 20 21 22 23 24 25 26 27 28 29 30 31 32 33 34 35 36 37 38 39 40 41 42 43 44 45 46 47 48 49 50 51 52 53 54 55 56 57 58 59 60
the scaffold architecture allows N2A cells to build freestanding network bridges linking groups of cells adhering on two different cylindrical sub-units (red square in Figure 6A).
Figure 6. A: Light sheet fluorescence microscopy (LSFM) imaging of the 3D scaffold seeded with N2A cells; B: Imaging of the inner part of the 3D scaffold from its back-side.
As expected, the imaging feature resolution of this fluorescence technique is lower than the one provided by SEM or confocal imaging (as it will be shown in the next section). This is evidenced by the cell morphology whose surface looks smoothed but still showing a globular shape. On the other hand, the great advantage of this approach is its deep imaging penetration, being able to unveil, by a qualitative point of view, the capability of the 3D scaffold to accommodate cells also in its inner core. In Figure 6B (in which the observer point of view is on the back-side of the architecture compared to its positioning depicted in Figure 6A), we show indeed how it is possible to clearly detect, through one of the aperture of the 3D
1 2 3 4 5 6 7 8 9 10 11 12 13 14 15 16 17 18 19 20 21 22 23 24 25 26 27 28 29 30 31 32 33 34 35 36 37 38 39 40 41 42 43 44 45 46 47 48 49 50 51 52 53 54 55 56 57 58 59 60 61 62
scaffold, the presence of adhering globular cells on the cylindrical sections and to recognize as well the “cellular bridge” suspended on the aperture.
In conclusion, the LSFM approach confirmed how the developed architecture allows a favourable cell seeding around and within the scaffold and the formation of 3D free standing cell networks. Nevertheless, it was not possible to provide a quantitative localization of the cells within the scaffold due to the intrinsic autofluorescence of the polymer employed in the fabrication that did not allow performing a multiview reconstruction of the sample.[49] For
addressing this last point, we performed a high-resolution 2PI imaging.
2.4 2PI investigation of N2A cell localization around and within the 3D scaffold.
In figure 7A, we report a general overview of the high-resolution 2PI characterization of the 3D scaffold colonized by N2A cells showing a globular morphology. A first qualitative analysis reveals how the two-photon confocal imaging allows detecting the presence of cells distributed around and within the 3D scaffold. The acquisitions made at higher magnification (Figure S5 of the Supporting information) confirmed the presence of cells at all the z-layers of the architecture. In order to overcome the issue of absorption of the emitted photons in the lower part of the 3D scaffold, as the outer shell of the sample was not affected by this phenomenon, we kept the 20X immersion objective and we performed a further zoom in the central part of the object (Figure S5B). In this way, we could increase the starting laser power intensity (which was always automatically compensated along the Z-axis) without having saturation effects at the outer shell of the 3D scaffold, therefore being able to image as well the lower layers which revealed the presence of cells at the bottom of the architecture. Further, in Figure 7C, we report the confocal imaging of one of the cylindrical sub-units, employed in the 3D scaffold, where the main attention was focused on the characteristic features of neuritic outgrowth.
1 2 3 4 5 6 7 8 9 10 11 12 13 14 15 16 17 18 19 20 21 22 23 24 25 26 27 28 29 30 31 32 33 34 35 36 37 38 39 40 41 42 43 44 45 46 47 48 49 50 51 52 53 54 55 56 57 58 59 60
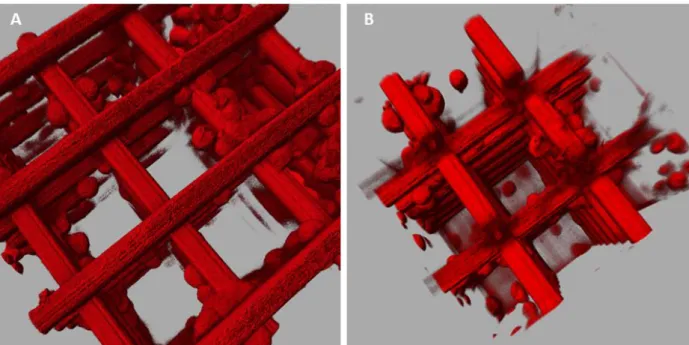
Figure 7. A: Two-photon confocal imaging of the 3D scaffold colonized by N2A cells; B: Quantitative localization of the position of the cells within the 3D scaffold; C: Confocal imaging of N2A cells neurite outgrowth on a cylindrical sub-unit employed in the 3D scaffold; D: Histogram of the N2A cell positioning according to specific Z-ranges within the 3D scaffold (Data are given as mean ± standard deviation, with
p value < 0.001 from pair-wise comparison of sample means).
Thanks to the CMTMR fluorescent probe able to stain the whole cell cytoplasm (therefore not only the cell body but also its external protrusions), we clearly see how N2A cells developed long (≈ 60 µm) neuritic extensions along the main axis of the cylinder. We hypothesized that this behavior is favored by the contemporary presence of the curvature of the cylindrical micro-structure and of its surface nano-grooves (Figures 1D, 5B-D), induced by the multiphoton DLW. 1 2 3 4 5 6 7 8 9 10 11 12 13 14 15 16 17 18 19 20 21 22 23 24 25 26 27 28 29 30 31 32 33 34 35 36 37 38 39 40 41 42 43 44 45 46 47 48 49 50 51 52 53 54 55 56 57 58 59 60 61 62
The possibility to provide a quantitative scenario of the colonization taking place within the 3D scaffold is of paramount importance to have a clear idea of its capacity to accommodate cells. Figures 7B,D show, respectively, the 3D visualization of the N2A cells localization within the 3D scaffold depicted in Figure 7A and the related histogram providing an overview of the amount of cells at different Z-levels of the 3D scaffold. A detailed analysis of the acquired data provides a deep insight about possible colonization mechanisms. N2A cells suspended in the culture medium, after precipitating, start to sediment on top of the 3D scaffold and on the flat surface around. They grow and proliferate on the fused silica support and finally commence to seed the bottom part of the 3D scaffold (especially the edges) where we report the highest amount of cells. Our conclusion is that, at this z-range, cells encounter the 3D scaffold through random migration from the surrounding flat surface without showing any particular neuritic alignment (Figure S4D) as the one observed along the main axis of the cylindrical subunits (Figure 7C). The second region with the major number of cells is located within central and top part of the 3D scaffold. We attribute this result to the fact that some cells, instead of reaching the fused silica support, encounter the 3D scaffold and invade the upper inner layers. On the other hand, the layers between the bottom and central part of the 3D scaffold are characterized by the lowest cell presence. This can be attributed to the fact that such region of the 3D architecture is less easily accessible both from cells coming from the bottom layers as well as from cells proliferating/precipitating from the upper layers due to the higher probability to come across a larger number of cylindrical sub-sections (acting in this case as architectonic barriers). Finally, in terms of cell occupancy, the 3D scaffold features the capacity to accommodate a larger quantity of cells (Figure 7D) compared to 2D scaffolds and barely flat pedestals (Figures S6, S7 of Supporting Information), tested with the same cell culture conditions and fabrication configuration.
1 2 3 4 5 6 7 8 9 10 11 12 13 14 15 16 17 18 19 20 21 22 23 24 25 26 27 28 29 30 31 32 33 34 35 36 37 38 39 40 41 42 43 44 45 46 47 48 49 50 51 52 53 54 55 56 57 58 59 60
3. Conclusions
In this work, we reported the combination of a rapid-prototyping fabrication route to realize 3D scaffolds for optimal cell colonization and the use of 3D advanced fluorescence imaging techniques to clearly identify the position of cells within and around the scaffold. We developed the architectures by exploiting a multi-photon DLW approach featuring a high resolution at the level of meso-, micro- and nano-scale features. In order to assess the efficiency of the 3D scaffold in terms of cell colonization, we seeded neuroblastoma N2A cells capable of developing many properties of neural cell lines.[36,37,48] The multi-technique
characterization approach, involving scanning electron microscopy, two-photon confocal imaging and light sheet fluorescence microscopy, unveiled, qualitatively and quantitively, an optimal cell invasion both around the fabricated architecture and within its core regions. Further, both SEM morphological investigation and confocal imaging showed a high level of cell adhesion as well as the capability to form long and thick neuritic extensions (up to ≈ 60 µm). The developed protocol, both in terms of 3D fabrication and 3D imaging, demonstrates thus to be an appealing solution for the development and the characterization of 3D cellular scaffolds whose application may be extended to neural tissue engineering purposes[25,41] as
well as for evaluating the action of neurodegenerative peptides[42-45] on neural networks in 3D
in-vitro environments. Finally, in order to perform real-time dynamics studies to reveal the
mechanisms of cell proliferation and colonization within the 3D scaffold, we envision in the forthcoming period the optimization of high resolution DLW 3D fabrication protocols based on more biocompatible and less autofluorescent hydrogels, such as Poly(ethylene glycol) diacrylate (PEGDA)[50] or gelatin-based materials,[51] as well as the realization of anisotropic
scaffolds with architectures closer to the natural organization of the neural tissue.[40,52]
4. Experimental Section
Direct laser writing (DLW) fabrication. In order to fabricate the tri-dimensional scaffold 1 2 3 4 5 6 7 8 9 10 11 12 13 14 15 16 17 18 19 20 21 22 23 24 25 26 27 28 29 30 31 32 33 34 35 36 37 38 39 40 41 42 43 44 45 46 47 48 49 50 51 52 53 54 55 56 57 58 59 60 61 62
(Figure 1), designed by the CAD (Computer Aided Design) software AutoDesk Inventor, a droplet of commercially available negative tone photoresist (2-(Hydroxymethyl)-2-[[(1-oxoallyl)oxy]methyl]-1,3-propanediyl diacrylate), known as IP-DiP, was cast on functionalized fused silica supports (25 X 25 mm2, 0.7 mm thickness) and exposed to a
Nanoscribe two-photon lithography system (Figure S8A) equipped with a femtosecond-pulsed (100 fs, 50 mW) fiber laser (FemtoFiber Pro, Toptica Photonics) at 780 nm and a high numerical-aperture oil-immersion objective (63X, N.A. = 1.4). The principle of two photon polymerization (Figure S8C) is based on the fact that, by precisely focusing infrared femtosecond laser pulses onto a material highly absorptive in the UV range, it is possible to polymerize the material in extremely confined volumes called voxels whose dimension (in this case around 200 nm in x,y directions and 1 µm along z) is mainly determined by the laser spot-size, the power of the laser source and the properties of the material employed. The system exploits a “galvo” configuration (Figure S8B) where the laser beam is laterally scanned by galvanometric mirrors and the vertical movement is controlled by piezo-actuators. This moving-beam fixed-sample (MBFS) approach allows a very fast fabrication speed by employing a layer-by-layer building process. Further, exploiting a dip-in laser lithography (DiLL) configuration, in which the microscope objective is directly immersed into the photoresist (Figure S8D), it is indeed possible to minimize spherical aberrations and obtain tall freestanding 3D architectures by moving the focused laser within the chosen photosensitive material. Regarding the specific parameters employed for the realization of the 3D scaffold, the optimal laser power was set at 60% (Figure S9B) and the writing speed at 50 mm/s, while the slicing (minimal distance between two adjacent planes) and hatching (lateral distance of two adjacent lines within a layer) distances were set at 300 and 200 nm respectively. It is important to notice how the choice of these parameters, and especially the laser power, can drastically influence the shape of the sub-units of the whole structure which
1 2 3 4 5 6 7 8 9 10 11 12 13 14 15 16 17 18 19 20 21 22 23 24 25 26 27 28 29 30 31 32 33 34 35 36 37 38 39 40 41 42 43 44 45 46 47 48 49 50 51 52 53 54 55 56 57 58 59 60
explosions, Figure S9C) or lower (insufficient polymerization, collapse of the structure, Figure S9D) doses. The 3D design was split in several unit blocks (Figure S10 and movie Multiphoton_fabrication.avi), each of them being fabricated separately exploiting the galvanometric mirrors of the Nanoscribe setup. Each 3D scaffold (whose overall dimension is of 300 (x) * 300 (y) * 300 (z) µm3) could be fabricated in 45 min. The sample was then
chemically developed in SU8 developer (MicroChem) for 25 min to remove the not-polymerized resist, rinsed in Isopropanol for 1 min and finally blow-dried with nitrogen. The micro-ridges 2D architectures and the flat pedestals (Figures S6,S7 of Supporting information) were fabricated using the same material and fabrication protocol of the 3D scaffolds. The employed geometry included ridges of 20 µm edge, 20 µm height and 60 µm lateral spacing (Figure S11) resembling 2D architectures previously employed in presence of neuronal cell lines[24,25,37]. Before cell culture and in order to improve the biochemical
(poly-d-lysine/laminin) functionalization of the polymeric surfaces, both the 2D and 3D scaffolds underwent a plasma pretreatment by using an Inductively Coupled Plasma Reactive Ion Etching (ICP-RIE, Trikon-SPTS) setup (O2 = 15 sccm, CF4 = 5 sccm, P = 9.06 Pa, source
power = 100 W, RF power = 50 W, T = 1 min).
MAPTMS functionalization of the fused silica supports. As the organic part of the IP-DiP
photoresist is an acrylate polymer, 3-MethAcryloxyPropyl TriMethoxySilane (MAPTMS) was used to ensure the adhesion of the 3D structure to the surface of the fused silica supports. Supercritical Fluid Deposition technique (SFD-200, Manufacturer: 31 Degrees) was employed for the functionalization of the fused silica substrates. Prior to the SFD and in order to clean and activate the surface, an oxygen plasma pretreatment was performed (1000 ml/min of O2, 800 W, 5 min, Tepla 300 system). The employed SFD process, reported in detail
elsewhere[53], can be resumed as follow: the chamber is pressurized at 12 MPa; 150 µL of 1 %
v/v MAPTMS solution in ethanol was injected 10 times during 5 min under a constant flow of 50 g/min of supercritical CO2; the chamber is then kept at 12 MPa for 15 min to ensure the 1 2 3 4 5 6 7 8 9 10 11 12 13 14 15 16 17 18 19 20 21 22 23 24 25 26 27 28 29 30 31 32 33 34 35 36 37 38 39 40 41 42 43 44 45 46 47 48 49 50 51 52 53 54 55 56 57 58 59 60 61 62
crosslinking of MAPTMS with the substrate; finally, a constant flow of 100 g/min of supercritical CO2 was used to clean the surface sample and to remove all molecules
precursors that did not react. After depressurizing the chamber, the samples were heated at 110°C for 5 min.
Scaffolds biochemical coatings, cell culture, cell fixation and immunofluorescence staining
protocols. Prior to cell culture, both the 3D scaffolds, the 2D supports and the flat glass slides
were first sterilized for 1 hour under UV (254 nm), then coated with 0.01% poly-L-lysine (Sigma-Aldrich), to favour the electrostatic interactions between the negatively charged ions of the cellular membrane and the employed polymer, washed twice with sterile water and dried for 2 hours. Then, laminin (a protein of the extracellular matrix, involved as well in the mechanisms of cell adhesion) solution (40 µg/mL, Invitrogen) was applied to the supports for 3 hours. The fast-growing mouse neuroblastoma cell line, Neuro-2A (N2A) was obtained from the American type culture collection (ATCC). Dulbecco’s modified Eagle’s medium (DMEM) containing glutamax, pyruvate (Dubco, invitrogen) and 10% fetal bovine serum was used for the N2A cells. 100000 cells/cm2 were inoculated onto the scaffold and left in culture
for 3 days in vitro (DIV). The cells were incubated in an atmosphere containing 5% CO2 at
37°C. At the end of the cell culture, the samples were then treated differently according to the desired characterization (SEM or immunofluorescence imaging). In order to prepare the sample for SEM characterization, the cells were rinsed with PBS (Phosphate buffered saline) solution and incubated in 4% glutaraldehyde solution for 4 hours at room temperature. The glutaraldehyde was removed and the cells were rinsed with PBS. The cells were then incubated in 50%, 70%, 90% and 100% ethanol for 4 minutes at each step and dried for 1 hour at room temperature to remove alcohol residues. Concerning instead the immunofluorescence staining for multi-photon and light sheet fluorescence microscopy investigation, the media was removed, and the cells were incubated for 30 minutes with 1 µM
1 2 3 4 5 6 7 8 9 10 11 12 13 14 15 16 17 18 19 20 21 22 23 24 25 26 27 28 29 30 31 32 33 34 35 36 37 38 39 40 41 42 43 44 45 46 47 48 49 50 51 52 53 54 55 56 57 58 59 60
chloromethyl)benzoyl)amino)tetramethylrhodamine, Life technologies) in Dulbecco’s modified Eagle’s medium without red phenol. The cells were rinsed in DMEM without red phenol, and incubated in 10% Formalin solution (Sigma-Aldrich) for 30 minutes. After the fixation, the cells were stocked in PBS solution at 4°C. Three independent measurements, on both 3D and 2D supports, were performed in order to provide mean ± standard deviation cell counting data. Cytoplasmic extensions longer than or equal to 10 μm were considered as neurites[37].
Scanning Electron Microscopy (SEM). SEM imaging was performed on the samples
(metal-coated with 15 nm of sputtered gold) by using a Hitachi S-4800 microscope with an acceleration voltage ranging from 0.8 kV to 15 kV.
Two-photon confocal imaging (2PI). The two-photon confocal imaging experiments were
performed using an AxioImager upright microscope LSM 7MP (Carl Zeiss). A pulsed femtosecond Ti:Sapphire laser (Chameleon Ultra II; Coherent) tunable in the range of 690– 1064 nm was used as the excitation light source. Z stack acquisitions were performed with a 20 X W-Plan Apochromat water immersion objective with 1.0 numerical aperture (N.A.), with the laser excitation wavelength tuned to 820 nm, giving a resolution on the x/y-axis of 430 nm and on the z-axis of 1.3 µm. The laser power was set between 2% (29 mW out of the objective) and 6% (87 mW out of the objective) and an automatic z-compensation of the laser power was applied to have a homogenous imaging of the sections of the 3D scaffold at different heights. Emitted light was detected through a descanned pathway leading to two non-descanned detectors and emission was recorded simultaneously with two BP (band-pass) emission filters: 500-550 nm (green channel, IP-DiP) and 565-610 nm (red channel, CMTMR). Fields were averaged two times to increase signal to noise ratio, giving a pixel dwell time of 1.58 µs. The samples were immersed in PBS buffer at room temperature for the whole duration of the experiments. Image processing and 3D reconstruction were performed by ImageJ and Imaris software Version 8.2 (Bitplane).
1 2 3 4 5 6 7 8 9 10 11 12 13 14 15 16 17 18 19 20 21 22 23 24 25 26 27 28 29 30 31 32 33 34 35 36 37 38 39 40 41 42 43 44 45 46 47 48 49 50 51 52 53 54 55 56 57 58 59 60 61 62
Single-photon confocal imaging. The confocal experiments were performed with a Zeiss LSM
710 inverted microscope (Carl Zeiss), using a 63x Plan-Apochromat objective (N.A. 1.4 oil). The visualization of the CMTMR staining of the cells and the IP-Dip polymer was obtained with a laser wavelength of 561 nm (0.1 mW) and 488 nm (0.15 mW) for excitation, and with two band pass filters for emission collection: 565-697 nm (red channel) and 492-551 nm (green channel). Fields were averaged 2 times to increase signal to noise ratio, giving a pixel dwell time of 1.27 µs. The image processing was performed with ImageJ software.
Light sheet fluorescence microscopy (LSFM). The configuration of the LSFM setup, described
in detail elsewhere[39], is depicted in Figures S2A,B of the Supporting Information and
included a 10 X N.A. 0.25 illumination objective, a 10 X N.A. 0.3 immersion detection objective, a laser excitation wavelength of 532 nm (2.9 mW, 10 ms exposure, 25% laser power) and a 593 nm long-pass emission filter. As described in Figure S2C of the supporting information, prior to imaging, the 3D scaffold seeded with N2A cells was moved to an Eppendorf tube filled with PBS, then the PBS was removed and substituted with 1% low-melting-point Agarose (Sigma) cooled at 40°C and consequently injected in a 100 µL glass capillary (Sigma) and cooled for few minutes at 4°C. The capillary was then fixed in the LSFM setup and placed in a PBS-filled physiological chamber made of an epoxy resin (Cresilas). The column of agarose was then extruded from the capillary with an adapted plunger and the agarose-embedded 3D scaffold was placed in front of the objective lens. 3D reconstructions were performed by Amira software.
Supporting Information
Supporting Information is available from the Wiley Online Library or from the author.
Acknowledgements
We acknowledge the support of Sophie Allart and Danielle Daviaud from the INSERM Centre de Physiopathologie de Toulouse-Purpan (CPTP) of Toulouse for the provided help during the multi-photon confocal imaging acquisitions as well as Jacques Rouquette and Lise
1 2 3 4 5 6 7 8 9 10 11 12 13 14 15 16 17 18 19 20 21 22 23 24 25 26 27 28 29 30 31 32 33 34 35 36 37 38 39 40 41 42 43 44 45 46 47 48 49 50 51 52 53 54 55 56 57 58 59 60
of Toulouse for the provided help during the LSFM imaging acquisitions. We also thank Laurence Vaysse from INSERM UMR 1214 in Toulouse for providing the neuroblastoma N2A cell line.
Received: ((will be filled in by the editorial staff)) Revised: ((will be filled in by the editorial staff)) Published online: ((will be filled in by the editorial staff))
References
[1] C. W. Hull, Apparatus for production of three-dimensional objects by stereolithography. Patent US 4 575 330 1986.
[2] M. Yoshikawa, R. Sato, T. Higashihara, T. Ogasawara, N. Kawashima, N. Rehand,
Realistic electric prosthetic hand created with a 3D printer. Proceedings of the Annual
International Conference of the IEEE Engineering in Medicine and Biology Society,
IEEE Engineering in Medicine and Biology Society, Piscataway, NJ 2015, pp 2470− 2473.
[3] V. Mironov, V. Kasyanov, R. R. Markwald, Curr. Opin. Biotechnol. 2011, 22, 667. [4] H. –W. Kang, S. J. Lee, I. K. Ko, C. Kengla, J. J. Yoo, A. A. Atala, Nat. Biotechnol.
2016, 34, 312.
[5] A. –V. Do, B. Khorsand, S. M. Geary, A. K. Salem, Adv. Healthcare Mater. 2015, 4, 1742.
[6] W. Chen, S. Chen, Y. Morsi, H. El-Hamshary, M. El-Newhy, C. Fan, X. Mo, ACS Appl.
Mater. Interfaces 2016, 8 (37), 24415-24425.
[7] S. Rhee, J. L. Puetzer, B. N. Mason, C. A. Reinhart-King, L. J. Bonassar, ACS Biomater.
Sci. Eng. 2016, 2, 1800.
[8] Y. Zhao, R. Yao, L. Ouyang, H. Ding, T. Zhang, K. Zhang, S. Cheng, W. Sun,
Biofabrication 2014, 6, 035001.
[9] I. Zein, D. W. Hutmacher, K. C. Tan, S. H. Teoh, Biomaterials 2002, 23, 1169.
1 2 3 4 5 6 7 8 9 10 11 12 13 14 15 16 17 18 19 20 21 22 23 24 25 26 27 28 29 30 31 32 33 34 35 36 37 38 39 40 41 42 43 44 45 46 47 48 49 50 51 52 53 54 55 56 57 58 59 60 61 62
[10] Y. Loo, A. Lakshmanan, M. Ni, L. L. Toh, S. Wang and C. A. E. Hauser Nano Lett.,
2015, 15, 6919.
[11] S. Eap, A. Ferrand, C. M. Palomares, A. Hébraud, J. F. Stoltz, D. Mainard, G. Schlatter, N. Benkirane-Jessel, Biomed. Mater. Eng. 2012, 22, 137.
[12] X. Cui, T. Boland, D. D. D'Lima, M. K. Lotz, Recent Pat. Drug. Deliv. Formul. 2012, 6, 149.
[13] J. Kadkhodapour, H. Montazerian, S. Raeisi, Mater. Sci. Eng. C Mater. Biol. Appl. 2014,
43, 587.
[14] S. Eshraghi, S. Das, Acta Biomater. 2010, 6, 2467. [15] S. V. Murphy, A. Atala, Nat. Biotechnol. 2014, 32, 773.
[16] F. P. Melchels, J. Feijen, D. W. Grijpma, Biomaterials 2010, 31, 6121.
[17] J. Seo, D. I. Kushner, M. A. Hickner, ACS Appl. Mater. Interfaces 2016, 8, 16656.
[18] X. Zhou, W. Zhu, M. Nowicki, S. Miao, H. Cui, B. Holmes, R. I. Glazer, L. G. Zhang,
ACS Appl. Mater. Interfaces 2016, 8, 30017.
[19] F. Claeyssens, E. A. Hasan, A. Gaidukeviciute, D. S. Achilleos, A. Ranella, C. Reinhardt, A. Ovsianikov, X. Shizhou, C. Fotakis, M. Vamvakaki, B. N. Chichkov, M. Farsari, Three-Dimensional Biodegradable Structures Fabricated by Two-Photon Polymerization.
Langmuir 2009, 25, 3219.
[20] B. Spagnolo, V. Brunetti, G. Leménager, E. De Luca, L. Sileo, T. Pellegrino, P. Paolo Pompa, M. De Vittorio, F. Pisanello, Sci. Rep. 2015, 5, 10531.
[21] P. Tayala, C.R. Mendoca, T. Baldacchini, D. J. Mooney, E. Mazur, Adv. Mater. 2008, 20, 4494.
[22] M. T. Raimondi, S. M. Eaton, M. Laganà, V. Aprile, M. M. Nava, G. Cerullo, R. Osellame, Acta Biomater. 2013, 9, 4579.
[23] A. Marino, C. Filippeschi, V. Mattoli, B. Mazzolai, G. Ciofani, Nanoscale 2015, 7, 2841.
1 2 3 4 5 6 7 8 9 10 11 12 13 14 15 16 17 18 19 20 21 22 23 24 25 26 27 28 29 30 31 32 33 34 35 36 37 38 39 40 41 42 43 44 45 46 47 48 49 50 51 52 53 54 55 56 57 58 59 60
[24] A. Béduer, C. Vieu, F. Arnauduc, J. C. Sol, I. Loubinoux, L. Vaysse, Biomaterials 2012,
33, 504.
[25] L. Vaysse, A. Beduer, J. C. Sol, C. Vieu, I. Loubinoux, Biomaterials 2015, 58, 46.
[26] F. Cesca, T. Limongi, A. Accardo, A. Rocchi, M. Orlando, V. Shalabaeva, E. Di Fabrizio, F. Benfenati, RSC Adv. 2014, 4, 45696.
[27] A. Yamada, M. Vignes, C. Bureau, A. Mamane, B. Venzac, S. Descroix, J.L. Viovy, C. Villard, J. M. Peyrin, L. Malaquin, Lab Chip 2016, 16, 2059.
[28] A. Marino, G. Ciofani, C. Filippeschi, M. Pellegrino, M. Pellegrini, P. Orsini, M. Pasqualetti, V. Mattoli and B. Mazzolai, ACS Appl. Mater. Interfaces 2013, 5, 13012. [29] M. Farsari, M. Chichkov, Nat. Photon. 2009, 3, 450.
[30] S. Kawata, H. –B. Sun, T. Tanaka, Laser Photon. Rev. 2008, 2, 100. [31] B. N. Chichkov, Mater. Today 2010, 13, 42.
[32] M. M. Nava, N. Di Maggio, T. Zandrini, G. Cerullo, R. Osellame, I. Martin, M. T. Raimondi, J. Tissue Eng. Regen. Med. 2016, DOI: 10.1002/term.2187.
[33] M. M. Nava, A. Piuma, M. Figliuzzi, I. Cattaneo, B. Bonandrini, T. Zandrini, G. Cerullo, R. Osellame, A. Remuzzi, M. T. Raimondi, Stem Cell Res. Ther. 2016, 7, 132.
[34] A. L. Rutz, K. E. Hyland, A. E. Jakus, W. R. Burghardt, R. N. A. Shah, Adv. Mater.
2015, 27, 1607.
[35] M. Guvendiren, J. Molde, R. M. D. Soares, J. Kohn, ACS Biomater. Sci. Eng. 2016, 2, 1679.
[36] C. J. Thiele, in Human Cell Culture, Vol. 1 (Eds: J. R. W. Masters, B. Palsson), Kluwer Academic Publishers, Lancaster, UK 1998, pp 21-53.
[37] A. Béduer, L. Vaysse, E. Flahaut, F. Seichepine, I. Loubinoux, C. Vieu, Microelectron.
Eng. 2011, 88, 1668.
[38] K. Svoboda, R. Yasuda, Neuron 2006, 50, 823.
1 2 3 4 5 6 7 8 9 10 11 12 13 14 15 16 17 18 19 20 21 22 23 24 25 26 27 28 29 30 31 32 33 34 35 36 37 38 39 40 41 42 43 44 45 46 47 48 49 50 51 52 53 54 55 56 57 58 59 60 61 62
[39] C. Lorenzo, C. Frongia, R. Jorand, J. Fehrenbach, P. Weiss, A. Maandhui, G. Gay, B. Ducommun, V. Lobjois, Cell Div. 2011, 6, 22.
[40] H. Takahashi, T. Shimizu, M. Nakayama, M. Yamato, T. Okano, Adv. Healthc. Mater.
2015, 4, 356.
[41] A. L. Carlson, N. K. Bennett, N. L. Francis, A. Halikere, S. Clarke, J. C. Moore, R. P. Hart, K. Paradiso, M. Wernig, J. Kohn, Z. P. Pang, P. V. Moghe, Nat. Commun. 2016, 7, 10862.
[42] A. Accardo, V. Shalabaeva, E. Di Cola, M. Burghammer, R. Krahne, C. Riekel, S. Dante,
ACS Appl. Mater. Interfaces 2015, 7, 20875.
[43] A. Accardo, V. Shalabaeva, M. Cotte, M. Burghammer, R. Krahne, C. Riekel, S. Dante,
Langmuir 2014, 30, 3191.
[44] A. Accardo, V. Shalabaeva, B. Hesse, M. Cotte, R. Krahne, C. Riekel, S. Dante, Vib.
Spectrosc. 2015, 80, 30.
[45] A. Accardo, V. Shalabaeva, B. Hesse, M. Cotte, R. Krahne, C. Riekel, S. Dante,
Microelectron. Eng. 2016, 158, 64-68.
[46] A. Rohrbach, Opt. Lett. 2009, 34, 3041. [47] V. Ntziachristos, Nat. Methods. 2010, 7, 603.
[48] K. T. LePage, R. W. Dickey, W. H. Gerwick, E. L. Jester, T. F. Murray, Crit. Rev.
Neurobiol. 2005, 17, 27.
[49] S. Preibisch, S. Saalfeld, J. Schindelin, P. Tomancak, Nat. Methods 2010, 7, 418. [50] J. Zhu, R. E. Marchant, Expert Rev. Med. Devices 2011, 8, 607.
[51] R. Gauvin, Y. C. Chen, J. W. Lee, P. Soman, P. Zorlutuna, J. W. Nichol, H. Bae, S. Chen, A. Khademhosseini, Biomaterials 2012, 33, 3824.
[52] H. Takahashi, K. Itoga, T. Shimizu, M. Yamato, T. Okano, Adv. Healthc. Mater. 2016, 5, 1931. 1 2 3 4 5 6 7 8 9 10 11 12 13 14 15 16 17 18 19 20 21 22 23 24 25 26 27 28 29 30 31 32 33 34 35 36 37 38 39 40 41 42 43 44 45 46 47 48 49 50 51 52 53 54 55 56 57 58 59 60
[53] J. Rull, G. Nonglaton, G. Costa, C. Fontelaye, C. Marchi-Delapierre, S. Ménage, G. Marchand, Appl. Surf. Sci. 2015, 354, 285.
Table of contents entry
3D freestanding polymeric nanostructured scaffolds, fabricated by direct laser writing and characterized by advanced 3D fluorescence imaging techniques, provide favorable conditions for fast-growing mouse neuroblastoma (N2A) cell invasion. The
high-resolution imaging analysis reveals optimal colonization of both the external shell and the inner core of the 3D architecture with the formation of long (≈ 60 µm) neuritic extensions.
1 2 3 4 5 6 7 8 9 10 11 12 13 14 15 16 17 18 19 20 21 22 23 24 25 26 27 28 29 30 31 32 33 34 35 36 37 38 39 40 41 42 43 44 45 46 47 48 49 50 51 52 53 54 55 56 57 58 59 60 61 62
Copyright WILEY-VCH Verlag GmbH & Co. KGaA, 69469 Weinheim, Germany, 2013.
Supporting Information
Multi-photon Direct Laser Writing and 3D Imaging of Polymeric
Freestanding Architectures for Cell Colonization
Angelo Accardo*, Marie-Charline Blatché, Rémi Courson, Isabelle Loubinoux, Christophe Thibault, Laurent Malaquin, Christophe Vieu
IP-DiP polymer autofluorescence.
Figure S1. Emission spectrum of IP-DiP 3D scaffold (excited at 405 nm)
LSFM setup.
Figure S2. A: Schematic representation of a LSFM configuration (reproduced with permission from [1]); B: 1 2 3 4 5 6 7 8 9 10 11 12 13 14 15 16 17 18 19 20 21 22 23 24 25 26 27 28 29 30 31 32 33 34 35 36 37 38 39 40 41 42 43 44 45 46 47 48 49 50 51 52 53 54 55 56 57 58 59 60
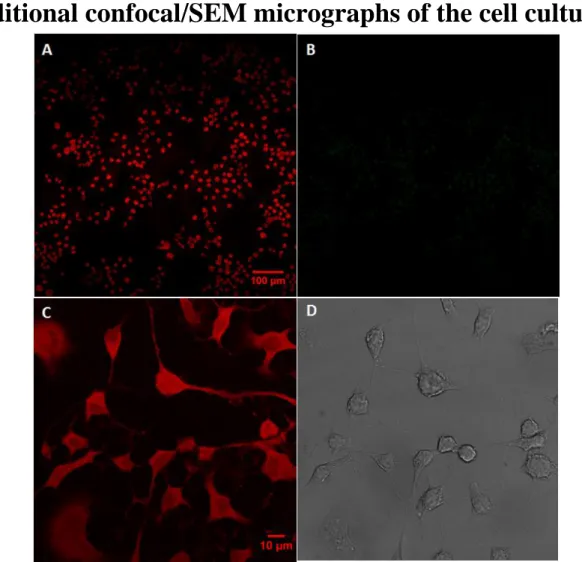
Additional confocal/SEM micrographs of the cell cultures.
Figure S3. Two-photon (A,B) and one-photon (C,D) confocal imaging of N2A cells on flat glass slides.
Figure S4. SEM micrographs of a 3D scaffoldcolonized by N2A cells. 1 2 3 4 5 6 7 8 9 10 11 12 13 14 15 16 17 18 19 20 21 22 23 24 25 26 27 28 29 30 31 32 33 34 35 36 37 38 39 40 41 42 43 44 45 46 47 48 49 50 51 52 53 54 55 56 57 58 59 60 61 62
Figure S5. High resolution 2PI characterization of a 3D scaffoldcolonized by N2A cells
N2A cells on micro-ridges 2D supports and flat pedestals.
Figure S6.SEM micrographs of N2A cells on 2D micro-ridges support (A-C) and spatial distribution (D) (Data are given as mean ± standard deviation, with p value < 0.05 from pair-wise comparison of sample means) 1 2 3 4 5 6 7 8 9 10 11 12 13 14 15 16 17 18 19 20 21 22 23 24 25 26 27 28 29 30 31 32 33 34 35 36 37 38 39 40 41 42 43 44 45 46 47 48 49 50 51 52 53 54 55 56 57 58 59 60
Figure S7. SEM micrographs of N2A cells on 2D micro-ridges support (A,B) and on flat pedestal (C,D)
In order to assess the efficiency of the developed 3D scaffold in terms of cell colonization predisposition, we cultured N2A cells also on 2D micro-ridge supports (whose geometry has been already reported elsewhere[2,3]) as well as on flat pedestals fabricated with the same
configuration parameters of the 3D scaffold, as explained in the Experimental section. The first feature which can be highlighted comes from the comparison between the 2D micro-ridges supports (Figure S6A) and the 3D scaffold (Figure 7A) where, for equal cell culture time, the latter is characterized by a highest level of cell occupancy (Figures 7D, S6D). We also observed that, keeping the same cell culture conditions and considering identical surface areas (270 µm X 515 µm), micro-ridges 2D supports (Figure S6A) and flat pedestals (Figure S7C, fabricated with the same parameters employed for the micro-ridges 2D structures) showed very similar cell densities (around 100 cells) but also evident differences in terms of spatial distribution. N2A cells on flat pedestals indeed where randomly scattered over the surface and generally did not create thick/long cellular interconnections (not longer than 10 µm) (Figure S7D). On the other hand, N2A cells cultured on micro-ridges 2D supports
1 2 3 4 5 6 7 8 9 10 11 12 13 14 15 16 17 18 19 20 21 22 23 24 25 26 27 28 29 30 31 32 33 34 35 36 37 38 39 40 41 42 43 44 45 46 47 48 49 50 51 52 53 54 55 56 57 58 59 60 61 62
showed a tendency to group, to link between each other and to probe the surrounding environment by means of long and thick neuritic extensions (Figure S6B,C and S7A,B). A more detailed analysis of the seeded samples allowed to identify three regions (Figure S6D): top of the ridges (“ridges”), areas at the bottom between the ridges (“valleys”) and regions between the vertical sidewalls of the ridges and the valleys (“edges”). As reported in previous works involving similar geometries made of PDMS2,3, N2A cells mainly concentrated in the
edges regions, being a proof of how this cell line seems to show a propensity for constrained
environment compared to more open regions (valleys). On the other hand, valleys provided quite a large area of adhesion compared to the one of ridges, where consequentially we found a lower amount of cells that we attributed to two factors: from one side the smaller probability to have cell precipitating and sedimenting exactly on top of the ridges, and, on the other hand, the further effort made by the cells for potentially “climbing” the vertical sidewalls.
Multiphoton direct laser writing setup and additional
information of fabrication designs and optimization.
Figure S8. A: Overview of the multi-photon direct laser writing setup; B: Sketch of the galvanometric
configuration of the Nanoscribe setup; C: 2-photons absorption photopolymerization principle; D: Dip-in Laser Lithography (DiLL) configuration.
1 2 3 4 5 6 7 8 9 10 11 12 13 14 15 16 17 18 19 20 21 22 23 24 25 26 27 28 29 30 31 32 33 34 35 36 37 38 39 40 41 42 43 44 45 46 47 48 49 50 51 52 53 54 55 56 57 58 59 60
Figure S9. A: Design of the test unit block to assess the optimal fabrication parameters of the multiphoton direct laser writing; SEM micrograph of the test unit block at 60% (B), 80% (C) and 40% (D) laser power.
Figure S10. Representation of the “splitting & stitching modality” of the multi-photon direct laser writing system (see Multiphoton_fabrication.avi movie).
1 2 3 4 5 6 7 8 9 10 11 12 13 14 15 16 17 18 19 20 21 22 23 24 25 26 27 28 29 30 31 32 33 34 35 36 37 38 39 40 41 42 43 44 45 46 47 48 49 50 51 52 53 54 55 56 57 58 59 60 61 62
Figure S11. CAD design of the IP-DiP micro-ridges 2D support
References
[1] J. Huisken, D. Y. Stainier, Development 2009, 136, 1963.
[2] A. Béduer, C. Vieu, F. Arnaudu, J. C. Sol, I. Loubinoux, L. Vaysse, Biomaterials 2012,
33, 504.
[3] A. Béduer, L. Vaysse, E. Flahaut, F. Seichepine, I. Loubinoux, C. Vieu, Microelectron.
Eng. 2011, 88, 1668. 1 2 3 4 5 6 7 8 9 10 11 12 13 14 15 16 17 18 19 20 21 22 23 24 25 26 27 28 29 30 31 32 33 34 35 36 37 38 39 40 41 42 43 44 45 46 47 48 49 50 51 52 53 54 55 56 57 58 59 60


![Figure S2. A: Schematic representation of a LSFM configuration (reproduced with permission from [1]); B:](https://thumb-eu.123doks.com/thumbv2/123doknet/14540280.535339/28.892.214.675.753.1109/figure-s-schematic-representation-lsfm-configuration-reproduced-permission.webp)