HAL Id: hal-02454383
https://hal.archives-ouvertes.fr/hal-02454383
Submitted on 24 Jan 2020HAL is a multi-disciplinary open access archive for the deposit and dissemination of sci-entific research documents, whether they are pub-lished or not. The documents may come from teaching and research institutions in France or abroad, or from public or private research centers.
L’archive ouverte pluridisciplinaire HAL, est destinée au dépôt et à la diffusion de documents scientifiques de niveau recherche, publiés ou non, émanant des établissements d’enseignement et de recherche français ou étrangers, des laboratoires publics ou privés.
Evidence for a Posterior Parietal Cortex Contribution to
Spatial but not Temporal Numerosity Perception
Seda Cavdaroglu, André Knops
To cite this version:
Seda Cavdaroglu, André Knops. Evidence for a Posterior Parietal Cortex Contribution to Spatial but not Temporal Numerosity Perception. Cerebral Cortex, Oxford University Press (OUP), 2019, 29 (7), pp.2965-2977. �10.1093/cercor/bhy163�. �hal-02454383�
1
Evidence for a posterior parietal cortex contribution to spatial but not temporal numerosity perception
Seda Cavdaroglu1 & André Knops 2, 3*
1 Department of Psychology, Humboldt-Universität zu Berlin, Berlin, Germany
2 CNRS UMR 8240, Laboratory for the Psychology of Child Development and Education,
Paris, France
3University Paris Descartes, Sorbonne Paris Cité, Paris, France
Running title: PPC contribution to numerosity perception
Corresponding author André Knops
2CNRS UMR 8240
Laboratory for the Psychology of Child Development and Education University Paris Descartes
46, rue Saint Jaques 75005 Paris
France
Phone : +33140463467
2
Abstract
Posterior parietal cortex (PPC) is thought to encode and represent the number of objects in a visual scene (i.e. numerosity). Whether this representation is shared for simultaneous and sequential stimuli (i.e. mode independency) is debated. We tested the existence of a common neural substrate for the encoding of these modes using fMRI. While both modes elicited overlapping BOLD response in occipital areas, only simultaneous numerosities significantly activated PPC. Unique activation for sequential numerosities was found in bilateral temporal areas. Multi-voxel pattern analysis revealed numerosity selectivity in PPC only for simultaneous numerosities and revealed differential encoding of presentation modes. Voxel-wise numerosity tuning functions for simultaneous numerosities in occipital and parietal ROIs revealed increasing numerosity selectivity along an occipito-to-parietal gradient. Our results suggest that the parietal cortex is involved in the extraction of spatial but not temporal numerosity and question the idea of commonly used cortical circuits for a mode-independent numerosity representation.
3 Humans as well as other animals are endowed with a system that allows them to approximately estimate the number of items in a visual scene (i.e. the numerosity). In humans, the horizontal portion of the intraparietal sulcus (hIPS) in posterior parietal cortex (PPC) is claimed to be the neural substrate of this approximate number system (Dehaene et al., 2004). Yet, whether numerical information from different formats (e.g. Arabic numerals vs. non-symbolic dot arrays), modes (simultaneous: items spread in space or sequential: items spread in time) or modalities (e.g. visual or auditory) converge on a unitary, abstract representation in hIPS is debated (Cohen Kadosh and Walsh, 2009).
Evidence from behavioral and neuroimaging studies in humans comes together with monkey neurophysiology findings in support of an abstract number representation. Human imaging studies repeatedly revealed BOLD increase in bilateral hIPS in numerical tasks employing different presentation formats (Eger et al., 2009; Piazza et al., 2007), modes (Castelli et al., 2006; Piazza et al., 2006; Dormal et al., 2010) and modalities (Eger et al., 2003). Electrophysiology studies reported number-selective neurons in the ventral intraparietal sulcus (VIP) –the putative IPS homolog- of non-human primates (NHP) that code for numerosities from 1-5 independent of presentation mode (Nieder et al., 2006) and modality (Nieder, 2012). Behaviorally, numerosity adaptation across modalities in humans supports the idea of a generalized sense of numbers (Arrighi et al., 2014).
On the other hand, several findings question the idea that identical PPC circuits integrate numerosity information both across space and time, as suggested by Dehaene and Changeux (1993). First, being part of the dorsal stream, PPC plays a pivotal role in the processing of spatial information (Kravitz et al., 2011). In line with this, two studies (Shafritz, Gore, & Marois, 2002; Xu and Chun, 2006)) reported that the BOLD signal in IPS increases when an increasing number of objects are presented over space (simultaneously). However, no change in parietal activity was reported when a variable number of items were presented in the same
4 location (Shafritz, Gore, & Marois, 2002; Xu and Chun, 2006), suggesting that PPC integrates numerical information over space but not across time. Second, evidence for shared numerosity tuning for different presentation formats and modes predominantly comes from electrophysiological studies in non-human primates and small numerosities from 1 to 5 (Nieder et al., 2006; Nieder and Miller, 2004; Tudusciuc and Nieder, 2007). Only few studies tested the notion of a mode independent numerosity representation in humans (Castelli et al., 2006; Dormal et al., 2006; Piazza et al., 2006). Yet, none of these studies provided conclusive evidence due to confounds between numerosity and frequency (Dormal et al., 2010) or duration, or increased risk for false positive results from non-corrected data (Castelli et al., 2006). In light of these findings, it is still to be investigated if identical neural circuits in PPC contribute to the encoding of both sequential and simultaneous numerosities in a way that goes beyond common task activation.
Extant computational models of numerosity perception diverge on the notion of a labeled-line coding of numerosity (quantity is coded by the location of the activation in a population of linearly ordered neurons) but agree on a summation-coding instance (more quantity is coded by larger summed activity) and the idea that numerosity is abstracted from low-level visual features during encoding. Two prominent computational models of simultaneous numerosity extraction propose a hierarchy of sensitive and number-selective processing steps (Dehaene and Changeux, 1993; Verguts and Fias, 2004). First, spatial location of objects is coded in an object-location map. The activity in these units changes monotonically with increasing number of objects, reflecting summation coding. The summed activation is then fed into the next instance that contains number-selective units. Activity of these units decreases monotonically as numerical distance between preferred and actual numerosity increases. This dovetails with number-selective neurons in monkey area VIP (Nieder and Miller, 2004). Importantly, this model suggests that as one moves up in the
5 processing hierarchy, the importance of visual features like object-size and location should decrease and the importance of numerosity should increase. In humans, Roggeman et al. (2011) found a hierarchical organization along the occipital-to-parietal pathway for numerosities in the subitizing range (i.e. 1 to 5), in line with this computational model. BOLD signal in superior occipital cortex and the adjacent transition region between occipital and parietal cortex monotonically increased with numerosity. Areas in posterior superior parietal lobule (PSPL) and IPS, on the other hand, exhibited numerosity tuning such that BOLD signal decreased as numerical distance between preferred and presented numerosities increased. A more recent model of spatial numerosity perception used deep networks with two hidden layers that were trained to reproduce visual input numerosities (Stoianov and Zorzi, 2012). As in Dehaene and Changeux (1993) and Verguts and Fias (2004), the response of units in hidden layer two was unaffected by non-numerical features of the stimuli such as size or density of the input images, thereby providing a computational instantiation of a visual sense of numbers (Anobile et al., 2016; Burr and Ross, 2008), that emerged during unsupervised learning.
While computational studies foresee that simultaneous numerosity perception should be independent of visual features of the stimuli, Gebuis and Reynvoet (2012a, 2012b) reported that the performance in numerical comparison tasks depends on the congruity of numerosity with visual features like object size, convex hull and total area occupied. In line with this, monkey electrophysiology and human imaging suggest that object size and numerosity representations are intermingled in PPC (Harvey et al., 2013; Tudusciuc and Nieder, 2007). Although most studies try to control for non-numerical features using multiple stimulus sets with different visual features (see Dehaene, Izard, and Piazza 2005 for a discussion), it is very difficult, if not impossible, to decorrelate numerosity from all other sensory features (see Leibovich et al. 2016 for a discussion). Hence, more empirical data is needed to investigate whether previously observed numerosity tuning in simultaneous mode reflects the abstract numerosity information
6 from a visual scene or results from the weighted integration of several non-numerical dimensions like area, density and dot-size by Gebuis, Cohen Kadosh, and Gevers (2016).
For sequential numerosities, on the other hand, researchers assume the involvement of an accumulator that reflects increasing numerosity with increasing activity, potentially assisted by mechanisms that keep track of the serial position of an item in a sequence (Dormal et al. 2010; Nieder, Diester, and Tudusciuc 2006). A vast number of NHP perceptual decision-making studies found activity in lateral intraparietal area (LIP) to be closely correlated with evidence accumulation over time (Hanks et al., 2015; Shadlen and Newsome, 2001), even if their functional significance remains unclear since inactivation of these circuits does not affect decision-making performance (Katz et al., 2016). Whether in humans the accumulator instance for sequential mode coincides with the computational mechanisms for the encoding of simultaneous numerosities remains an open question.
The use of study designs that fail to disentangle domain-general processes (e.g. response selection) from numerosity processing further undermines the soundness of existing evidence for a mode-independent numerosity representation in PPC. It has long been known that the parietal cortex is involved in various aspects of task related processing ranging from working memory and attention to response selection (Dean et al., 2013; Koenigs et al., 2009; Malhotra et al., 2009; Shomstein, 2012). Hence, common BOLD increase in numerical tasks does not necessarily imply that the underlying representation for different formats and modes is the same. Yet, human imaging studies using multi-voxel pattern analysis (MVPA) endorse simultaneous numerosity encoding independent of response/task related processing (Bulthé et al., 2014; Castaldi et al., 2016; Dormal et al., 2010; Eger et al., 2013, 2009). Based on BOLD signal patterns from PPC these authors were able to decode the numerosities seen by the participants using MVPA. These results contrast with human imaging studies showing that parietal BOLD increase disappeared when response and task related factors are well controlled
7 in numerical tasks (Cavdaroglu et al., 2015; Göbel et al., 2004; Shuman and Kanwisher, 2004). Taken together, it still remains elusive whether identical PPC circuits integrate numerosity information in the absence of domain-general task requirements.
In this study, we investigated the neural basis of simultaneous and sequential numerosity perception to answer the questions outlined above. Specifically, we tested how simultaneous and sequential numerosities are encoded in the absence of response/task related processing using a task that probed comparison of numerosities only at random points throughout the experiment (Fig. 1). We used MVPA to inquire if there is a common coding scheme for simultaneous and sequential numerosities, which was not employed by previous studies investigating mode-independence. In addition, we used numerosities larger than four to see whether the previously reported gradient can also be observed for numerosities outside the subitizing range. This is important, since accumulating evidence suggests that subitizing and estimation of numerosities outside the subitizing range are two distinct processes, potentially hinging on different neural architectures (Burr, Turi, and Anobile 2010; Revkin et al. 2008; Piazza et al. 2002; Giovanni Anobile et al. 2012; Piazza et al. 2011). Last but not least, in simultaneous mode, we tested how encoding of non-numerical visual features in the occipito-parietal pathway changes along with numerosity using MVPA to study the specificity of previously reported PPC tuning for numerosities.
Materials and Methods
Participants
Twenty healthy right-handed participants underwent fMRI scanning after giving written informed consent. Three of them were excluded from further analysis due to excessive motion (more than the size of one voxel between subsequent volumes) or abortion of the experiment. The data from the remaining seventeen participants were analyzed subsequently (8 males, mean
8 age 27.35, SD = 4.64). All had normal or corrected-to-normal vision and reported no history of neurological or psychiatric diseases. The study was approved by Bernstein Center for Advanced Neuroimaging (BCAN, Nr. 165) and the Ethical committee of Humboldt Universität zu Berlin. Participants were reimbursed 24 €.
Stimuli
Participants were engaged in a non-symbolic numerosity processing task. The numerosities were presented on a black background using white dots. Spatial enumeration was probed by presenting simultaneous numerosities, presented as spatially scattered set of dots (dot clouds). Temporal enumeration was probed by presenting sequential numerosities. These were scattered over time by repeatedly flashing (on-off) a single white dot in the center of the screen. Four numerosities (5, 7, 11, and 16) outside the subitizing range were used. These numerosities were chosen as they had approximately equal distance from each other on logarithmic scale. Simultaneous numerosities were created using a set of Matlab scripts as described in Dehaene et al. (2005). The scripts were adapted such that the sensory properties of dot arrays (i.e. convex hull, density, diameter and total area) were written out during stimulus creation. Sequential numerosities were created using the method described in Cavdaroglu et al., (2015).
More specifically, non-numerical sensory features of simultaneous numerosities (i.e. dot-arrays) were controlled by two sets. In one set, the dot-size was kept constant whereas in the other set total area was kept constant. This way, the intensive (e.g. dot size and inter-item spacing) and extensive (e.g. total luminance and total area) features of stimuli were balanced over the whole stimulus set (see Dehaene et al., 2005 for a discussion).
The non-numerical features of sequential numerosities (”flickers”) were controlled in four sets. Single dot duration and total duration increased with numerosity in set 1 and decreased with numerosity in set 4. The interval between dots (ISI) increased with numerosity in set 2 and decreased with numerosity in set 3. Frequency (numerosity divided by total duration) increased
9 with numerosity in sets 3 and 4 and decreased with numerosity in sets 1 and 2. Hence, participants could not rely on a single sensory cue (i.e. duration, frequency or ISI) to extract numerosity. The individual dots were presented for a maximum duration of 270ms to prevent counting. Only in set 4 we used dot durations longer than 270ms as well. It was not possible to create a set of trials where total duration decreases with numerosity otherwise. This threshold was chosen based on previous studies which showed that participants cannot rely on verbal strategies (e.g. counting) within this time frame (e.g. Piazza et al., 2006; Tokita and Ishiguchi, 2011). Random jitters were introduced in sequential numerosities to prevent periodicity that may lead to the perception of rhythms. The length of the jitter depended on the single dot duration. It was calculated such that after the subtraction of that jitter, the duration of the single dot was 40ms (i.e. jitter = [dot duration − 40ms]). This procedure guaranteed that 1) each individual dot remained distinguishable from the previous or subsequent dot and 2) when the duration of a single dot was longer than 270ms, participants could not reliably count because the remaining stimuli in the sequence would still appear at a sufficiently high presentation rate to prevent counting. The size of dots was constant for a given numerosity sequence and was chosen randomly such that it matched the total area occupied by each dot-array in simultaneous stimuli. This ensured balanced illumination between simultaneous and sequential numerosities.
Stimuli were generated and presented using Matlab (MathWorks) and Psychtoolbox (Brainard, 1997; Kleiner et al., 2007; Pelli, 1997) and were projected with an LCD projector (60 Hz frame rate) onto a translucent screen in the bore of the scanner and viewed through a mirror mounted on the head coil. The duration of each dot and ISI in sequential stimuli was calculated as multiples of the refresh rate of the monitor (60Hz) and the presentation of all the dots was synchronized with vertical refresh of the projector.
Experimental Task and Design
To separate decision and response related activations from numerosity perception, participants responded only in one third of trials (henceforth ‘response trials’). In response
10 trials, two numerosities from the same mode (simultaneous or sequential) were presented one after the other (see Fig. 1). Participants indicated via left (first) or right (second) button press which of the two sequentially presented numerosities was numerically larger. The numerosities in a given response trial differed by 25% to balance difficulty across numerosities. That is, while the first numerosity in a given response trial was drawn from the set comprising 5, 7, 11 or 16, the second numerosity in that trial could be either 25% smaller or larger than the first numerosity. For example, when the first numerosity in a given trial was a temporally scattered sequence of 7 dots flashed in the center of the screen (i.e. sequential numerosity 7), the second numerosity in that trial would have comprised either 5 or 9 dots flashed in the center of the screen. In the remaining two thirds of trials, no response was required (henceforth ‘non-response trials’).
Upon presentation of a given numerosity, the participants did not know whether they would have to make a comparison with that numerosity later. This information was conveyed via the color of the fixation cross only after they were exposed to the numerosity. If the color of the fixation cross that followed the numerosity changed from red to blue (i.e. response trial), participants had to compare it with the upcoming numerosity. If the fixation-cross remained red until the next numerosity appeared, they were instructed to forget the previous numerosity and concentrate on the new one (i.e. non-response trials, a new trial begins if the color of the fixation-cross remains red). This way, we encouraged participants to pay attention to the numerical dimension of stimuli throughout the experiment without having any comparison or response related confounds in numerosity perception in non-response trials (Fig. 1).
<< Figure 1 >>
The experiment had a fast event-related design. The timing of stimuli was optimized using simulation with fMRI design software (efMRI V9) and a stochastic design
11 (http://archive.is/rhI2t). This type of design allows for shorter scanning periods with greater statistical power than deterministic designs (i.e. fixed ISI) or purely random ISIs (Dale, 1999; Friston et al., 1999). The order of conditions and the length of the inter-stimulus interval (ISI) were determined using an exponential function (Dale, 1999). Specifically, the ISI was randomized from an exponential distribution, taking into account the minimum ISI of 4000ms, maximum ISI of 9000ms and an average ISI of 6000ms (Friston et al., 1999). The time of the jittered fixation-cross was adjusted accordingly. Double-Gamma HRF emulation was used to emulate the SPM hemodynamic response function (HRF). Five conditions were passed into the software to get the optimized presentation time for simultaneous non-response, simultaneous response, sequential non-response, sequential response and null event (i.e. fixation) trials. Trials were randomly distributed between four numerosities used in the experiment (i.e. 5, 7, 11, and 16) within each condition.
The duration of null events was fixed at 1.4s, which was the average duration of all trials. Simultaneous numerosities were presented for 200ms to avoid eye movements and counting. Sequential numerosities had a total duration between 630 and 4870ms. The duration of the fixation-cross (i.e. ISI) after each response trial varied between 4071 and 8872ms, and was identical for sequential and simultaneous numerosities. The duration of the fixation-cross between the first and second numerosity in response trials was chosen randomly from ISI durations used in between each stimulus trial. The experiment consisted of eight blocks in total. In each block, there were sixty-four non-response trials (half simultaneous), thirty-two response trials (half simultaneous) and eight null events which lasted in total around ~9mins. Hence, the total duration of the main fMRI task was ~72mins.
In non-response trials, an equal number of trials were drawn from each stimulus set. That is, in one block, there were sixteen numerosities from each simultaneous set and eight numerosities from each sequential set (i.e. 16 × 2 sets = 32 simultaneous numerosities and 8 × 4 sets = 32 sequential numerosities). In response-trials, an equal number of trials were drawn
12 from each stimulus set. Importantly, the first and second numerosities were always drawn from different sets to make sure that participants could not rely on non-numerical sensory features while they were comparing the two numerosities. Furthermore, both response and non-response trials had an equal amount of trials per numerosity and an equal number of stimuli were drawn from each set.
Localizer Task
To independently determine functional ROIs for multivariate analysis, a 12 minutes functional localizer was created using Psychtoolbox (Brainard, 1997; Kleiner et al., 2007; Pelli, 1997) and presented after the numerical task. The task is an adapted version of the localizer described in Cavdaroglu et al. (2015) with an additional visual motion localizer appended. It consisted of reading, date recall, mental subtraction, object grasping, house roof color naming, saccade formation, motion and rest conditions.
Reading, subtraction and date recall conditions were presented using an optimized rapid event related design (see Cavdaroglu et al., 2015 for all the details about timing). Ten simple sentences (“Bears are fond of salmon and honey”), subtraction problem sentences (“Calculate eleven minus five”) (translated from Pinel et al., 2007) and novel date recall sentences (“The date of New Year's Eve is ____”), were intermixed with ten rest periods, for a total of 40 trials. In all three conditions, participants were instructed to silently read the sentences and mentally generate an answer when necessary (subtraction and date recall) without giving an explicit response. In the rest condition, a blank screen with a central fixation dot was presented.
Object grasping, saccades and roof color naming blocks were presented using an optimized epoch design. Black and white illustrations of graspable objects (e.g. scissor, cup; courtesy of Philippe Pinel), multidirectional (360°) saccade targets and photographs of houses with different roof colors, were presented. In object grasping trials, participants were instructed to mentally imagine grasping the objects with their dominant (right) hand. In saccade trials,
13 three saccades were made through following a saccade target (+). In house roof color naming, participants were instructed to silently name the roof color. All trials were alternated with jittered fixation trials, with a minimum ISI of 4000ms.
The visual motion localizer was added as we found increases in the BOLD signal in MT during processing of non-symbolic numerosities in a previous experiment (Cavdaroglu et al., 2015). The motion localizer was based on the MT localizer described in Takemura et al. (2012). Two hundred white dots (0.25°) were presented on a black background with a circular aperture of 20° diameter centered at the fixation point. In a 12s motion block, the dots moved inwards and outwards at a speed of 8°/s. The motion block was followed by a 12s stationary block. Each dot lasted for 10 frames and it was replaced at a random position once the life time ended. Moreover, the dots that crossed the borders of the circle during outward motion were replaced at random locations within the circle as well as the dots that reached the central fixation during inward motion. Nine pairs of motion and non-motion blocks were run in total.
fMRI data acquisition
Functional images were acquired at the Berlin Center for Advanced Neuroimaging (BCAN) with a 3T Siemens TIM Trio scanner (Siemens, Erlangen), using a 12-channel head coil. Before the experiment, a T1-weighted image (MPRAGE) was collected as high-resolution anatomical reference (TR = 1900ms, TE = 2.52ms, flip angle = 9°, FOV = 256mm × 256mm × 192mm, resolution = 1mm). T2* -weighted gradient-echo echo-planar images were collected during the experiment (TR = 2500ms, TE = 25ms, flip angle = 82°, FOV = 190mm × 190mm, resolution = 2.5mm, slices = 42 slices with a 20% distance factor; interleaved acquisition order). Finally, T2*-weighted gradient-echo echo-planar images were collected during the localizer task (TR = 2000ms, TE = 30ms, flip angle = 78°, FoV = 192mm × 192mm, resolution = 3mm, slices = 33 with a 25% distance; descending acquisition order). The first two images in each series served to guarantee stable magnetization and were not recorded. After the acquisition of the anatomical
14 image as well as before the localizer, a magnetic field mapping sequence was run to correct for inhomogeneities in the magnetic field (TR = 400ms, TE = 5.19ms/7.65ms, flip angle = 60°, FOV = 192mm × 192mm, resolution = 3mm, slice gap = 25%, slices = 33).
fMRI data analysis
Images were analyzed using Statistical Parametric Mapping software (SPM8; Wellcome Trust Centre for Neuroimaging; http://www.fil.ion.ucl.ac.uk/spm/). Functional images were first reoriented to the anatomical reference and then corrected for inhomogeneities in the magnetic field. Subsequent preprocessing included slice-timing correction (where middle image in the time series was taken as the reference), spatial realignment and unwarping, co-registration to the unwarped mean image, segmentation, normalization to standard Montreal Neurological Institute (MNI) space and smoothing (FWMH = 6 × 6 × 6mm).
After preprocessing, a general linear mode (GLM) based on numerosity was defined using a canonical hemodynamic response function. The numerosity model included a regressor for each numerosity (5, 7, 11 and 16); separately for simultaneous/sequential modes and response/non-response trials as well as a regressor for null events. In response trials, the first and second numerosities were also modeled separately. Thus, the numerosity-GLM had 33 regressors in total along with 6 movement parameters from preprocessing to capture signal variations due to head motion. The event-related numerosity regressors were locked to the onset of the numerosity presentation. The null events were used as baseline for the contrasts in univariate analysis.
All the contrasts reported in this paper were corrected with FDR at p = .05 on cluster level, p = .001 on voxel level with minimum cluster size 15 using xjView (http://www.alivelearn.net/xjview).
Unsmoothed images from the preprocessed data were used for multivariate analysis to preserve the maximal amount of spatial information. Pattern classification was performed using
15 linear support vector machines (SVM) on The Decoding Toolbox (Hebart et al., 2015) with regularization parameter [C] set to 1 (LIBSVM 3.12, Chang and Lin, 2011). A one-block-out cross validation scheme was employed. That is, one experimental block was left as the test data and the remaining seven blocks were used to train the classifier. The left-out block was iterated over all eight blocks and an average decoding accuracy estimate was obtained at the end.
To investigate how numerosity-specific the pattern recognition results were in simultaneous trials, the stimuli were re-organized for each sensory feature (i.e. convex hull, density, diameter and total area) such that there were four categories for the respective sensory feature. That is, instead of labeling the dot arrays based on the number of dots (i.e. 5, 7, 11 and 16), we labeled them with the corresponding category (e.g. based on how big the total area is) in four different models that were based on the convex hull, total area, density or diameter of the dots in the stimulus. Since perfect balancing of the number of trials in each category was not possible in all cases, we corrected for the remaining numerical imbalances between different categories by using the balanced accuracies (that are provided by The Decoding Toolbox) during the statistical testing of multivariate analysis results for sensory features.
Analysis of the localizer data and ROI extraction
Preprocessing of the localizer data was identical to the functional data besides the reference slice used for slice-timing correction (first image) and the order of slice-timing correction and spatial alignment (here, spatial alignment and unwarping was performed before slice-timing correction due to differences in slice acquisition order). After preprocessing, the localizer task was modeled by a canonical hemodynamic response function and a GLM was defined that included a regressor for each condition (houses, objects, dates, reading, subtraction, saccades, motion and fixation) and 6 motion parameters from preprocessing to capture signal variations due to head motion.
16 For MVPA, bilateral parietal ROIs were extracted from the combination of F-contrast (main task) on a subject-by-subject basis and subtraction minus reading contrast (localizer task) on group level within a mask of parietal cortex (WFU PickAtlas, Maldjian et al., 2004, 2003). Within these masks, the 500 most active voxels were chosen as subjective ROIs (Fig. 1B). The group level ‘subtraction minus reading’ contrast was used, as there were not enough voxels for most subjects on individual level.
Finally, to investigate how the representation of numerosity and other sensory features evolve along the visual hierarchy, we created two ROIs separating striate from extrastriate areas of the visual cortex. The first visual ROI was a combination of ‘houses minus rest’ contrast (localizer task) on subject-by-subject basis within a mask of ‘occipital cortex minus striate cortex’ (Anatomy Toolbox, Eickhoff et al., 2007, 2006, 2005; Fig. 1B). The second visual ROI was a combination of ‘houses minus rest contrast’ (localizer task) on a subject-by-subject basis within a mask of striate cortex (V1, WFU atlas, Maldjian et al., 2004, 2003; Fig. 1B). Hence, the first visual ROI included the extrastriate areas whereas the second visual ROI included only the striate cortex. For both ROIs, the 500 most active voxels within these masks were chosen as subjective ROIs.
Tuning Curves
Similar to the analysis of single neuron numerosity tuning (e.g. Nieder, 2012; Viswanathan & Nieder, 2013), we determined for each participant which numerosity a given voxel responded to maximally by searching for the maximal beta weight from the above described model containing all numerosities in simultaneous mode. Since one of the aims of this study was to analyze whether the extraction of numerosities outside subitizing range is organized along an occipital-to-parietal gradient, we defined six non-overlapping ROIs in each hemisphere that covered the entire dorsal pathway from striate to parietal areas (see left inset in Fig. 2D). All ROIs were boxes including 768 voxels (640 mm³), collapsed across the two hemispheres. The
17 lower three ROIs had an extension of 16 x 12 x 4 voxels centered on the following coordinates (x, y , z; from occipital to parietal): (0, -90, 6), (0, -90, 18), (0, -80, 30). The upper three ROIs had an extension of 8 x 12 x 4 voxels in each hemisphere, centered on the following coordinates (x, y , z; from occipital to parietal): ( ±15, -70, 42), (±20, -60, 54), (±25, -50, 66).
Along this gradient, we computed the voxel-wise tuning functions and averaged across numerosities to determine the average numerosity tuning at each level of the gradient (see Serences et al., 2009 for an example). That is, we centered the numerosity-specific tuning curves on the preferred numerosity and pooled across preferred numerosities. For example, the BOLD response for numerosity 7 in voxels that respond maximally to numerosity 5 (approximate log distance: 0.15) is pooled with responses to numerosity 16 in voxels that respond maximally to numerosity 11 (approximate log distance: 0.16). The resulting numerosity tuning functions indicate the degree to which voxels in each ROI change their response as a function of numerical distance between preferred and presented numerosity. For each ROI, we computed two linear regressions on the numerosity tuning functions, one for negative numerical deviations from the preferred numerosity and one for positive. In a last step, we averaged the two regression coefficients to compute an intuitive measure of numerosity filter precision along the ROI gradient. All tuning curve analyses are based on 14 participants only, since we excluded participants who did not show at least one activated voxel in every ROI.
Results
Behavioral Results
The mean accuracy was 79.46% (SD 8.52%) for simultaneous response trials and 72.67% (SD 6.75%) for sequential response trials. In both modes, participants performed significantly above chance (t(16) = 14.238, p < .001 for simultaneous and t(16) = 13.852, p < .001 for sequential). We
18 (simultaneous, sequential) and numerosity (5, 7, 11 and 16) and found a main effect of mode (Fig. 2, F(1,16) = 13.761, p = .002), numerosity (F(1,16) = 16.271, p < .001) as well as an interaction
between mode and numerosity (F(1,16) = 5.034, p = .004). Post-hoc tests revealed that in
simultaneous trials, the comparison accuracy for numerosity 7 was significantly higher than the accuracy for numerosity 16 (t(1,16) = 5.22, p = .001; Bonferroni corrected). In sequential trials,
comparison accuracies for numerosity 7 and 11 were significantly higher than for numerosity 5 (t(16) = 5.912, p = .009; t(16) = 5.748, p < .001 respectively; Bonferroni corrected) and the
accuracy for 11 was significantly higher than 16 (t(16) = 4.188, p = .005; Bonferroni corrected).
Participants were significantly more accurate in simultaneous compared to sequential response trials (t(16) = 4.485, p < .001).
fMRI Results Univariate analysis
The BOLD signal during non-response trials was captured by contrasting all numerosities against baseline, irrespective of numerosity and separately for simultaneous and sequential trials. For simultaneous numerosities in non-response trials, BOLD signal increased significantly in bilateral visual areas, bilateral intraparietal lobule, left-hemispheric superior parietal lobule and bilateral frontal gyrus (purple color in Fig. 2A and supplementary table 1). For sequential numerosities in non-response trials, BOLD signal increased significantly in bilateral primary visual areas, right-hemispheric superior temporal sulcus, left insula and precentral gyrus, and right-hemispheric BA 44 (orange color in Fig. 2A and supplementary table 1). Only in the frontal cortex (BA 44) and visual cortex (V5 and Area 18) did the BOLD signal increased when we inclusively masked simultaneous and sequential non-response trials (yellow areas in Fig. 2A, supplementary table 2).
19 Since previous studies found parietal involvement during sequential numerosity processing, the absence of parietal activation may simply be due to a lack of statistical power. To increase statistical power for sequential numerosities, we included 13 participants (healthy adults; 4 males; mean age = 26.3 ±6.29 years) from a previous experiment who performed the same task on the same visual sequential numerosity stimuli (for more details see Cavdaroglu et al., 2015). While activity in occipital areas remains stable across the two studies, no parietal activation can be observed for sequential numerosities in the absence of active response preparation despite considerably increased statistical power (cf. Supplementary Fig. 1). No such analysis was done for simultaneous numerosities since participants in the previous study (Cavdaroglu et al., 2015) were presented with auditory numerosities instead.
To further probe brain areas that were more activated for sequential or simultaneous numerosities, respectively, we contrasted both modes against each other. Simultaneous numerosities evoked more activity in bilateral parietal cortex, bilateral area V3v, and right middle occipital gyrus (purple in Fig. 2B). Areas that were more active during encoding of sequential numerosities include bilateral occipital cortex (middle occipital gyrus, left area 18 and area 4p), middle cingulate cortex, left insula and bilateral precentral sulcus (orange in Fig. 2B). Peak coordinates and cluster sizes are reported in supplementary table 3.
The BOLD signal for response trials was captured by contrasting the second numerosity in response trials against non-response trials separately for simultaneous and sequential numerosities. As the comparison (and response) came right after the presentation of the second numerosity, this contrast included comparison/response related activity. We observed the classic fronto-parietal task-positive network (Fox et al., 2005); see supplementary Fig. 2A) . The BOLD signal increased prominently in the parietal cortex (as well as other areas) for response trials both in simultaneous and sequential mode
20 In order to investigate the areas that show summation coding like activity, we subtracted the BOLD signal for smaller numerosities (5 and 7) from the BOLD signal for larger numerosities (11 and 16). Only visual cortex exhibited summation coding like activity for both simultaneous and sequential numerosities (Fig. 2E).
Multivariate analysis
For multivariate analysis, we chose ROIs from PPC, extrastriate cortex and striate cortex based on a combination of localizer and task activity (see Methods for details; see Fig. 1B for ROIs). To test whether the decoding accuracies in parietal cortex were significantly different from chance classification, we ran a permutation analysis with 1000 cycles where the labels of training data were shuffled and randomized. We tested the average MVPA accuracies per participant against the accuracies from the permutation analyses for both modes (simultaneous and sequential). While the decoding accuracy for simultaneous numerosities was significantly higher than chance in the parietal ROI (t(16) = 2.25, p = .039), the decoding accuracy for
sequential numerosities did not reach significance (t(16) = 0.44, p = .66; see Fig. 2C for graphical
depiction of decoding accuracies and (see Supplementary Fig. 2B for confusion matrices).
To test whether the decoding accuracies in visual and parietal cortices were significantly different from chance classification, we run a permutation analysis with 1000 cycles where the labels of training data were shuffled and randomized. We tested the MVPA accuracies per participant against the accuracies from the permutation analyses for all measures (convex hull, density, diameter, total area and numerosity) and ROIs (striate, extrastriate, and parietal). As one of the stimulus sets for simultaneous numerosities had constant diameter, there was an imbalance in the number of trials for that diameter category in MVPA analysis. While half of the trials had the same diameter, the other half had four different diameter values where the
21 diameter decreased with increasing numerosity (i.e. the set where total area was constant, hence diameter was decreasing with increasing numerosity). To overcome this, we grouped the diameters in the set where total area was constant in two categories (number 5 and 7 one category as their diameter was closer to each other, 11 and 16 another) and picked equal number of trials from the other set where diameter size was constant. Hence, only for diameter, we had three categories instead of four. Decoding accuracies for numerosity and diameter were significant in all ROIs (numerosity: t(16) = 2.39, p= .03; t(16) = 2.6, p = .02; t(16) = 2.24, p =.03;
diameter: t(16) = 5.5, p < .001; t(16) = 4.46, p < .001; t(16) = 3.92, p = .001 for striate, extra-striate
and parietal respectively; see Fig. 2C for graphical depiction of decoding accuracies and supplementary Fig. 2B for confusion matrices). Decoding accuracies for total area and density were significant only in striate and extrastriate areas (total area: t(16) = 3.36, p = .004; t(16) = 3.6,
p = .002; t(16) = 0.667, p = .51; density: t(16) = 3.88, p = .001; t(16) = 3.79, p = .002; t(16) = 1.45,
p = .167 for striate, extra-striate and parietal respectively). Finally, decoding accuracies for convex hull were significant only in the striate visual cortex (t(16) = 4.02, p < .001; t(16) = 1.45,
p = .17; t(16) = 0.68, p = .51 for striate, extra-striate and parietal respectively).
To investigate if any of the ROIs had a mode-independent representation, we tested whether the classifier could discriminate presentation modes (simultaneous and sequential). Again, we statistically validated the resulting accuracies against the accuracies obtained from the permutation analysis with 128 cycles –which was the highest possible amount of permutations- where labels of training data were shuffled and randomized. Interestingly, decoding accuracies for presentation mode were significantly above chance in all the ROIs tested (striate: t(16) = 24.87, p < .001; extrastriate: t(16) = 15.93, p < .001; parietal: t(16) = 5.15, p
< .001) indicating separate representations for simultaneous and sequential numerosities. We observed overlapping activity for simultaneous and sequential numerosities in left and right precentral gyrus. The assumption that these regions provide the abstract convergence of sequential and simultaneous numerosities stipulates (a) significant activation and (b)
22 numerosity specificity as tested with MVPA that (c) generalizes across modes (i.e. sequential to simultaneous, simultaneous to sequential). However, for none of these regions, we were able to significantly decode numerosity (precentral gyrus: p = .4338 for simultaneous, p = .5156 for sequential). This contradicts conditions (b) and (c).
Tuning profiles
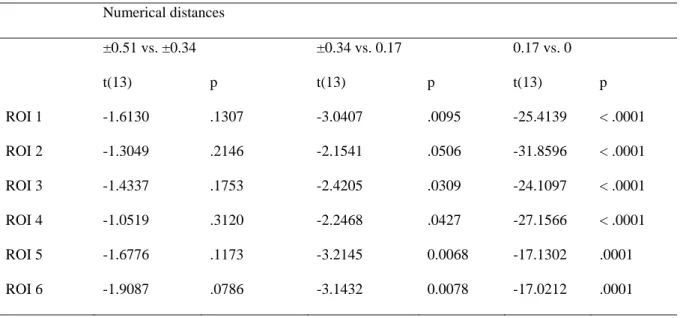
Similar to the analysis of single neuron numerosity tuning (e.g. Nieder, 2012; Viswanathan & Nieder, 2013), we determined for each participant which numerosity a given voxel responded to maximally and computed voxel-wise tuning curves along an occipital-to-parietal gradient. First, we observed number-selective voxels at each step within the gradient from occipital to parietal cortex (Fig. 2D). We found a significantly positive regression slope in all ROIs (all t(13) > 14 with ps < .0001). However, the slopes varied as a function of ROI (F(5, 65) = 9.093, p = .0001). Pair-wise comparisons between neighboring ROIs revealed that the slope was significantly larger in ROI 3 compared to ROI 2 (t(13) = 2.83, p = .014). Maximal slope was observed in ROI 6, where it was larger compared to ROI 5 (t(13) = 2.49, p = .027). We found that numerical distance from preferred numerosity (F(3, 39) = 426.27, p < .0001, ε = .619) and ROI (F(4, 65) = 4.84, p = .006, ε = .603) had a significant impact on brain activity, that significantly interacted with each other (F(15, 195) = 5.59, p = .0003, ε = .324). Within each ROI we observed a significant change of activity as numerical distance between preferred and actual numerosity increased (all ps < .0001). We found that within all ROIs except ROI 3 the comparison between numerical distances ±.51 and ±.34 was not significant while all other comparisons between adjacent distances were significant (table 4). This implies that in all ROIs except ROI 3 the tuning was most marked for numerosities numerically close to the preferred
23 numerosity and became increasingly blurred for non-preferred numerosities deviating maximally from the preferred numerosity.
<< table 4 >>
Discussion
Whether the parietal cortex hosts a mode-independent semantic representation of numerosity has long been debated. Here, we probed sequential (i.e. dots presented over time) and simultaneous (i.e. dots presented over space) numerosity perception while recording BOLD response. Going beyond previous studies, we tested numerosities outside the subitizing range and isolated perception from decision and response-related processes. We found an increase in the parietal BOLD signal during the presentation of simultaneous numerosities but not during the presentation of sequential numerosities. Using MVPA we successfully trained a classifier to decode simultaneous numerosity from the BOLD signal in the parietal cortex, providing further confirmation of numerosity selective activity in these areas. No better-than-chance classification was observed for sequential numerosities in the same ROIs. These results imply distinct underlying coding schemes for sequential and simultaneous numerosities. This idea is further supported by significant decoding of the presentation mode (i.e. simultaneous vs. sequential) in the parietal ROIs. We used ROI-based MVPA to further explore how the encoding of simultaneous numerosity and other visual features (i.e. convex hull, total area, density and diameter) evolves from the primary visual cortex to the parietal cortex. While striate and extrastriate areas gave rise to successful classification of both non-numerical visual features and numerosity, parietal ROIs allowed for decoding of numerosity and dot diameter only, suggesting a higher-level representation in the parietal cortex beyond sensory features. We found voxel-wise numerosity tuning functions for simultaneous numerosities in occipital and parietal ROIs. Numerosity selectivity increased along an occipito-parietal gradient reaching
24 maximal selectivity in parietal areas. We observed overlapping summation coding profiles (higher BOLD signal for large numerosities vs. small numerosities) for sequential and simultaneous numerosities in low-level visual areas only.
Previous human neuroimaging found an occipital-parietal gradient for numerosities in the subitizing range that associated occipital areas with a location map, occipito-parietal areas with summation coding and superior parietal areas and IPS with number-selective coding (Roggeman et al., 2011). Our results complement these in several ways. First, we found selectivity in PPC for simultaneous numerosities outside subitizing range and independent from response requirements. This suggests that the number-selective coding scheme that is at the top of the model of Dehaene and Changeux (1993) may generalize to larger numerosities. Note that at the time when proposing their model, Dehaene and Changeux (1993) did not consider subitizing to be a different process from estimation (Revkin et al., 2008). Hence, our results provide the first empirical extrapolation of this model to larger numerosities in the light of recent evidence that imply a procedural distinction between small and large numerosities (Anobile et al., 2014; Revkin et al., 2008). Second, unlike striate and extrastriate areas, parietal cortex did not allow for the decoding of non-numerical stimulus features such as density or convex hull, supporting the notion of a high-level abstract number code in IPS. This notion is in line with recent neuroimaging findings that observed number-selective activity patterns in IPS in both adults (Bulthé et al., 2015; Castaldi et al., 2016; Eger et al., 2013) and adolescents (Wilkey et al., 2017). With respect to the question whether (Bulthé et al., 2015; Eger et al., 2013) or not (Castaldi et al., 2016) striate and extrastriate areas allow numerosity decoding, our results suggest that numerosity is represented in the striate and extrastriate areas as well as parietal cortex. At the same time, non-numerical stimulus features such as density and convex hull were decodable only in striate and extrastriate areas but not in parietal cortex. Together, this underlines the idea that numerosity (a) can be conceived of as a primary visual feature that
25 influences activity patterns during early processing steps in the visual system and (b) that numerosity is abtracted away from these physical features of the visual scene as activity travels up towards IPS. The interaction between numerical and non-numerical information along the visual processing hierarchy remains an important question to unravel in the future.
Finally, unlike Roggeman et al. (2011) we did not observe areas in the occipito-parietal transition zone that exhibit a summation coding scheme for simultaneous numerosities. However, contrasting large with small simultaneous numerosities revealed summation coding in low-level visual areas, close to the occipital pole. These voxels partially overlapped with voxels that were more active for large sequential numerosities compared to small sequential numerosities. Sequential summation coding was also observed in occipital areas along the calcarine sulcus and in superior occipital areas, most likely reflecting longer stimulation during larger numerosities. Hence, it remains an open question to what extent previously observed priority maps in superior posterior parietal cortex (Knops et al., 2014) contribute to a summation mechanism during numerosity extraction, as suggested by prominent computational models (Dehaene and Changeux, 1993; Verguts and Fias, 2004).
Monkey area VIP has been shown to contain (a) distinct neuronal circuits for the coding of simultaneous and sequential numerosities and (b) overlapping neural circuits for the maintenance of numerosities from either mode (Nieder et al., 2006). Furthermore, a recent fMRI study revealed adaptation for sequential numerosities in human IPS (Wang et al., 2015). Although our results seem to contradict these findings, it should be noted that both studies employed small numerosities (1-4 and 2-6 respectively). Moreover, fMRI adaptation and primate neurophysiology can measure neural activity on sub-voxel level whereas GLM and MVPA measure the activity from tens or hundreds of voxels that contain millions of neurons (Logothetis, 2008). While primate neurophysiology studies measure spiking activity from single neurons, fMRI BOLD signal correlates better with local field potentials (Goense &
26 Logothetis, 2008). These render a one-to-one mapping between MVPA analysis and adaptation studies or neurophysiology difficult. We observed overlapping activity in prefrontal cortex. This may be interpreted as the neural instantiation of a high-level integration of numerosity information across modes and modalities that has been observed on the behavioral level (Arrighi et al., 2014). In order to claim that these regions were actually providing the abstract convergence of sequential and simultaneous numerosities would require (a) significant activation and (b) numerosity specificity as tested with MVPA that (c) generalizes across modes (i.e. sequential to simultaneous & simultaneous to sequential). However, for none of these regions, we were able to significantly decode numerosity. This contradicts conditions (b) and (c). Hence we do not consider these regions to contribute to numerosity coding in our experiment. Alternatively, areas in premotor cortex and inferior frontal gyrus have recently been suggested to be involved in the maintenance of sensory information (frequency) across different modalities (tactile and visual) in working memory (Spitzer et al., 2014). These authors suggest that the role of frontal areas goes well beyond executive control functions but is more closely associated to the sensory content in working memory. Hence, these areas may provide a more abstract convergence zone for numerosity information in working memory. It remains unclear, however, why Wu et al. (2018) observed a parametric modulation of activity in precentral areas, while we did not observe a systematic modulation of activity as a function of numerosity. Our finding makes sense under the assumption that participants did not maintain the raw primary percept in WM but rather retained the abstract numerosity information. The present study was not designed to distinguish between encoding and working memory maintenance, and our data to not allow disentangling these processes. Future studies with a more stringent design are needed to clarify differential roles of prefrontal and parietal areas during encoding and working memory maintenance, and how this is associated with supramodal integration that is observed in behavior.
27 One may argue that encoding of sequential information is associated with higher working memory demands compared to the processing of simultaneous numerosities and that the long inter-stimulus interval in the current study particularly affects the maintenance of sequential numerosities. The fact that participants were overall performing better in response trials for simultaneous numerosities compared to sequential numerosities may be interpreted in this vein. On the neural level, higher working memory demands should lead to higher activity in working memory related areas. Working memory is usually associated with activity in a frontoparietal network, comprising parietal and prefrontal areas (e.g., Li et al., 2014; Ma et al., 2014; Xu and Chun, 2006). Our results fit nicely with previous results (Xu and Chun, 2006), that showed that even with much shorter ISIs (i.e. 1000 - 1200 ms), superior parietal activity in a working memory task showed significantly smaller modulation of activity as a function of set size in response to sequential presentation at a center location (comparable to the present study) compared to sequential off-center presentation (cf. Fig. 2 in Xu and Chun, 2006). Inferior parietal cortex did not exhibit any modulation of activity as a function of set size with sequential presentation at center. Alternatively, the difference between sequential and simultaneous numerosities may result from higher encoding demands for sequential numerosities. However, even if encoding sequential numerosity information is more demanding compared to simultaneous encoding, this is not associated with higher parietal activity for sequential numerosities. This further undermines the idea that parietal areas play a pivotal role during the encoding of sequential numerosities.
Human neuroimaging suggested overlapping representations of sequential and simultaneous numerosities (Castelli et al., 2006; Piazza et al., 2006; Dormal et al., 2010). However, these neuroimaging studies were difficult to interpret due to confounds between numerical and non-numerical stimulus features in the sequential mode (e.g. Dormal et al., 2010 used constant duration, confounding numerosity with frequency) and the use of an active
28 comparison task that may in and by itself activate parietal cortex that is part of a domain generalized, non-specific network (Hugdahl et al., 2015). Our results question the assumption that in the absence of decisional and response-related requirements, numerosities from different modes converge on a common, abstract and mode-independent representation in parietal cortex. Instead, we show that when isolating sequential numerosity perception from response requirement and carefully orthogonalizing temporal and numerical stimulus dimensions, parietal BOLD signal remains under threshold for sequential mode, even when pooling across different studies to increase statistical power.
Previous studies suggest an association between numerosity perception and formal math competencies (Feigenson et al., 2013). Despite the convergence of numerosity information from various modes and modalities that is evident from a number of behavioral studies (Arrighi et al., 2014), recent evidence found only spatially distributed numerosities to be associated with formal math skills (Anobile et al., 2018). Against this background, our results suggest that it may be parietal cortex activity that drives the association between the approximate number system and formal math skills. On a functional level, this parallels the idea that structural features of parietal cortex correlate with formal math skills (Price et al., 2016)
To conclude, while the absence of evidence may not be confounded with evidence for absence, considering the MVPA results, our study casts some doubt on the idea of a mode-independent numerosity representation in IPS. As the neural circuits for simultaneous and sequential numerosity comparison largely overlap in response trials, our results do not contradict with previous studies that used numerical tasks and reported common activation for both modes. It remains unclear, however, whether the role of parietal cortex during previous studies was to encode numerosity or to contribute to domain-general task components such as decision making and response preparation.
29
Acknowledgements
This work was supported by a grant (KN 959/2-1) from Deutsche Forschungsgemeinschaft/German Research Council (DFG) to Andre´ Knops in support of Seda Cavdaroglu.
References
Anobile, G., Cicchini, G.M., Burr, D.C., 2016. Number As a Primary Perceptual Attribute: A Review. Perception 45, 1–27. https://doi.org/10.1177/0301006615602599
Anobile, G., Cicchini, G.M., Burr, D.C., 2014. Separate mechanisms for perception of numerosity and density. Psychol. Sci. 25, 265–70.
https://doi.org/10.1177/0956797613501520
Anobile, G., Turi, M., Cicchini, G., Burr, D., 2012. The effects of cross-sensory attentional demand on subitizing and on mapping number onto space. Vision Res.
https://doi.org/10.1016/j.visres.2012.06.005
Arrighi, R., Togoli, I., Burr, D.C., 2014. A generalized sense of number. Proc. R. Soc. B 281, 20141791. https://doi.org/10.1098/rspb.2014.1791
Brainard, D.H., 1997. The Psychophysics Toolbox. Spat. Vis. 10, 433–436. https://doi.org/10.1163/156856897X00357
Browser, I., n.d. A . Ich habe noch kein Office 365 Konto . Wie löse ich meinen
Validierungsschlüssel ein ? B . Ich habe bereits ein Office 365 Konto und möchte es verlängern 1–2.
Bulthé, J., De Smedt, B., Op de Beeck, H.P., 2015. Visual number beats abstract numerical magnitude: Format-dependent representation of Arabic digits and dot patterns in human parietal cortex. J. Cogn. Neurosci. 27. https://doi.org/10.1162/jocn
Bulthé, J., De Smedt, B., Op de Beeck, H.P., 2014. Format-dependent representations of symbolic and non-symbolic numbers in the human cortex as revealed by multi-voxel pattern analyses. Neuroimage 87, 311–322.
https://doi.org/10.1016/j.neuroimage.2013.10.049
Burr, D., Ross, J., 2008. A visual sense of number. Curr. Biol. 18, 425–428. https://doi.org/10.1016/j.cub.2008.02.052
Burr, D.C., Turi, M., Anobile, G., 2010. Subitizing but not estimation of numerosity requires attentional resources. J. Vis. 10, 1–10. https://doi.org/10.1167/10.6.20.Introduction Castaldi, E., Aagten-Murphy, D., Tosetti, M., Burr, D., Morrone, M.C., 2016. Effects of adaptation on numerosity decoding in the human brain. Neuroimage 143, 364–377. https://doi.org/10.1016/j.neuroimage.2016.09.020
Castelli, F., Glaser, D.E., Butterworth, B., 2006. Discrete and analogue quantity processing in the parietal lobe: a functional MRI study. Proc. Natl. Acad. Sci. U. S. A. 103, 4693–
30 4698. https://doi.org/10.1073/pnas.0600444103
Cavdaroglu, S., Katz, C., Knops, A., 2015. Dissociating estimation from comparison and response eliminates parietal involvement in sequential numerosity perception. Neuroimage 116, 135–148. https://doi.org/10.1016/j.neuroimage.2015.04.019
Chang, C., Lin, C., 2011. LIBSVM: a library for support vector machines. ACM Trans. Intell. Syst. … 1–39.
Cohen Kadosh, R., Walsh, V., 2009. Numerical representation in the parietal lobes: abstract or not abstract? Behav. Brain Sci. 32, 313-28-73.
https://doi.org/10.1017/S0140525X09990938
Cui, H., Andersen, R.A., 2011. Different Representations of Potential and Selected Motor Plans by Distinct Parietal Areas. J. Neurosci. 31, 18130–18136.
https://doi.org/10.1523/JNEUROSCI.6247-10.2011.Different
Dale, A., 1999. Optimal experimental design for event-related fMRI. Hum. Brain Mapp. 8, 109–14.
Dean, H.L., Hagan, M.A., Pesaran, B., 2013. Looking and Reaching 73, 829–841. https://doi.org/10.1016/j.neuron.2011.12.035.Only
Dehaene, S., Changeux, J.-P., 1993. Development of elementary numerical abilities: A neuronal model. J. Cogn. Neurosci. 5, 390–407.
https://doi.org/10.1162/jocn.1993.5.4.390
Dehaene, S., Izard, V., Piazza, M., 2005. Control over non-numerical parameters in numerosity experiments.
Dehaene, S., Molko, N., Cohen, L., Wilson, A.J., 2004. Arithmetic and the brain. Curr. Opin. Neurobiol. 14, 218–24. https://doi.org/10.1016/j.conb.2004.03.008
Dormal, V., Andres, M., Dormal, G., Pesenti, M., 2010. Mode-dependent and
mode-independent representations of numerosity in the right intraparietal sulcus. Neuroimage 52, 1677–86. https://doi.org/10.1016/j.neuroimage.2010.04.254
Dormal, V., Seron, X., Pesenti, M., 2006. Numerosity-duration interference: a Stroop experiment. Acta Psychol. (Amst). 121, 109–24.
https://doi.org/10.1016/j.actpsy.2005.06.003
Eger, E., Michel, V., Thirion, B., Amadon, A., Dehaene, S., Kleinschmidt, A., 2009.
Deciphering cortical number coding from human brain activity patterns. Curr. Biol. 19, 1608–1615. https://doi.org/10.1016/j.cub.2009.08.047
Eger, E., Pinel, P., Dehaene, S., Kleinschmidt, A., 2013. Spatially invariant coding of numerical information in functionally defined subregions of human parietal cortex. Cereb Cortex 1319–1329. https://doi.org/10.1093/cercor/bht323
Eger, E., Sterzer, P., Russ, M.O., Giraud, A.-L., Kleinschmidt, A., 2003. A supramodal number representation in human intraparietal cortex. Neuron 37, 719–726.
https://doi.org/10.1016/S0896-6273(03)00036-9
Eickhoff, S.B., Heim, S., Zilles, K., Amunts, K., 2006. Testing anatomically specified
31 https://doi.org/10.1016/j.neuroimage.2006.04.204
Eickhoff, S.B., Paus, T., Caspers, S., Grosbras, M.-H., Evans, A.C., Zilles, K., Amunts, K., 2007. Assignment of functional activations to probabilistic cytoarchitectonic areas revisited. Neuroimage 36, 511–21. https://doi.org/10.1016/j.neuroimage.2007.03.060 Eickhoff, S.B., Stephan, K.E., Mohlberg, H., Grefkes, C., Fink, G.R., Amunts, K., Zilles, K.,
2005. A new SPM toolbox for combining probabilistic cytoarchitectonic maps and functional imaging data. Neuroimage 25, 1325–35.
https://doi.org/10.1016/j.neuroimage.2004.12.034
Fox, M.D., Snyder, A.Z., Vincent, J.L., Corbetta, M., Van Essen, D.C., Raichle, M.E., 2005. The human brain is intrinsically organized into dynamic, anticorrelated functional networks. Proc. Natl. Acad. Sci. U. S. A. 102, 9673–8.
https://doi.org/10.1073/pnas.0504136102
Friston, K., Zarahn, E., Josephs, O., 1999. Stochastic designs in event-related fMRI. Neuroimage 10, 607–19. https://doi.org/10.1006/nimg.1999.0498
Gebuis, T., Cohen Kadosh, R., Gevers, W., 2016. Sensory-integration system rather than approximate number system underlies numerosity processing : A critical review. Acta Psychol. (Amst). 171, 1–71. https://doi.org/10.1016/j.actpsy.2016.09.003
Gebuis, T., Reynvoet, B., 2012a. The interplay between nonsymbolic number and its continuous visual properties. J. Exp. Psychol. Gen. 141, 642–648.
https://doi.org/10.1037/a0026218
Gebuis, T., Reynvoet, B., 2012b. The role of visual information in numerosity estimation. PLoS One 7, e37426. https://doi.org/10.1371/journal.pone.0037426
Göbel, S.M., Johansen-Berg, H., Behrens, T., Rushworth, M.F.S., 2004. Response-selection-related parietal activation during number comparison. J. Cogn. Neurosci. 16, 1536–51. https://doi.org/10.1162/0898929042568442
Goense, J.B.M., Logothetis, N.K., 2008. Neurophysiology of the BOLD fMRI signal in awake monkeys. Curr. Biol. 18, 631–640. https://doi.org/10.1016/j.cub.2008.03.054 Hanks, T.D., Kopec, C.D., Brunton, B.W., Duan, C.A., Erlich, J.C., Brody, C.D., 2015.
Distinct relationships of parietal and prefrontal cortices to evidence accumulation. Nature 520, 220–3. https://doi.org/10.1038/nature14066
Harvey, B., Klein, B.P., Petridou, N., Dumoulin, S.O., 2013. Topographic Representation of Numerosity in the Human Parietal Cortex. Science (80-. ). 341, 1123–1126.
https://doi.org/10.1126/science.1239052
Hebart, M.N., Görgen, K., Haynes, J., 2015. The Decoding Toolbox ( TDT ): A versatile software package for multivariate analyses of functional imaging data. Front. Neuroinform.
Hugdahl, K., Raichle, M.E., Mitra, A., Specht, K., 2015. On the existence of a generalized non-specific task-dependent network. Front. Hum. Neurosci. 9, 430.
https://doi.org/10.3389/fnhum.2015.00430
Katz, L.N., Yates, J.L., Pillow, J.W., Huk, A.C., 2016. Dissociated functional significance of decision-related activity in the primate dorsal stream. Nature 535, 285–288.
32 https://doi.org/10.1038/nature18617
Kleiner, M., Brainard, D.H., Pelli, D.G., 2007. Thirtieth European Conference on Visual Perception, in: Perception. p. 14.
Knops, A., Piazza, M., Sengupta, R., Eger, E., Melcher, D., 2014. A shared, flexible neural map architecture reflects capacity limits in both visual short-term memory and
enumeration. J. Neurosci. 34, 9857–66. https://doi.org/10.1523/JNEUROSCI.2758-13.2014
Koenigs, M., Barbey, A.K., Postle, B.R., Grafman, J., 2009. Superior parietal cortex is critical for the manipulation of information in working memory. J. Neurosci. 29, 14980–14986. https://doi.org/10.1523/JNEUROSCI.3706-09.2009
Kravitz, D.J., Saleem, K.S., Baker, C.I., Mishkin, M., 2011. A new neural framework for visuospatial processing. Nat Rev Neurosci 12, 217–230.
Leibovich, T., Katzin, N., Harel, M., Henik, A., 2016. From “sense of number” to “sense of magnitude” – The role of continuous magnitudes in numerical cognition. Behav. Brain Sci.
Li, D., Christ, S.E., Cowan, N., 2014. Domain-general and domain-specific functional networks in working memory. Neuroimage 102, 646–656.
https://doi.org/10.1016/j.neuroimage.2014.08.028
Logothetis, N.K., 2008. What we can do and what we cannot do with fMRI. Nature 453, 869– 878. https://doi.org/nature06976 [pii]\r10.1038/nature06976
Ma, W.J., Husain, M., Bays, P.M., 2014. Changing concepts of working memory. Nat. Neurosci. 17, 347–356. https://doi.org/10.1038/nn.3655
Maldjian, J., Laurienti, P.J., Burdette, J.H., 2004. Precentral gyrus discrepancy in electronic versions of the Talairach atlas. Neuroimage 21, 450–455.
https://doi.org/10.1016/j.neuroimage.2003.09.032
Maldjian, J., Laurienti, P.J., Kraft, R. a., Burdette, J.H., 2003. An automated method for neuroanatomic and cytoarchitectonic atlas-based interrogation of fMRI data sets. Neuroimage 19, 1233–1239. https://doi.org/10.1016/S1053-8119(03)00169-1 Malhotra, P., Coulthard, E.J., Husain, M., 2009. Role of right posterior parietal cortex in
maintaining attention to spatial locations over time. Brain 132, 645–660. https://doi.org/10.1093/brain/awn350
Marcus, D.S., Harwell, J., Olsen, T., Hodge, M., Glasser, M.F., Prior, F., Jenkinson, M., Laumann, T., Curtiss, S.W., Van Essen, D.C., 2011. Informatics and Data Mining Tools and Strategies for the Human Connectome Project. Front. Neuroinform. 5, 1–12.
https://doi.org/10.3389/fninf.2011.00004
Nieder, A., 2012. Supramodal numerosity selectivity of neurons in primate prefrontal and posterior parietal cortices. Proc. Natl. Acad. Sci. U. S. A. 109, 11860–5.
https://doi.org/10.1073/pnas.1204580109
Nieder, A., Diester, I., Tudusciuc, O., 2006. Temporal and spatial enumeration processes in the primate parietal cortex. Science (80-. ). 313, 1431–5.