HAL Id: hal-02929996
https://hal.archives-ouvertes.fr/hal-02929996
Submitted on 4 Sep 2020HAL is a multi-disciplinary open access
archive for the deposit and dissemination of sci-entific research documents, whether they are pub-lished or not. The documents may come from teaching and research institutions in France or abroad, or from public or private research centers.
L’archive ouverte pluridisciplinaire HAL, est destinée au dépôt et à la diffusion de documents scientifiques de niveau recherche, publiés ou non, émanant des établissements d’enseignement et de recherche français ou étrangers, des laboratoires publics ou privés.
Experimental and CFD investigation of inert bed
materials effects in a high-temperature conical
cavity-type reactor for continuous solar-driven steam
gasification of biomass
Houssame Boujjat, Sylvain Rodat, Srirat Chuayboon, Stéphane Abanades
To cite this version:
Houssame Boujjat, Sylvain Rodat, Srirat Chuayboon, Stéphane Abanades. Experimental and CFD investigation of inert bed materials effects in a high-temperature conical cavity-type reactor for con-tinuous solar-driven steam gasification of biomass. Chemical Engineering Science, Elsevier, 2020, 228, pp.115970. �10.1016/j.ces.2020.115970�. �hal-02929996�
1
Experimental and CFD investigation of inert bed materials effects in a
high-1temperature conical cavity-type reactor for continuous solar-driven steam
2gasification of biomass
3Houssame Boujjat1,2, Sylvain Rodat3, Srirat Chuayboon3, Stéphane Abanades3* 4
1
CEA-LITEN Solar and Thermodynamic Systems Laboratory (L2ST), F-38054 Grenoble, France
5 2
Univ. Grenoble Alpes, F-38000 Grenoble, France
6 3
Processes, Materials and Solar Energy Laboratory, PROMES-CNRS, 7 Rue du Four Solaire, 66120
7
Font-Romeu, France
8
*Corresponding author: stephane.abanades@promes.cnrs.fr 9
10 11
Abstract: Solar biomass gasification was performed in a high-temperature conical bed reactor for
12
thermochemical syngas production, which represents an efficient route to promote biomass valorization 13
while storing intermittent solar energy into carbon-neutral solar fuels. The developed solar reactor is 14
based on a conical cavity-type receiver enabling continuous biomass feedstock injection under real 15
concentrated solar irradiation. In this study, the use of inert bed materials is considered to directly absorb 16
a portion of the entering solar power and to transmit thermal energy to the gas and reactive particulate 17
phase by radiation, convection and particle-to-particle interactions, with the aim of homogenizing the 18
reactor temperature. A fluid dynamics study of the gas/particle flow was first performed to provide 19
insights into the reactor hydrodynamics in the case of empty cavity and cavity containing inert particles in 20
the forms of packed-bed and spouted-bed. The beneficial effect of the inert particles bed was emphasized. 21
The spouted bed particles play a role in retaining the reacting biomass particles longer inside the reaction 22
zone and promote phase mixing, as also confirmed by cold tests on a replicated transparent mockup 23
cavity. Different inert particle bed materials were then considered and experimentally tested to unravel 24
their impact on the biomass conversion, syngas composition and yield, and gasification performance in 25
the solar-heated reactor operated at 1200°C and 1300°C. 26
Keywords: Solar energy, gasification, biomass, syngas, solar fuel, spouted-bed reactor.
27 28
2
1. Introduction
29
Over the last few decades, the interest in biomass gasification has increased due to the growing demand 30
for reducing global greenhouse gas emissions responsible for global warming (Safarian et al., 2019). 31
Major advantages of biomass gasification over combustion include its potential to produce different forms 32
of energy, fuels and chemicals. In conventional industrial autothermal gasification reactors, at least 30% 33
of the initial feedstock is burnt to supply the required heat (Higman, 2013). This reduces the complete use 34
of the biomass for fuel production and leads to the contamination of syngas by combustion by products. 35
The use of concentrated solar power (CSP) to drive the endothermal gasification reactions results in 36
saving biomass resources, thus producing more syngas with a higher quality while avoiding combustion, 37
thereby eliminating the need for downstream gas processing and pollutants abatement. Concentrated high-38
flux solar energy systems (e
.
g., solar beam-down (Noone et al., 2012) and solar towers (Li et al., 2015)) 39can be used to achieve high gasification temperatures (>1200°C), which favours the reactions kinetics and 40
tars thermal cracking, while being suitable to convert a wide variety of biomass feedstock types. 41
Solar thermochemical reactors generally depend on the method of heating the solid reactants. Directly 42
irradiated solar gasifiers generally make use of a transparent window that allows the concentrated sunlight 43
to enter directly the reaction chamber. In such configuration, efficient solar absorption is achieved and 44
heat losses are lowered, which enables to reach and maintain high temperatures (1000–1500 °C) (Puig-45
Arnavat et al., 2013). However, the transparent window mechanical resistance and cleanness are 46
restraining factors due to inherent limitations regarding pressure and particles/smoke soiling/deposition 47
(Loutzenhiser et al., 2017). Alternatively, indirectly irradiated solar reactors use an opaque heat transfer 48
wall to capture the highly concentrated solar flux and then transfer it to the reaction zone, thus avoiding 49
the need for a transparent window. The type of material selected for the emissive wall should be 50
constrained by its resistance to thermal shocks and maximum operating temperature, while it should offer 51
chemical inertness, radiative absorbance, high thermal conductivity, and suitability for transient 52
operation. The first solar gasifier (Gregg et al., 1980) was a directly irradiated fixed bed reactor and was 53
successful to convert different carbonaceous materials into syngas with more than 40% of the incoming 54
sunlight effectively stored as fuel value in the product gas. Taylor et al. (1983) studied a directly 55
irradiated fixed bed reactor for charcoal, wood and paper gasification. This reactor was irradiated from 56
the top and the charge was pushed upwards the focal point using a piston as the gasification progressed. 57
The obtained performance was compared to that of a directly irradiated fluidized bed reactor for CO2
58
charcoal gasification. Compared to its fixed bed equivalent, which has an energy efficiency of 40%, the 59
fluidized bed reactor reached only 10% efficiency at 950°C because of the more pronounced radiation 60
losses on the upper part of the reactor and additional sensible losses in the exit gas. Piatkowski et al. 61
(2009) studied another fixed bed reactor with batch mode operation. This reactor was indirectly irradiated 62
using a solar simulator and was used to convert a wide variety of carbonaceous waste feedstocks such as 63
3 scrap tire powder, industrial sludge and sewage sludge. The main drawback of this reactor was its very 64
low conductive heat transfer rate that entailed significant temperature gradients and impaired the 65
conversion throughout the bed. Kodama et al. (2002) gasified bituminous coal with CO2 in a small-scale
66
fluidized bed reactor directly irradiated by a Xe lamp from the side. The fluidized coal particles were in 67
direct contact with the quartz window, which was detrimental to its cleanliness and mechanical integrity. 68
Therefore, in another study, the concept was improved by developing a new solar fluidized bed reactor 69
irradiated from the top to insure a gap between the window area and the reacting particles (Kodama et al., 70
2010). This fluidized bed reactor was further improved (Gokon et al., 2012) by adding a draft tube in the 71
centre of the reactor, which allowed homogenizing the temperature throughout the bed. Entrained and 72
vortex flow reactors were also solarized, and tested under both direct and indirect heating modes. 73
Z’Graggen et al. (2006) studied directly irradiated petroleum coke steam-gasification. The vortex flow 74
configuration allowed achieving up to 87% of petcoke conversion in a single pass of 1s residence time. In 75
the same vein, Müller et al. (2017) gasified charcoal-water slurry in a windowless indirectly irradiated 76
SiC cavity reactor at elevated pressure ranging from 1 to 6 bar. A reaction extent of 94% was obtained in 77
less than 5s with an upgraded calorific value of the feedstock of 35%. Other reactor designs were 78
investigated such as two-zone drop tube/packed bed reactors (Bellouard et al., 2017a; Kruesi et al., 2013) 79
where a porous material was placed in the hot region of the reactor to increase the particles residence time 80
in the reaction zone, and molten salt reactors (Hathaway et al., 2014) in which molten salt was used as 81
both heat transfer medium and catalyst for the reaction. 82
The present study was undertaken following the results of a previous work (Boujjat et al., 2019a,b) in 83
which a novel 1.5 kWsolar dilute solar spouted bed reactor was simulated and experimentally studied for
84
the first time. In the preceding work, the reactor was initially empty and the continuously injected 85
biomass particles were the only spouted particles inside the cavity. Such technology was suitable to 86
continuously convert the biomass feedstock with a high carbon conversion efficiency (~80%), and the 87
efficient storage of solar energy in the form of a readily transportable fuel was confirmed. With the 88
support of 3D multiphysics modelling, improvement strategies were proposed to enhance the phase 89
mixing, to limit the finest char particles entrainment and to homogenize the reactor temperature. The use 90
of inert particles (set at the bottom of the conical cavity in the form of spouted or packed-bed) appeared to 91
be judicious to achieve higher reaction extents and heat transfer rates. Therefore, in the present work, 92
different inert bed materials were tested for the first time to study their impact on the allothermal (solar-93
only) continuous gasification of wood particles. Prior to the experimental study, the gas/particles flow 94
dynamics at real processing condition was investigated using Computational Fluid Dynamics (CFD) 95
modelling. Two thermal CFD models were developed on ANSYS-Fluent v19.1 to simulate the flow 96
through the inert packed and spouted bed particles in interaction with radiation and gas. These 97
simulations were completed by cold tests on a replicated transparent PMMA (Polymethyl methacrylate) 98
cavity mockup to validate the CFD predictions (at ambient temperature) and confirm the effective mixing 99
4 of the wood and bed particles. Thereafter, high temperature solar experiments were carried out at the 100
CNRS-PROMES solar furnace under real direct concentrated solar flux. Results in terms of syngas yield, 101
composition, biomass conversion and reactor performance metrics were discussed in light of the 102 numerical simulations. 103 104 2. Experimental set up 105 2.1 Solar reactor 106
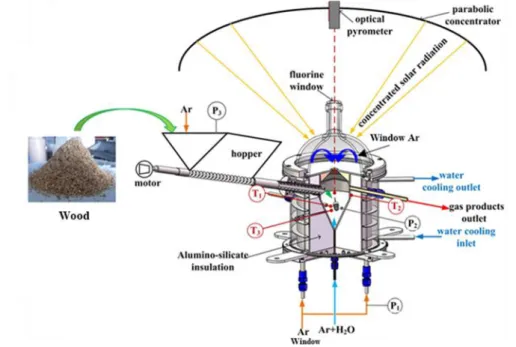
The solar reactor was settled at the focus of a vertical-axis parabolic facedown concentrator (Supporting 107
Information, Figure SI1). The reactor was based on the principle of conical spouted beds (Figure 1). 108
Being conical at the bottom and cylindrical in the upper free board region, a high velocity inlet fluid flow 109
expands the bed, and then spouts the central particles from the bottom to the upper fountain (Bellouard et 110
al., 2017b, 2018). A systematic circulation pattern is achieved in the upward direction through the spout 111
and slowly downward in the annulus region. Spouted bed reactors have been developed for various 112
applications including drying (Markowski and Kaminski, 1983), pyrolysis (Makibar et al., 2012) and non-113
solar gasification (Lopez et al., 2017). Previous works on gasification have revealed the interests of 114
spouted beds over conventional fluidization for converting cohesive and sticky particles of various sizes, 115
shapes, densities, and textures (Erkiaga et al., 2013; Mathur and Gishler, 1955; Olazar et al., 1992, 116
Chuayboon et al., 2018a,b). 117
118
Figure 1. Scheme of the solarized conical dilute spouted bed reactor
119 120
Table 1 summarizes the main reactor materials and their physical properties. The cavity receiver was 121
consisting of a vertical cylinder (78 mm inside diameter) with a 60° angle conical bottom (total cavity 122
5 height: 115 mm) and was made of a high-temperature resistant metallic alloy (FeCrAl). The bottom inlet 123
of the cavity was used for injecting the spouting gas via an alumina tube of 2 mm inside diameter from 124
which the oxidizing agent (water steam) was fed. A layer (30 mm-thick) of porous ceramic fiber 125
(aluminosilicate) was used to insulate the whole cavity. An alumina cap (20 mm-diameter aperture) was 126
placed above the metallic cavity to maximize incoming absorbed solar radiation while reducing heat 127
losses. A layer of zirconia felt (2 mm thickness) and a protective graphite plate were placed above the 128
alumina cap to protect it from the direct high-flux solar radiation and minimize radiation losses. A 129
stainless steel screw feeding system coupled with a hopper was used to transport the feedstock directly 130
into the cavity. The whole feeding system was hermetically fixed to the water-cooled reactor shell. 131
132
Table 1. Reactor materials and properties (at 1400°C otherwise specified)
133
Component
Density
ρ (kg.m
-3)
Heat capacity
c
p(J.kg
-1.°C
-1)
Thermal conductivity λ
(W.m
-1.°C
-1)
Alumina cap
4000
795
7
FerCrAl alloy
7100
800
35
Insulation
400
800
0.22
Zirconia layer
5700
500 (25°C)
2.2 (20°C)
Graphite layer
1400
710 (25°)
25 (25°C)
134 2.2 Methods 135The gasified beech wood particles had an average diameter of 1 mm (Figure 2). Their characteristics are 136
summarized in Table 2. They were obtained from XP CEN/TS 15104, XP CEN/TS 15105, XP CEN/TS 137
15107, XP CEN/TS 14775 standards. Oxygen content was deduced by difference. The LHV (dry basis) 138
was measured with a PARR 6200 bomb calorimeter knowing humidity from NF EN 14774 standard. 139
Granulometry was obtained using a FT4 granulometer. 140
141
Table 2. Biomass composition and properties
142 C (wt.%) H (wt.%) O (wt.%) N (wt.%) S (wt.%) Ash (wt.%) Moisture (wt.%) Density (kg.m-3) Specific heat (J.kg-1.°C-1) LHV (MJ.kg-1) 48.3 6.7 44.4 0.1 <0.1% 0.46 8.9 650 1500 16.93
6 The feedstock was stored in a 1.15L hopper and was continuously injected by the screw feeder. The wood 143
particles were transported into the hot cavity receiver and fell by gravity until complete injection of the 144
loaded biomass particles. 145
A flow of Ar (0.5 NL/min) was continuously injected via the hopper through the feeder, so that the hot 146
gases from the cavity could not interact with the reactive biomass feedstock. Moreover, to avoid window 147
fouling and overheating, a protective Ar flow (2 NL/min) was constantly flowed below the window for 148
sweeping and ensuring that all the product gases are directed to the reactor outlet. The jet gases (a mixture 149
of Ar carrier gas and steam) were injected from the alumina tube at the cavity bottom. The composition 150
(0.2 NL/min of Ar and 200 mg/min of steam) was adjusted to provide a slightly over-stoichiometric 151
Steam-to-Biomass (S/B) ratio. 152
153
The produced gases flowed through a bubbler and two cartridge filters to eliminate excess steam and 154
entrained char particles. An on-line gas analyzer (GEIT 3100) was used to continuously monitor the 155
syngas molar composition. The H2 mole fraction was measured by a thermal conductivity detector (TCD)
156
while the mole fractions of CO, CO2, and CH4 were quantified by non-dispersive infrared detectors
157
(NDIR) (accuracy of measuring cells: ±2% of full scale, scales: 0-20% for H2 and CO, 0-10% for CO2
158
and CH4). In addition, a gas chromatograph (GC) equipped with two columns (using Ar as carrier gas)
159
was used to measure the gas species concentrations and to specifically analyze the light hydrocarbons 160
(C2Hm). Three temperature sensors (Pt-Rh thermocouples) were settled to monitor the reactor
161
temperatures (Figure 1). They were related to the inner temperature within the cavity volume (T3 in the
162
conical region near the cavity bottom and T1 at the cavity center) and to the external wall of the cavity
163
(T2). The sensors tips were shielded by an alumina tube to protect them from the reacting gases. In
164
addition, a solar-blind pyrometer (Impac, operating at 4.8–5.2 μm in a H2O absorption band) placed
165
above the reactor was used to measure the temperature at the cavity central core. Moreover, to ensure that 166
the reactor was maintained at an operating pressure below 1 bar (atmospheric pressure of 860 hPa due to 167
site elevation), a Venturi pump was placed at the outlet tube. A pressure measurement (P) was settled in 168
the cavity to monitor pressure variations throughout the experiments. All the obtained data were 169
controlled and collected by an automated data acquisition system (BECKHOFF). 170
171
2.3 Bed materials
172
Previous simulations using 3D CFD multiphysics modelling of the reactor (without bed materials) 173
(Boujjat et al., 2019a,b) revealed that the cavity wall temperature was 100°C higher than the inner 174
reaction zone temperature because of the direct absorption of most of the incoming radiations by the 175
cavity wall. Moreover, the lightest particles were entrained early towards the outlet by the high velocity 176
jet, which penalized the biomass conversion and syngas yields. Notable gradients in both steam 177
concentration and gas temperature between the central spout region and the annular zone were also 178
7 pointed out by the model, leading to strong variations in the particles conversion rate. With the aim of 179
achieving higher reactor performance and better use of solar energy, inert bed materials set in the form of 180
spouted or packed bed were considered. The spouted flow regime is expected to increase the reaction 181
zone temperature and enhance the gas/wood particles phase mixing. The packed-bed configuration is used 182
to broaden the gas stream at the cavity bottom, which should reduce the central gas jet velocity (thus 183
increasing the gas residence time) and limit the entrainment of the reacting particles, when compared with 184
an empty cavity configuration. Figure SI2 provides an illustration of the three studied hydrodynamic 185
configurations. 186
187
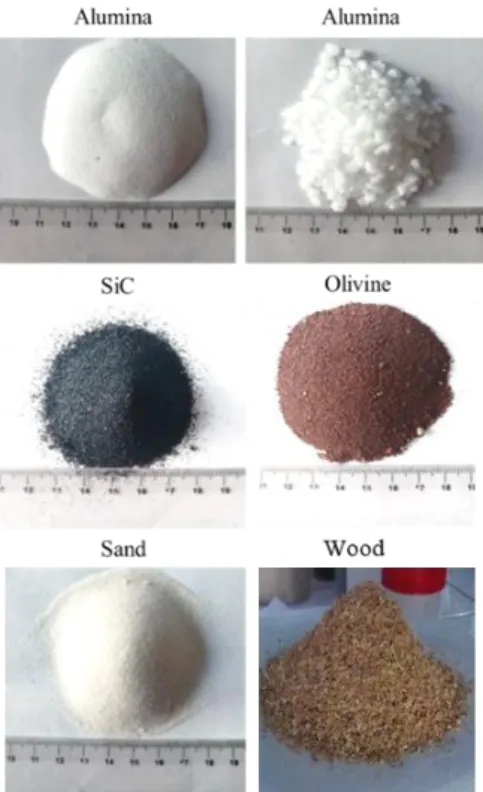
Table 3 presents the tested packed and spouted particles characteristics. 188
Table 3. Inert particles characteristics at 1400°C
189
Alumina
(Al
2O
3)
Silicon carbide
(SiC)
Olivine
Silica sand
(SiO
2)
Density, ρs (kg.m-3)3950
3210
3270
1442
Thermal conductivity, λs (W.m-1.°C-1)7
15
0.6
2.2
Heat capacity, cp,s (J.kg-1.°C-1)795
1320
1220
1225
Mean diameter, ds (mm)3.00 or 0.12
0.30
0.30
0.20
190The olivine main compounds included MgO, SiO2, CaO (0.4% max) and Fe2O3. The mass fractions in
191
Mg, Si and Fe were respectively 28.5%, 17.5% and 7%. Both SiC and olivine particles were thermally 192
treated at 1000°C in presence of air to ensure inertness regarding the biomass thermochemical reactions 193
of pyrolysis and gasification. Figure 2 shows a photography of the different particles. 194
8 195
Figure 2. Studied inert bed and wood biomass particles
196
3. Modelling
197
Prior to the high temperature experiments, multiphysics simulations of three configurations (empty 198
cavity, inert packed-bed and spouted-bed particles) were performed to analyze the gas/solid flow behavior 199
under real processing conditions using the same bottom and upper (window) gas flow rates as 200
experiments with a solar power input of 900W. The reactor geometry was elaborated to closely represent 201
the real reactor design (composed of different zones: alumina cap, insulation, cavity walls, and fluid / gas 202
injection, reaction and exit zones). The geometry was meshed using an optimal cell size to accurately 203
solve the gradients in the central spout region of the reactor where sharp variations in terms of 204
temperature, gas velocity, and species mole fraction occur (Boujjat et al., 2019a). Two thermal CFD 205
models were developed. The first one simulated the fluid flow through the porous packed bed. In this 206
model, the packed bed particles were modelled through a momentum sink, which was function of the 207
permeability and the porosity of the medium. A blending between the energy of fluid and solid particles 208
was considered for the governing transport equation determining the temperature in the packed bed 209
region. The model also allowed tracking discrete char particles in space by solving in a Lagrangian 210
reference frame the discrete particles momentum and energy equations. The second model used the 211
Eulerian-Eulerian (granular) approach to simulate the directly irradiated spouted bed particles. The flow 212
was therefore described by conservation equations written for each phase separately (gas and granular). 213
The endothermal pyro-gasification reaction was modelled by a volumetric heat sink applied to the fluid 214
region of the cavity. Momentum, energy and radiative intensity transport equations used in the modelling 215
9 of the packed and the spouted powders are provided in detail in Tables SI1-2. The reactor geometry, mesh 216
and boundary conditions are also presented in the Supporting Information (Section 2.1). 217
218
4. Results and discussion
219
4.1 Hydrodynamic & thermal study
220
The empty and the packed-bed configurations were simulated without discrete particles injection. Figure 221
3 shows the temperature field inside the solar reactor for a solar power input of 900W. It was observed 222
that for the two configurations, the cavity walls reached an average temperature of around 1230°C while 223
the gas phase average temperature was around 930°C. The empty cavity was characterized by a central 224
gas jet reaching a temperature of around 700°C at the center of the conical part of the cavity, which was 225
relatively colder than the annular region. In the packed bed configuration, the gas phase temperature 226
reached the same temperature (around 700°C) above the porous medium due to the cold window inlet Ar 227
flow rate. The porous zone model allowed to simulate heat transfer through the porous packed bed 228
(composed of 3mm particles). Accordingly, the bed top surface temperature was estimated at 1000°C at 229
its center and approached 1100°C nearby the cavity walls. Due to the thermal resistance of the packed 230
particles, and to the cooling of the bottom of the bed by the entering cold gases, the bed bottom 231
temperature was lower (around 950°C). 232
233
Figure 3. Temperature distribution: empty vs. packed bed
234 235
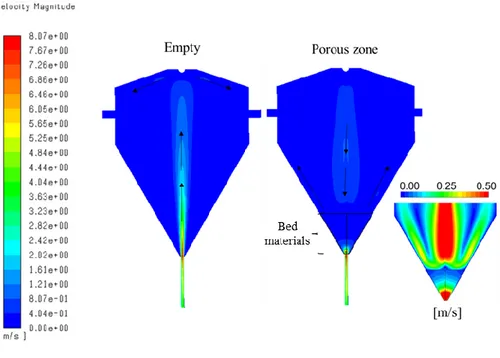
The gas velocity magnitude field inside the reactor is presented in Figure 4. 236
10 237
Figure 4. Velocity magnitude field: empty vs. packed bed
238 239
The simulations revealed a significant attenuation of the inlet gas flow velocity when using the packed 240
particles. The gas jet velocity at the cone entrance was about 8 m/s. It then decreased to less than 0.5 m/s 241
just above the bed. The Ar flow from the top of the reactor flowed downward to hit the bed top surface 242
with a velocity of around 0.3m/s. It then flowed with the inlet gases towards the outlet along the cavity 243
walls. The steam distribution inside the reactor and the inlet gas (water steam+argon) pathlines for the 244
two configurations are presented in Figure 5. In the empty configuration, the central cavity region 245
exhibited the highest water steam concentration, whereas the packed bed broadened the inlet gas 246
streamlines over the entire cavity section, suggesting improved homogenization of chemical kinetics in 247
the whole cavity region. 248
11 249
Figure 5. Steam distribution and inlet gas streamlines
250 251
The spouted bed configuration was studied at cold and at real processing conditions. Prior to the CFD 252
simulations, cold tests were carried out at ambient conditions with air on a transparent PMMA cavity 253
mockup to visualize the mixing of the particles and determine the minimum spouting conditions. The 254
obtained results for a 10g bed of SiC and Al2O3 particles are summarized in Figure 6.
255
256
Figure 6. Experimental cold tests on a replicated PMMA cavity mockup (10g of inert particles)
12 The bed minimum spouting velocity was determined by plotting the bed pressure drop as function of the 258
inlet gas flow rate. Figures 6-a,b show the measured pressure drop vs. the air flow rate for a 10g bed of 259
300 µm SiC and 125 µm Al2O3 particles. It can be observed that by increasing the gas flow rate, the total
260
pressure drop increased until reaching a maximum value that initiated the spouting of the particles 261
(around 11 mbar for SiC and around 8 mbar for Al2O3 bed). Accordingly, minimum spouting flow rates
262
of 1.5 Nl/min (vexp,SiC=7.42 m/s) and 0.16 Nl/min (vexp,Al2O3=0.85 m/s) were measured for the SiC and
263
Al2O3 particles. In Figures 6-c to 6-f, a thin layer of wood particles was set at the top of the inert bed to
264
visualize the stirring of the wood particles for U/Ums ~2. A very stable spouting regime and well-ordered
265
mixing of the particles was observed with the SiC particles, whereas the Al2O3 particles showed 3D
266
instabilities that distorted the central gas jet path. As a result, the fountain height was constantly varying 267
and changing its position, as illustrated in Figure 6-g. This undermined the particles recirculation from the 268
top of the bed to the bottom. Such spouting instabilities were observed in previous studies (Olazar et al., 269
1992) and were due to different interdependent factors such as too large or too small cone angles. They 270
could also occur when the height of the bed exceeded the maximum spoutable height, or when the 271
spouted powders diameter was too small to be fluidized in a coherent and stable fashion. 272
These results were compared to 2D axisymmetric CFD simulations using the Eulerian approach. Figure 7 273
shows the spouted bed particles space distribution for different inlet gas flow rates. 274
275
276
Figure 7. Spouted bed particles space distribution for different inlet air flow rates (10g of inert particles,
277
t=2s) 278
The cyclic particle-flow recirculation pattern through the three distinct regions (central spout, annular 279
zone and fountain above the bed surface) was well reproduced by the Eulerian model. The predicted 280
minimum spouting flow rate was 1.5 Nl/min for the SiC bed (vsim.,SiC=7.95 m/s) and 0.23 Nl/min for the
13 Al2O3 bed (vsim,Al2O3=1.22 m/s). These predictions were in agreement with the experimentally measured
282
values for SiC within an error range of 4% and slightly overestimated the minimum spouting flow rate by 283
about 0.07 Nl/min for the Al2O3 particles. The observed discrepancies for the Al2O3 particles can be due
284
to the aforementioned flow perturbations (Figure 6-g) that potentially facilitated the gas passage through 285
the annular region. Such 3D instabilities could not be reproduced by the 2D axisymmetric model. 286
Subsequently, the reactor was simulated under real processing conditions (same bottom and upper gas 287
flow rates as experiments) with a solar power input of 900W (and with 10g of spouted bed mass). The 288
obtained temperature distribution is presented in Figure 8-a,b for Al2O3 and SiC spouted particles. Just as
289
the two previous hydrodynamic configurations (empty and packed bed), the reactor cavity walls reached 290
an average temperature of 1230°C. Unlike the empty configuration where the central gas jet reached only 291
700°C at the conical part of the reactor, the central gas jet when using the spouted particles reached high 292
temperatures up to 1180°C right away. 293
294
Figure 8. Temperature distribution (gas and solid phases): (a) 125µm-Al2O3 particles; (b) 300µm-SiC
295
particles 296
297
By comparing the simulations between Al2O3 and SiC, the alumina particles allowed increasing the gas
298
phase temperature over a larger area. This is because the alumina particles were better spouted thanks to 299
their lower diameter. Moreover, their temperature was more homogeneously distributed, whereas small 300
gradients were noticed for SiC particles (Figure 8-b), arising from the less pronounced stirring of the SiC 301
particles inside the cavity. This is confirmed by the different fountain heights depending on the particles 302
diameter (Figure 9-b,d). Indeed, the fountain height of the Al2O3 bed was two to three times higher than
303
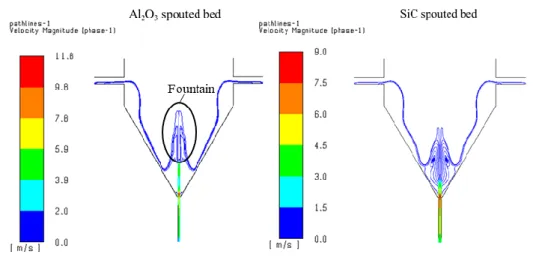
the fountain height of the SiC particles. Moreover, the central gas flow (bottom jet zone) was more 304
14 attenuated by the SiC particles that somehow deflected part of the flow towards the annular zone (Figure 305
9-a,c). For readability reasons, the velocity magnitude field was plotted in a range of 0 m/s to 3 m/s. 306
However, due to the heating of the gases inside the injection tube, the gas velocity increased from 3 m/s 307
(at the inlet of the injection tube) to values above 9 m/s at the cone entrance for both 10g beds (Figure 308
10). This value is hence higher than the minimum spouting velocities (Figures 6 and 7-b); therefore, the 309
spouting regime was largely achieved with the current experimental flow rates. 310
311
Figure 9. Gas velocity field and solid volume fraction: (a,b) 125 µm-Al2O3 particles, (c,d) 300 µm-SiC
312
particles 313
314
The spouting gases (Ar+H2O) pathlines colored by velocity magnitude are presented in Figure 10
315
316
Figure 10. Spouting gases pathlines colored by velocity magnitude
317 318
It clearly showed that for the Al2O3 particles, the flow crosses the bed mainly from its center to reach the
319
fountain zone while the SiC spouted particles distribute part of the flow towards the annular region. 320
Thereafter, the spouting gases interact with the upper window inlet flow to get routed all along the cavity 321
walls towards the gas exit. 322
15 Overall, the simulations evidenced the benefits of using inert materials in the form of spouted particles to 323
increase the reaction zone temperature while ensuring an efficient stirring of the particles. The 324
experimental gas flow rates were high enough to spout the 10g bed. A slight increase of the inlet argon 325
flow rate is recommended for the largest particles to better disperse them in the upper part of the cavity. 326
Further increase of the spouting flow rate for the smallest bed particles can possibly impair the process by 327
entraining them out of the conical cavity. The observed flow instabilities during cold tests for the Al2O3
328
spouted particles were not predicted by the 2D model. They are expected to negatively affect the heat 329
transfer through the bed at high temperature. 330
A complementary comparative study of the three configurations based on hydrodynamic criteria only is 331
provided in the Supporting Information, section 3.2. 332
333
4.2 Experimental study of solar reactor operation
334
Different experimental runs were performed to study the effect of the inert bed particles on biomass 335
conversion and syngas composition. The Carbon Conversion Efficiency (CCE), the Cold Gas Efficiency 336
(CGE) and the Solar-to-Fuel Efficiency (SFE) metrics were used to evaluate the performance of the 337
reactor for each of the hydrodynamic configurations. The CCE quantifies the extent of biomass 338
conversion inside the reactor. The CGE is expressed as the ratio between the calorific value of the syngas 339
over that of the initial biomass. The SFE represents the ratio between the calorific value of syngas over 340
the total thermal energy that enters the reactor including solar and biomass. For each gas species, the 341
time-dependent production rate (Qi) was assessed based on the measured species outlet mole fractions (xi)
342
and the inlet inert gas flow rate (QAr): (Qi= QAr.xi/xAr). The averaged syngas mole composition (calculated
343
over the experiment duration) was determined by integrating the gas production rates over time. 344 (1) 345 (2) 346 (3) 347
The tests were carried out under stable solar irradiation (DNI variation less than 10%). To stabilize the 348
reactor temperature, the incident solar power was controlled by adjusting the opening of a trapdoor 349
located between the heliostat and the reactor frame. The average solar power directly absorbed by the 350
cavity through the aperture was 900 ± 100W to maintain the reactor at 1200°C and 1200 ± 100W to 351
maintain the reactor at 1300°C. 352
The experimental conditions at 1200°C (Runs#1-7) and 1300°C (Runs#8-11) are recapped in Table 4. 353
The calculated (S/B)/(S/B)st mole ratio was equal to 1.24 based on Eq.4 for calculating the (S/B)st
354
stoichiometric ratio (where S denotes steam flow rate including both inlet steam and moisture contained 355
16 in biomass, and B denotes dry biomass flow rate). Accordingly, the biomass particles were gasified with a 356
slightly overstoichiometric steam flow rate. 357
C6.0H10.0O4.1+1.9H2O(v)→6.0CO+6.9H2 ∆H°g = 0.84 MJ/mol (4)
358 359
Table 4. Operating conditions of the directly irradiated reactor (1200 and 1300 °C, 10g of inert materials)
360
Run# Toperating
(°C)
Bed material Bed configuration Wood
feeding rate (g/min) Ar flow rate (NL/min) H2O flow rate (g/min) material size
1 1200 Empty - Dilute spouted bed 1.2 0.2 0.2
2 1200 Al2O3 3mm Packed bed 1.2 0.2 0.2
3 1200 Al2O3 125µm Spouted bed 1.2 0.2 0.2
4 1200 SiC 300µm Spouted bed 1.2 0.2 0.2
5 1200 SiC 300µm Spouted bed 1.2 0.3 0.2
6 1200 Olivine 300µm Spouted bed 1.2 0.2 0.2
7 1200 Sand 300µm Spouted bed 1.2 0.2 0.2
8 1300 Al2O3 3mm Packed bed 1.2 0.2 0.2
9 1200-1300 Al2O3 125µm Spouted bed 1.2 0.2 0.2
10 1300 Al2O3 125µm Spouted bed 1.2 0.2 0.2
11 1300 SiC 300µm Spouted bed 1.2 0.2 0.2
361
After solar tests, the material mass balance was assessed via systematic comparison between the initial 362
mass of injected reactants (both biomass and water) and the output mass of products (syngas compounds, 363
excess water and entrained char/soot/tar remaining in bubbler and filters). Overall, the mass balance 364
closure was above 84% regardless of the experimental runs (as shown in Table SI3). Moreover, no 365
remaining char was found inside the cavity after tests. 366
The reactor temperature as measured by T3 (inside the cavity) for Runs#1-11 is plotted in Figure 11-a,b. 367
The temperature was effectively maintained around the set point values (maximum mean deviation of 368
14°C in Run#6). Due to the insufficient solar heating in Run#9, the reactor temperature could not be 369
maintained at 1300°C (it declined to values approaching 1200°C) and the mean deviation was therefore 370
higher (about 29°C). 371
17 372
Figure 11. T3 measurements for Runs#1-11 at 1200°C and 1300°C (left); Average and mean deviation of
373
temperature (right) 374
375
Pyrometer measurements (Tpyro) in Figure 12 indicated strong fluctuations in temperature for the
spouted-376
bed configuration because the pyrometer pointed directly at the bed top surface. Given the spouting of 377
particles (including wood and inert particles) and the continuous feeding of fresh biomass, such 378
fluctuations given by the optical pyrometer are expected (for simplification, the same emissivity of 1 was 379
assumed for all the measurements, although in practice the emissivity is dependent on the materials 380
properties and temperature, which also explains the observed differences in measured temperatures). The 381
fluctuations, which reflect the intense/effective stirring of the particles, were lowered when the packed 382
Al2O3 particles were used (Run#2).
18 384
Figure 12. Pyrometer measurements for Runs#1-7 (1200°C)
385 386
Figure 13 shows the calculated performance metrics and the gas composition for the different 387
hydrodynamic configurations at 1200°C (Runs#1-7). 388
389
Figure 13. (a) CCE and top view of the cavity at the end of the experiments (for Al2O3, SiC and olivine);
390
(b) Gas composition; (c) CGE; (d) SFE (Runs#1-7 at 1200°C) 391
392
The carbon conversion in the empty case (Run#1) reached 79.3% and the syngas produced was 393
essentially composed of H2 and CO. The H2 and CO volume fractions were respectively 51.6% and
19 38.3%. The use of the packed and spouted bed of Al2O3 particles (Runs#2-3) increased the CCE up to
395
84.7%. In contrast, the CCE declined to 75.5% with the spouted 300-µm SiC (Run#4). 396
The increase of the spouting carrier gas flow rate (from 0.2 Nl/min in Run#4 to 0.3 Nl/min in Run#5) 397
decreased even more the CCE to 73.9%. While the alumina particles remained intact at the end of the 398
experiments and showed chemical inertness, the SiC bed suffered from sintering and adhered to the cavity 399
walls (Figure 13-a). This can also be due to possible side reactions that may occur between SiC and water 400
(forming either SiO2 + CH4 or SiO(g) + 2H2 + CO, the former being the most thermodynamically
401
favorable). The expected effect of improving the stirring of SiC particles by increasing the carrier gas 402
flow rate was therefore hardly achieved and only impaired the gas and solid residence times. 403
The olivine sample in Run#6 also stuck but to a lesser extent on the cavity walls and its color turned from 404
brown/red (due to the presence of iron oxides) to grey (Figure 13-a), suggesting poor chemical inertness 405
at high temperatures. The CCE in Run#6 was still higher than the CCE of the empty cavity and reached 406
82.2%. The silica sand bed in Run#7 was the least resistant material, as the cavity was found almost 407
empty at the end of the experiment, presumably because of the formation of fused silica during spouting 408
caused by particles exposure to high-flux radiation in the upper cavity region. The results in terms of CCE 409
and syngas composition were therefore very similar to Run#1. 410
In general, the bed materials only slightly influenced the gas composition and in all cases, the main 411
syngas components remained H2 and CO, whereas CO2, CH4 and CnHm (mainly C2H2)were produced in
412
smaller amounts. The Al2O3 particles in Run#2 led to the lowest H2 concentration (~48.1%) while the
413
light hydrocarbons (CH4 + CnHm) volume fraction was the largest (6.4%). The H2 concentration in Run#4
414
(SiC particles, 0.2 Nl/min of spouting carrier gas flow rate) was the highest and reached around 52.9%. 415
This however can be due to the oxidation of SiC by steam, forming additional H2 in the mixture. The
416
CGE (Figure 13-c) followed a similar pattern as the CCE since the gas composition was only slightly 417
modified by the addition of the inert powders. The peak CGE values were obtained in Runs#2-3 (packed 418
and spouted Al2O3 particles) and reached 1.13 against 1.11 in Run#1 (empty cavity). The minimum CGE
419
was 1.01 in Run#5 (SiC bed) when the Ar flow rate was set to 0.3 NL/min. 420
The SFE (Figure 13-d) reached up to 21.8% in Run#1 (empty cavity) and decreased moderatly to a 421
minimum value of 19.4% in Run#2 (packed Al2O3 particles) even if the CGE was slightly upgraded. The
422
total solar energy consumed (Qsolar) for gasifying the 30.0g biomass feedstock was 1.76±0.21 MJ in
423
Run#1. It was higher with inert bed materials: 2.23±0.19 MJ in Run#2 (packed Al2O3 particles),
424
2.15±0.24 MJ in Run#3 (spouted Al2O3 particles), 1.89±0.21 MJ in Run#4 (spouted SiC particles),
425
1.83±0.19 MJ in Run#5 (spouted SiC particles) and 2.04±0.25 MJ in Run#6 (spouted olivine particles). 426
Qsolar in Run#7 was 0.99±0.11 MJ (because only 15.6g of biomass was gasified). While a small increase
427
of Qsolar was observed when using the inert particles probably for heating the bed materials, the
20 uncertainty on Qsolar makes it difficult to precisely conclude about the influence of the bed materials on
429
the solar energy consumption and therefore on the SFE. 430
The effect of temperature on the gasification process was studied in Runs#8-11 with the Al2O3 packed
431
particles (Run#8), Al2O3 spouted bed particles (Runs#9-10) and with SiC bed (Run#11). Olivine and sand
432
were not tested at this temperature, due to their low stability and resistance to the solar heating. Figure 14 433
shows the calculated reactor efficiencies and gas composition at 1300°C. 434
435
Figure 14. (a) CCE; (b) Gas composition; (c) CGE; (d) SFE (Runs#8-11 at 1300°C)
436 437
The temperature increase showed only a little impact on the CCE and CGE for the packed bed 438
configuration (Run#8) but the influence on the gas composition was more pronounced. The CCE and the 439
CGE both slightly declined by less than 1.5% whereas the syngas (H2 + CO) concentration was improved
440
by 4.3% (from Run#2 to Run#8) due to the enhancement of the kinetic rates of the steam methane and 441
light hydrocarbons reforming (CnHm+nH2O→ (m/2+n) H2+nCO).
442
The CCE in the Al2O3 spouted bed configuration declined with temperature increase, from 83.5% in
443
Run#3 to 81.1% in Run#9 and 80.4% in Run#10. This decrease in CCE was ascribed to the more favored 444
entrainment of the reacting char particles, caused by the lower gas residence time that decreased from 445
0.54s at 1200°C to 0.51s at 1300°C. Accordingly, the CGE declined in a stepwise fashion in Runs#9-10 446
to reach 109% in Run#10. Moreover, just as in Run#8, the H2 + CO volume fraction was improved by
447
3.2% at the expense of a noticeable decrease of the CH4+CnHm by 28.0% (from Run#3 to Run#10). The
448
largest H2 + CO volume fraction was achieved with the SiC particles (Run#11) reaching 94.2% against
449
92.1% in Run#4 (SiC bed-1200°C) with a beneficial effect on the CCE and the GGE that approached 450
21 values of the Al2O3 spouted bed possibly due to their better stirring and absorption of the solar flux at
451
1300°C. 452
For all runs (#8-11), the SFE decreased by more than 10% mainly due to the increase of the solar energy 453
consumption. In fact, the calculated Qsolar for Runs#8-11 (1300°C) were higher than in Runs#1-7
454
(1200°C) and were respectively 2.49±0.20 MJ, 2.68±0.22 MJ, 2.25±0.18 MJ, 2.16±0.18 MJ. 455
456
5. Conclusions
457
This study focused on solar biomass gasification in a directly-irradiated conical lab-scale reactor and 458
addressed the effect of inert particles on the gasification process. Prior to the experimental study, 459
multiphysics CFD gas-particle flow modelling was developed to explore the impact of inert packed or 460
spouted particles on the reactor thermal and hydrodynamic behavior. 461
(i) The empty conical cavity (no bed materials) is characterized by a high velocity central gas jet that 462
entrains cyclically the char particles inside the cavity. It offers an excellent exposure to solar radiation 463
evidenced by peak char temperature values but low gas residence time in the central cavity region due to 464
high gas velocities. 465
(ii) The packed-bed configuration using inert particles at the bottom of the conical cavity significantly 466
attenuates the gas jet speed at the central zone, broadens the gas streamlines and limits the entrainment of 467
the reacting particles. 468
(iii) The spouted-bed configuration increases the reaction zone temperature and warrants a continuous 469
gas/particles stirring. The finest inert spouted bed particles are more effective in increasing the reaction 470
zone temperature as they are better spatially dispersed. 471
The experimental part of this study examined five different inert bed materials at 1200°C and 1300°C. 472
The empty configuration (no bed materials used), in which only the reacting wood particles are spouted, 473
showed a CCE of 79% and a CGE of 111% at 1200°C. The Al2O3 packed and spouted particles both
474
increased the reactor performance, especially the CCE that reached 85% in the packed bed configuration. 475
The SiC bed suffered strongly from sintering and led to the lowest performance with a CCE of 76% and a 476
CGE of 105%. Olivine and silica sand were not thermochemically stable at 1200°C, with global 477
performance equivalent to the empty configuration. The Al2O3 beds were the most suitable for the
high-478
temperature process showing good resistance to thermal shocks and chemical inertness. The effect of bed 479
materials on the outlet syngas composition at these temperatures remained very low (less than 7% for H2).
480
Increasing temperature to 1300°C improved the syngas quality but globally impaired the CCE, CGE and 481
SFE. 482
22 Future work should focus on the optimization of the bed particles properties. Low density and high 483
absorption are preferable. New reactor configurations using a confiner could also limit particle 484
entrainment that is a major concern for scale up. 485
486
Acknowledgements
487
This study was financially supported by ADEME (French Environment and Energy Management 488 Agency). 489 490 491 References 492
Bellouard Q., Abanades S., Rodat S., Dupassieux N., 2017a. Solar thermochemical gasification of wood 493
biomass for syngas production in a high-temperature continuously-fed tubular reactor. Int. J. Hydrog. 494
Energy 42, 13486-13497. 495
Bellouard Q., Abanades S., Rodat S., Dupassieux N., 2017b. Biomass Gasification in an Innovative 496
Spouted-Bed Solar Reactor: Experimental Proof of Concept and Parametric Study. Energy & Fuels 31, 497
10933-10945. 498
Bellouard Q., Abanades S., Rodat S., 2018. Design, simulation and experimental study of a directly-499
irradiated solar chemical reactor for hydrogen and syngas production from continuous solar-driven wood 500
biomass gasification. Int. J. Hydrog. Energy 44, 19193-19205. 501
Boujjat, H., Rodat, S., Chuayboon, S., Abanades, S., 2019a. Numerical simulation of reactive gas-particle 502
flow in a solar jet spouted bed reactor for continuous biomass gasification. Int. J. Heat Mass Transf. 144, 503
118572. 504
Boujjat, H., Rodat, S., Chuayboon, S., Abanades, S., 2019b. Experimental and numerical study of a 505
directly irradiated hybrid solar/combustion spouted bed reactor for continuous steam gasification of 506
biomass. Energy 189, 116118. 507
Chuayboon, S., Abanades, S., Rodat, S., 2018a. Comprehensive performance assessment of a continuous 508
solar-driven biomass gasifier. Fuel Process. Tech. 182, 1-14. 509
Chuayboon, S., Abanades, S., Rodat, S., 2018b. Experimental analysis of continuous steam gasification of 510
wood biomass for syngas production in a high-temperature particle-fed solar reactor. Chem. Eng. & 511
Proc.: Proc. Intens. 125, 253-265. 512
23 Erkiaga, A., Lopez, G., Amutio, M., Bilbao, J., Olazar, M., 2013. Steam gasification of biomass in a 513
conical spouted bed reactor with olivine and γ-alumina as primary catalysts. Fuel Process. Technol. 116, 514
292–299. 515
Gokon, N., Ono, R., Hatamachi, T., Liuyun, L., Kim, H.J, Kodama, H.J., 2012. CO2 gasification of coal 516
cokes using internally circulating fluidized bed reactor by concentrated Xe-light irradiation for solar 517
gasification. Int. J. Hydrog. Energy 37, 12128-12137 518
Gregg, G.W., Taylor, R.W., Campbell, J.H., Taylor, J.R., Cotton, A., 1980. Solar gasification of coal, 519
activated carbon, coke and coal and biomass mixtures. Sol. Energy 25, 353-364. 520
Hathaway, B.J., Kittelson, D.B., Davidson, J.H., 2014. Development of a Molten Salt Reactor for Solar 521
Gasification of Biomass. Energy Procedia 49, 1950–1959. 522
Higman, C., 2013. State of the Gasification Industry – the Updated Worldwide Gasification Database, 523
Germany. 524
Kodama T., Gokon, N., Enomoto, S., Itoh, S., Hatamachi, T., 2010. Coal Coke Gasification in a 525
Windowed Solar Chemical Reactor for Beam-Down Optics. J. Sol. En. Eng. 132(4):041004. 526
Kodama, T., Kondoh, Y., Tamagawa, T., Funatoh, A., Shimizu, K.I., Kitayama, Y., 2002. Experimental 527
investigation of a packed-bed solar reactor for the steam-gasification of carbonaceous feedstocks. Energy 528
& Fuels 16, 1264-1270. 529
Kruesi, M., Jovanovic, Z.R., Dos Santos, E.C., Yoon, H.C., Steinfeld, A., 2013. Solar-driven steam-based 530
gasification of sugarcane bagasse in a combined drop-tube and fixed-bed reactor – Thermodynamic, 531
kinetic, and experimental analyses. Biomass & Bioenergy 52, 173–183. 532
Li, X., Dai, Y.J., Wang, R.Z., 2015. Performance investigation on solar thermal conversion of a conical 533
cavity receiver employing a beam-down solar tower concentrator. Sol. Energy 114, 134–151. 534
Lopez, G., Cortazar, M., Alvarez, J., Amutio, M., Bilbao, J., Olazar, M., 2017. Assessment of aconical 535
spouted with an enhanced fountain bed for biomass gasification. Fuel 203, 825–831. 536
Loutzenhiser, P.G., Muroyama, A.P., 2017. A review of the state-of-the-art in solar-driven gasification 537
processes with carbonaceous materials, Sol. Energy 156, 93-100. 538
Makibar, J., Aranzazu, R.F-A., Diaz, L., Gartzen, L., Olazar, M., 2012. Pilot scale conical spouted bed 539
pyrolysis reactor: Draft tube selection and hydrodynamic performance. Powder Technol., 219, 49-58. 540
Markowski, A., Kaminski, W., 1983. Hydrodynamic characteristics of jet-spouted beds. The Canadian J. 541
of Chem. Eng. 62, 377-381. 542
24 Mathur, K.B., Gishler, P.E., 1955. A technique for contacting gases with coarse solid particles. AIChE J. 543
1,157–164. 544
Müller, F., Poživil, P., Van Eyk, P.J., Villarrazo, A., Haueter, P., 2017. A pressurized high-flux solar 545
reactor for the efficient thermochemical gasification of carbonaceous feedstock. Fuel 193, 432–443. 546
Noone, C.J., Torrilhon, M., Mitsos, A., 2012. Heliostat field optimization: A new computationally 547
efficient model and biomimetic layout. Sol. Energy 86, 792–803. 548
Olazar, M., San Jose, M.J., Aguayo, A.T., Arandes, J.M., Bilbao, J.; 1992. Stable operation conditions for 549
gas-solid contact regimes in conical spouted beds. Ind. Eng. Chem. Res. 31, 1784–1792. 550
Piatkowski, N., Wieckert, C., Steinfeld, A., 2009. Experimental investigation of a packed-bed solar 551
reactor for the steam-gasification of carbonaceous feedstocks. Fuel Process. Technol. 90, 360-366. 552
Puig-Arnavat, M., Tora, E.A., Bruno, J.C., Coronas, A., 2013.State of the art on reactor designs for solar 553
gasification of carbonaceous feedstock, Sol. Energy 97, 67–84. 554
Safarian, S., Unnþórsson, R., Richter, C., 2019. A review of biomass gasification modelling, Renew. 555
Sustain. Energy Rev. 110, 378-391. 556
Taylor, R.W., Berjoan, R., Coutures, J.P., 1983. Solar gasification of carbonaceous materials, Sol. Energy 557
30, 513–525. 558
Z’Graggen, A., Haueter, P., Trommer, D., Romero, M., De Jesus, J.C., Steinfeld, A., 2006. Hydrogen 559
production by steam-gasification of petroleum coke using concentrated solar power—II Reactor design, 560
testing, and modeling. Int. J. Hydrog. Energy, vol. 31, no. 6, pp. 797–811, 2006. 561
562 563