HAL Id: hal-03063889
https://hal.archives-ouvertes.fr/hal-03063889
Submitted on 14 Dec 2020
HAL is a multi-disciplinary open access
archive for the deposit and dissemination of
sci-entific research documents, whether they are
pub-lished or not. The documents may come from
teaching and research institutions in France or
abroad, or from public or private research centers.
L’archive ouverte pluridisciplinaire HAL, est
destinée au dépôt et à la diffusion de documents
scientifiques de niveau recherche, publiés ou non,
émanant des établissements d’enseignement et de
recherche français ou étrangers, des laboratoires
publics ou privés.
SYNTHESIS OF THE VIBROACOUSTIC RESPONSE
OF A PANEL UNDER DIFFUSE ACOUSTIC FIELD
USING THE SYNTHETIC ARRAY PRINCIPLE
A. Pouye, Laurent Maxit, Cédric Maury, Marc Pachebat
To cite this version:
A. Pouye, Laurent Maxit, Cédric Maury, Marc Pachebat. SYNTHESIS OF THE
VIBROACOUS-TIC RESPONSE OF A PANEL UNDER DIFFUSE ACOUSVIBROACOUS-TIC FIELD USING THE SYNTHEVIBROACOUS-TIC
ARRAY PRINCIPLE. e-Forum Acusticum, Dec 2020, Lyon, France. �10.48465/fa.2020.0448�.
�hal-03063889�
SYNTHESIS OF THE VIBROACOUSTIC RESPONSE OF A PANEL
UNDER DIFFUSE ACOUSTIC FIELD USING THE SYNTHETIC
ARRAY PRINCIPLE
Augustin Pouye
1,2Laurent Maxit
1C´edric Maury
2Marc Pachebat
2 1Laboratory of Vibrations and Acoustics, Lyon, France
2
Laboratory of Mechanics and Acoustics, Marseille, France
augustin.pouye@insa-lyon.fr, laurent.maxit@insa-lyon.fr
ABSTRACT
The reproduction of the vibration and acoustic re-sponses of structures under random excitation such as the diffuse acoustic field or the turbulent bound-ary layer is of particular interest to researchers and the transportation industry (automobile, aeronautics, etc.) as well. Indeed, the determination of these vibroacous-tic responses requires making in-situ measurements or using test facilities such as the anechoic wind tunnel, which are complex and costly methods. Another draw-back of these test means is the variability of the results when for instance; the same structure is tested in dif-ferent facilities of the same kind. Based on the pre-vious considerations, the necessity of finding a sim-ple, cost-efficient and reproducible alternative method becomes obvious. In the present paper, a method of achieving this goal using a single acoustic source and the synthetic array principle is proposed. To assess the validity of this method, we propose an academic case study consisting of a baffled and simply supported alu-minum panel under diffuse acoustic field and turbulent boundary layer excitations. The vibration response of the plate as well as the transmission loss are de-termined with the proposed process and compared to results from random vibration theory. These compar-isons show good agreement between both the results obtained with the proposed approach and the theoreti-cal ones.
1. INTRODUCTION
The experimental characterization of structures under random excitations such as the diffuse acoustic field (DAF) and the turbulent boundary layer (TBL) is of great interest to the transportation industry and the building sector. However, the test facilities used (re-verberant chamber for the DAF and anechoic wind tunnel or in-situ tests for the TBL) can sometimes be complex and costly. Moreover, the results obtained for a given structure can be very different from one facility to another even though the same setup is implemented. The experimental reproduction of the vibroacous-tic response of structures under stochasvibroacous-tic excitations
using an array of acoustic sources has been theoreti-cally shown some decades ago. But due to technical limitations, this method could not be experimentally validated back then. Since 2000, many researchers have addressed this problem using various approaches. Maury, Bravo, Elliott and Gardonio [1–4] have widely discussed the reproduction of a TBL excitation using an array of loudspeakers. This method works well when it comes to the reproduction of a DAF excita-tion but due to the limited number of sources in the array, it fails to simulate the wall-pressure fluctua-tions of a subsonic TBL excitation because of the high wavenumbers involved meaning that a denser source array would be needed. In this paper, an improve-ment of the previous approach using the synthetic ar-ray principle is proposed. This technique aims at sim-ulating the vibroacoustic response of structures under these random excitations independently of the envi-ronment. This process has been used by Aucejo et al. [5] under the name of Source Scanning Technique (SST) in order to reproduce the vibration response of a steel panel to a TBL excitation in the low frequency domain (up to 300 Hz).
This paper is organized as follows: first the theo-retical background on the vibroacoustic response of a simple structure under random excitation is given. Secondly, the source scanning technique is briefly de-scribed. Finally, after presenting the experimental setup, some results are presented.
2. WAVENUMBER FORMULATION This analysis considers the response of two dimen-sional rectangular structures to a random pressure field excitation. This pressure field is assumed to be sta-tionary in time and homogeneous in space. We will be interested in two types of random excitations: the diffuse acoustic field and the turbulent boundary layer excitation.
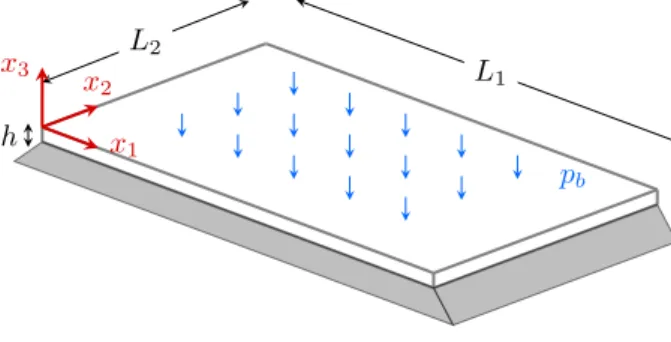
The geometric configurations of the studied struc-ture is shown in Fig. 1. In the following, we will assume that the wall-pressure fluctuations are not af-fected by the vibrations of the structure which means that the excitation is not modified by the structural
re-L1 L2 h x1 x2 x3 pb
Figure 1. Simply supported plate on all edges.
sponse. Thus the random excitations considered in this paper are modeled by the wall pressure fluctuations that would be observed on a smooth rigid wall, also known as the blocked pressure pb[6].
2.1 Response of Panels to Random Pressure Fields The response of the panel when excited by the blocked-pressure pb(y, t) is denoted α (x, t) and
des-ignates the panel velocity response v (x, t) if x is lo-cated on its surface Σp. Otherwise, it corresponds to
the radiated pressure by the panel pr(x, t) or the
par-ticle velocity response v0(x, t). It is given by the
fol-lowing convolution product
α (x, t) = Z t 0 Z Z Σp γα(x, y, t − τ ) pb(y, τ ) dxdτ (1) where γα(x, y, t) is the space-time impulse response
of the panel at point x when excited by a normal unit force at point y. With the previous assumptions made on the random processes involved, the cross-correlation function Rαα0(x, t) can be written
Rαα0(x, t) =
Z +∞
−∞
α (x, t) α0(x, t + τ ) dτ (2)
where α0(x, t) also designates v, pror v0.
Perform-ing a time-Fourier transform of the cross-correlation function after introducing Eq. (1) in Eq. (2) yields the following space-frequency spectrum of the panel response (see Ref. [7] for details)
Sαα0(x, ω) = Z Z Σp Z Z Σp Γα(x, y, ω) Spbpb(y, z, ω) ×Γ∗α(x, z, ω) dydz (3) where Γα(x, y, ω) is the time-Fourier transform of
γα(x, y, t) and corresponds to the panel frequency
re-sponse function at point x when excited by a normal force at point y; Spbpb(y, z, ω) is the time-Fourier
transform of the blocked-pressure cross-correlation function and the superscript “∗” represents the com-plex conjugate.
Defining the wavenumber-frequency spectrum of the blocked-pressure Spbpb(k, ω) as the
wavenum-ber transform of its space-frequency spectrum Spbpb(x, y, ω) yields Spbpb(x, y, ω) = 1 4π2 Z Z +∞ −∞ Spbpb(k, ω) e jk(x−y)dk (4) Introducing Eq. (4) in Eq. (3) and re-arranging, one obtains the following expression of the panel response
Sαα0(x, ω) = 1 4π2 Z Z +∞ −∞ Hα(x, k, ω) Spbpb(k, ω) ×Hα∗0(x, k, ω) dk (5) where Hα(x, k, ω) = Z Z Σp Γα(x, y, ω) e−jkydy (6)
is called the sensitivity function and it characterizes the vibroacoustic behavior of the panel. In practice, this response is approximated by
Sαα0(x, ω) ≈ 1 4π2 X k∈Ωk Hα(x, k, ω) Spbpb(k, ω) ×Hα∗0(x, k, ω) δk (7) where Ωkis a set of properly chosen wave-vectors.
The DAF is very well known random excitation. In fact, there is a closed-form solution that exactly de-scribes it. The space-frequency spectrum of a DAF is defined by the following equation [8]
Spbpb(r, ω) = Φpbpb(ω)
sin (k0r)
k0r
(8) where r = |x − x0|; ω is the frequency; k0 =
ω/c0 is the acoustic wavenumber and c0 the speed
of sound in the medium. Φpbpb(ω) designates the
wall-pressure auto-spectral density function. The wavenumber transform of the space-frequency spec-trum yields the frequency-wavenumber specspec-trum of the DAF blocked-pressure
Spbpb(k, ω) = Φpbpb(ω) 2π k0 1 q k2 0− |k| 2 if |k| < k0 0 if |k| ≥ k0 (9) where |k| = pk2
1+ k22, k1and k2are the
wavenum-bers in the x1and x2directions, respectively.
2.2 Radiated Power
The radiated power is defined by the following equa-tion
Πr(ω) =
Z Z
Σp
where dx is the surface element and Iact(x, ω) is
the normal component of the active sound intensity at point x. The active sound intensity is directly related to the CSD function Spv0(x, ω) between the sound
pres-sure and the particle velocity at point x [9]
Iact(x, ω) = < [Spv0(x, ω)] (11)
where < designates the real part and from Eq. (7), one has Spv0(x, ω) ≈ 1 4π2 X k∈Ωk Hp(x, k, ω) Spp(k, ω) Hv∗0(x, k, ω) δk (12) In practice, the radiated power will be estimated by an approximation of the integral of Eq. (10) with the rectangular rule
Πr(ω) ≈
X
x∈Σr
Iact(x, ω) δx (13)
where Σr is an elemental surface at a distance x3 on
the radiating side of the panel.
3. SOURCE SCANNING TECHNIQUE The Source Scanning Technique (SST) relies on the linearity of the involved phenomena and on the prin-ciple of wave superposition. SST also relies on the assumption that the random pressure fields of interest can be modeled as a set of uncorrelated wall-pressure plane waves. This technique is used for the mea-surement of the sensitivity functions which allow to compute the vibroacoustic response of the panel when the excitation is known, namely Spbpb(k, ω). The
synthetic array principle consists in using a unique monopole source which is spatially displaced to dif-ferent positions thereby creating virtually the array of monopole sources. It is closely related to the concept of Synthetic Aperture Radar (SAR), which consists in post-processing the signals received by a moving radar to produce fine resolution images from an intrin-sically resolution-limited radar system in the along-track direction [10]. The proposed approach is based on the mathematical formulation of the problem in the wavenumber domain. This formulation is appro-priate because it allows an explicit separation of the contributions of the excitation via the wall-pressure cross-spectrum density function from those of the vi-broacoustic behavior of the structure via the sensitiv-ity functions. This formulation is also computation-ally more efficient than the space-frequency formula-tion [7].
Given a target pressure field p (x, k, ω) = e−ikx consisting of wall-pressure plane waves of wave-vector k = (k1, k2), there are three main steps for the
reproduction of this target pressure field using SST
(a) Characterization of the acoustic source: mea-surement of the transfer functions (Gsp) between
source positions s and observation points p on the plate (microphones), see Fig. 2
x1 x2 x3 Gps p s microphone array source array active source Figure 2. Measurement of Gps(ω)
(b) Computation of the source amplitudes Qs at
each position by inversing the equation below X
s
Gps(ω) qs(k, ω) = pp(k, ω) (14)
(c) Synthesis of the target pressure field: in order to determine the vibroacoustic response of the struc-ture, one needs to determine the following sensi-tivity functions
Hα(x, k, ω) =
X
s
Qs(k, ω) Γsα(x, ω) (15)
where α = (v, p, v0) and Γsα(x, ω) represents the
frequency response function (FRF) of the structure at point x which is to be measured.
x1 x2 x3 baffle panel x Γs v
4. EXPERIMENTAL SETUP
The plate was manufactured using the protocol pre-sented by Robin et al. [11] and was placed in a baf-fle consisting of a 2 cm thick square plywood with a 1 m side and in which there is an aperture the size of the plate, see Fig. 5. A mid-high frequency monopole source manufactured by Microflown is used to gener-ate the sweep signals necessary for the determination of the transfer functions between the source and an ar-ray 1/400ROGA RG-50 microphones. This source was placed on the arm of a 3 axis Cartesian robot in order to automatize the displacement of the source. The vi-bration response of the structure was measured using a Br¨uel & Kjær type 4508 accelerometer. It is important to note that the monopole source used for the experi-ment was only efficient from approximately 300 Hz to 7000 Hz.
Figure 4. Measuring the transfer functions Gsp
The measurements were done in a room where the three walls are covered with absorbing wedges and 10 cm absorbing foam panels were placed on the floor and around the structure inside the baffle in order to prevent the potential reflections and noises coming from the robot and acquisition system from polluting the measurements.
Figure 5. Baffled simply supported panel
5. RESULTS AND DISCUSSION
In all the results shown below, there is a horizontal shift (along the frequency axis) which is due to the fact that in the theoretical model, the boundary conditions are considered perfect which they are not in practice.
Fig. 6 shows the auto-spectrum density func-tion of the structural velocity response at point x =
(0.06, 0.3, 0) m (in dB units) when excited by a DAF.
Figure 6. DAF vibration response: theory (thin black line), SST (thick gray line).
It can be observed that the vibration response de-termined using SST do not match the theoretical ones under 300 Hz: this is due to the fact that the source is not efficient in that frequency range as stated be-fore. The vertical offsets that can be observed at some frequencies are due to the fact that for the theoretical case, the modal damping of the plate is taken constant in the entire frequency range whereas it is not the case in real conditions.
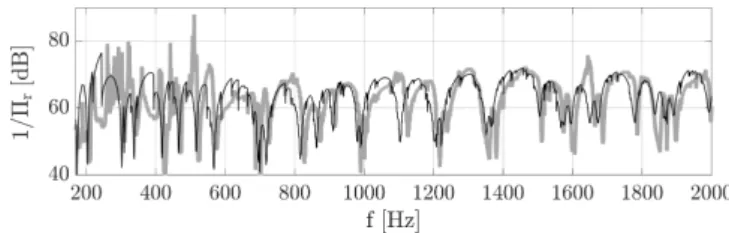
Fig. 7 shows the inverse of the radiated power (in dB units) by the panel when excited by a DAF.
Figure 7. Inverse of the radiated power under DAF: theory (thin black line), SST (thick gray line).
The radiated power was determined using the two microphone method. The experimental results do not match the theoretical ones under approximately 600 Hz: this is probably due to the fact that the monopole source was not very efficient to induce a sufficient radiation amplitude for the measurement of the pressure and particle velocity sensitivity functions. Above that frequency, there is a good agreement be-tween the theoretical results and those obtained using SST.
6. CONCLUSION
The results obtained using SST for the simulation of the DAF induced vibrations of a rectangular panel were compared to numerical results. This compari-son showed a fairly good agreement between both re-sults. The process was automatized with two Cartesian robots controlled by a Matlab code: this will allow us to characterize more complex panels in the future.
Further details on this study as well as results for a turbulent boundary layer excitation will be available
in the submitted journal paper [12]. 7. ACKNOWLEDGMENT
This work was funded by the French National Re-search Agency (VIRTECH project, ANR-17-CE10-0012) and was performed within the framework of the LABEX CeLyA (ANR-10-LABX-0060) of Uni-versit´e de Lyon, within the program “Investisse-ments d’Avenir” (ANR-16-IDEX-0005) operated by the French National Research Agency (ANR).
8. REFERENCES
[1] C. Maury, S. J. Elliott, and P. Gardonio, “Turbu-lent Boundary-Layer Simulation with an Array of Loudspeakers,” AIAA Journal, pp. 706–713, 2004. [2] S. J. Elliott, C. Maury, and P. Gardonio, “The synthesis of spatially correlated random pressure fields,” The Journal of the Acoustical Society of America, pp. 1186–1201, Mar. 2005.
[3] T. Bravo and C. Maury, “The experimental syn-thesis of random pressure fields: Methodology,” The Journal of the Acoustical Society of America, pp. 2702–2711, Oct. 2006.
[4] C. Maury and T. Bravo, “The experimental synthe-sis of random pressure fields: Practical feasibility,” The Journal of the Acoustical Society of America, pp. 2712–2723, Oct. 2006.
[5] M. Aucejo, L. Maxit, and J.-L. Guyader, “Source Scanning Technique for Simulating TBL-Induced Vibrations Measurements,” in Flinovia - Flow In-duced Noise and Vibration Issues and Aspects, Dec. 2014.
[6] F. J. Fahy and P. Gardonio, Sound and Struc-tural Vibration: Radiation, Transmission and Re-sponse. Amsterdam ; Boston: Academic Press, 2 ed., 2006.
[7] C. Maury, P. Gardonio, and S. J. Elliott, “A Wavenumber Approach to Modelling the Re-sponse of a Randomly Excited Panel, Part I: Gen-eral Theory,” Journal of Sound and Vibration, vol. 252, pp. 83–113, Apr. 2002.
[8] R. K. Cook, “Measurement of Correlation Coef-ficients in Reverberant Sound Fields,” Acoustical Society of America Journal, vol. 27, p. 1072, Jan. 1955.
[9] F. Fahy, Sound intensity. Elsevier Applied Science, 1989.
[10] J. C. Curlander and R. N. McDonough, Synthetic Aperture Radar: Systems and Signal Processing. New York: Wiley-Interscience, 1 edition ed., Nov. 1991.
[11] O. Robin, J.-D. Chazot, R. Boulandet, M. Michau, A. Berry, and N. Atalla, “A Plane and Thin Panel with Representative Simply Supported Boundary Conditions for Laboratory Vibroacoustic Tests,” Feb. 2016.
[12] A. Pouye, L. Maxit, C. Maury, and M. Pachebat, “Reproduction ot the Vibroacoustic Response of Panels under Stochastic Excitations using the Source Scanning Technique,” 2020. Manuscript submitted for publication in the Journal of Sound and Vibration.