A. MULTIPATH TRANSMISSION
Prof. L. B. Arguimbau J. Granlund
B. Brown W. L. Hatton
F. G. Cole J. B. Lewi
R. A. Paananen
1. Speech and Music a. Field tests
Field tests of FM reception with the laboratory wideband receiver are now under way. L. B. Arguimbau, J. Granlund b. New receiver
An attempt is being made to construct an FM broadcast receiver utilizing relatively few tubes but incorporating the principles of multipath interference reduction. The parts to be constructed are the i-f amplifier, a two-tube limiter, a discriminator and an audio amplifier stage. A bandwidth of 2 Mc for the limiter and discriminator was chosen after a study of multipath interference in cities showed this to be a reasonable compromise. A one-tube discriminator to handle this bandwidth at 10.7 Mc has been developed in place of the balanced tWo-tube arrangements previously used.
R. A. Paananen c. Three-path propagation interference
Measurement of output interference in a receiver whose input consists of three component signals has been started, using the static case, i.e. three unmodulated signals to represent the effects of three-path propagation. The ratio of the output from the vector sum of such components to the output from the stronger component alone gives a measure of the interference resulting from the presence of additional paths. Ideally, these outputs are measured by the direct voltage at the discriminator output; but intolerably large random shifts occur in the direct voltage at the discriminator output, so measurements are being made by observing the amplitude of the output wave-form when the two undesired (smaller) input components are keyed at about a 5-kc rate. Check measurements agree well with calculated results in the two-path case. Cal-culation in the three-path case is rather lengthy, but provides additional checks. If the desired component has unit amplitude and instantaneous angular frequency p, and the undesired components have amplitudes a and b, and instantaneous angular frequencies q and r, the average resultant angular frequency is
(VII. COMMUNICATIONS RESEARCH)
Zfq 2Tr
S= Cos
1 + a cos q+ b cos- + a sin + b sin p
/p P P p P p
where a and b < 1, and q and r > p. This result may be converted to a voltage by trans-posing it through the discriminator characteristic. B. Brown
2. Television
Calculations have been carried out to determine the effect of a peak modulation limiter on pre-emphasized video signals. The system for which the calculations were made is shown in Fig. VII-1.
The video signal used for VIDEO
VIDEO PRE- DE OUT calculation purposes was a
SIGNALS EMPHAS SGNALS CLIPPERHASIS EMPHASIS
I smooth transition of variable
amplitude and fixed rise time. Fig. VII-1 Circuit for study of pre-emphasis.
The pre-emphasis and
de-emphasis circuits are chosen so that when the signal is small enough to pass through the clipper undamaged, the video output is identical with the video signal at the input. As the amplitude of the input is increased, the clipper removes some of the overshoot caused by pre-emphasis, and the output no longer resembles the input. Instead, the output rises at a steep slope up to a certain point and then at a much slower rate to the final value. If the point at which the break occurs is above the 90-percent point, (the rise time is measured from the points of 10 percent to 90 percent response) the rise time is nearly the same as the input rise time. If the break occurs at some lower point the rise time is much greater than the input rise time. Fig. VII-2 shows the effect on the output as more and more of the overshoot is clipped off. Curve a shows the output when no clipping occurs. As less and less overshoot is passed through the clipper, the break occurs as shown in b and moves to lower levels until the very slow rise e is obtained when no over-shoot is allowed.
A circuit of this kind was built up, and square wave tests confirm these results. Actual video signals will be put through this circuit to see how much deterioration in picture quality results from the clipping.
The two-klystron method of obtaining wide-deviation FM signals has been dropped in favor of the conventional reactance tube, since the klystrons would have to be stabilized for satisfactory results, and the output of the crystal mixer is very small.
A reactance tube circuit has been built up which shows promise of giving a
total deviation of 5 Mc/sec at 50 Mc/sec, and a discriminator to check the deviation
-46-dynamically is under test.
An attempt to extend the usable band-width of a Granlund discriminator is also being made. The center frequency is 100 Mc/sec and it is hoped that proper
operation can be obtained over a band of
an M /
J V5/ se c
Fig. VII-2 Effect of clipping on rise time. W. L. Hatton, J. B. Lewi, F. G. Cole
B. STATISTICAL THEORY OF COMMUNICATION
Prof. J. B. Wiesner E. E. David, Jr. A. J. Lephakis Prof. W. B. Davenport, Jr. L. Dolansky L. Levine Prof. R. M. Fano J. Fairfield, Jr. H. E. Singleton
Prof. Y. W. Lee E. H. Gibbons O. H. Straus
Prof. J. F. Reintjes P. E. Green, Jr. C. A. Stutt
P. E. A. Cowley L. G. Kraft
1. Analogue Electronic Correlator
Near the close of the past quarterly period, work was resumed on an analogue electronic computer for evaluating correlation functions. This project is an extension
of earlier work done in the Laboratory on a similar type of correlator. It is hoped that a device can be developed which will be compact and stable, and sufficiently accurate and flexible to make it useful as a general laboratory instrument. Present plans call for a machine which will yield the correlation functions of signals ranging in frequency from 0 to 4 Mc/sec for arguments between 0.25 1sec and 5 msec.
J. F. Reintjes 2. Digital Electronic Correlator
This correlator has been operating satisfactorily during the past quarter. Figures VII-3, VII-4, VII-5 and VII-6 show some of the results obtained. More details con-cerning these results and a complete description of the correlator will be published in R.L.E. Technical Report No. 152.
Y. W. Lee, H. E. Singleton, L. G. Kraft 3. Detection of Small Signals in Noise
The digital electronic correlator has been used to detect the waveshape of a small periodic signal in noise. The input to the correlator consisted of a square wave of
Fig. VII-4 Autocorrelation function of square-wave generator with random zero crossings.
Fig. VII-3 Autocorrelation function of sine wave.
20 10 5 2.5 0.10 0.250 0.5 T IN MILLISECONDS 0.025
----....
~
I
I
I
'"
~ '"""
6~
\ 4\
\
2f\
\
r
If
(
\1\
01\
)
V 10 <p(T)Fig. VII-5 Autocorrelation function of clipped noise.
I
~
00 I
square wave (upper trace shows square wave enlarged).
periodic square wave (upper trace shows square wave enlarged) • O r .- \---+---\ I '----+. :--e--- :--e--- -\ --+--1 • ~:_--_ - - - i -~:_--_ ~:_--_~ - - _ _ ---L ~. _ t .~-~-=-=.----T -.--- -.--- -.--- -.--- -.--- -.--- _ -.--- J-.---.---.--- J---r===ps==-r===:p~=:c==:t===-t===r':.=-=-=.=-=-=-=-=--=-t--
.,
-~--I .t:>--.D INOISE
GENERATOR LIMITER
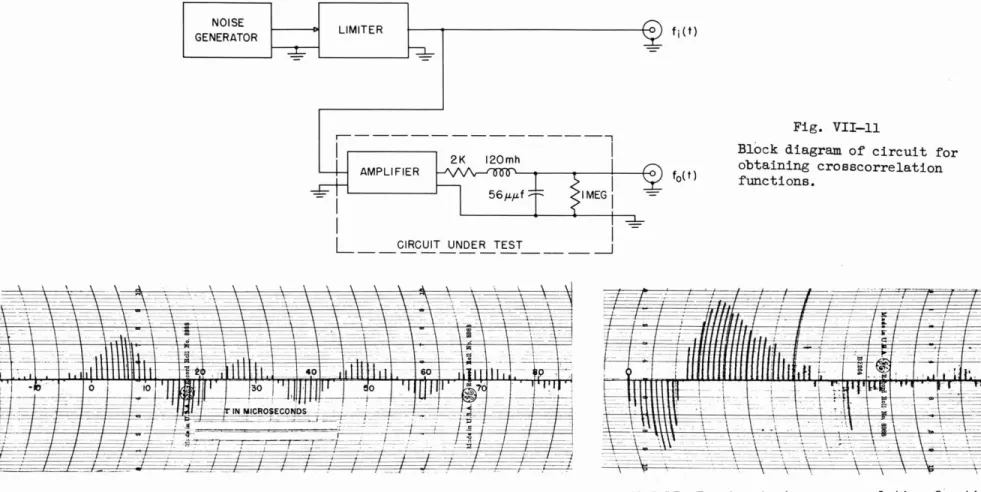
Fig. VII-II
Block diagram of circuit for
obtaining cro8scorrelation functions. 56fLfLt AMPLIFIER
I
I
L __
CIRC~T~NDE~TEST
J
, - - - ,I
I
I U1 o I , \ \ . ' ~ \ \,
\ \ \ \ \ ~, ,
~ - ~\: =--X===\~ -'f ~ =-\==-~ _4. _ -\ ,Fig. VII-12 Input-output crosscorrelation function for R-L-C circuit. Fig. VII-13 Input-output crosscorrelation fUnction
for amplifier.
32-pLsec period with 0.05-volt to-peak amplitude, plus white noise having a peak-to-peak amplitude of approximately 1.65 volts. Oscilloscope pictures of this input are
shown in Fig. VII-7. After the process of crosscorrelation with a periodic unit impulse of the same period as the square wave, the noise is greatly reduced relative to the periodic signal. The output of the correlator is shown in Fig. VII-8.
Similar results have been obtained when the input periodic square wave is added to a much larger signal of clipped noise. Figures VII-9 and VII-10 are the input and output of the correlator in this case. Y. W. Lee, L. G. Kraft
4. Experimental Determination of System Functions by the Method of Correlation
For checking the theoretical result reported in the last Quarterly Progress Report that the time response to a unit-impulse excitation of a linear system is, except for a constant factor, equal to the input-output crosscorrelation function when the input is a white noise, the circuit shown in Fig. VII-11 was used. The wide-band noise source was a 6D4 gas tube with an essentially flat spectrum. Figs. VII-12 and VII-13 show the cross-correlation curves obtained from the digital electronic correlator for an R-L-C circuit and an amplifier respectively. For comparison, photographs of the time response of the circuit and the amplifier under unit-impulse excitation are given in Figs. VII-14 and
VII-15. J. B. Wiesner, Y. W. Lee
5. Optimum Linear System Design Criteria
The application of the convolution integral (1), p. 60, Quarterly Progress Report, January 15, 1950 in the Wiener-Hopf equation (2), p. 61, shows that Wiener's minimum-mean-square- instantaneous-error criterion in optimum linear system design demands that
id(T) = io(T) for T 0 . (1)
The condition (1) is illustrated graphically by Figs. VII-16 and VII-17. If Fig. VII-16 represents the crosscorrelation function id(T) and Fig. VII-17, io(T), then Wiener' s design criterion requires that the linear system should behave in such a way that id(T)
and 'Pio(T) have the same value for every positive value of T. The negative values of these functions
are different for the general case in which the mean-square error cannot be completely eliminated. The --- manner in which they differ depends upon the nature of the demand made on the output for a given input. Fig. VII-16 Input-desired output If the desired output is physically possible to
(VII. COMMUNICATIONS RESEARCH)
and io(T) holds for all values of . 7 in the range (- , mo).
For the minimum-inte gral- square -crosscorrelation-error criterion reported in the last Quarterly Progress Report it may be shown that
i )
Niiio(T)
-0
The use of this convolution integral in Eq. (4), --- p. 62, Quarterly Progress Report, January 15,
1950 yields the condition that Fig. VII-17 Input-actual output
crosscorrelation function.
criterion. The double correlation similarly expressed as
ii-id(T) = iiio(T) for T> 0
which corresponds to condition (1) for the Wiener function 4 iiid(T ) 11-161i-iohas been defined and iiio(T) is
iiio(T) = f ii(t) io(t + T)dt
io o
(4) The graphical interpretation of condition (3) may be given as before with 4id(T) of Fig. VII-16 replaced by .iiid (T), and io(T) of Fig. VII-17 replaced by iiio(T)..
Y. W. Lee 6. Application of Wiener' s Techniques in Transient Synthesis
The method outlined in the last Quarterly Progress Report may be extended to the case of the design of a network in cascade with a given fixed system. With the additional notations G(w) for the system function of the given system, G(X) for the conjugate of G(X) and
(1) where G (X) and G-(X) are conjugate factors, the former containing all poles and zeros
in the upper half plane and the latter all poles and zeros in the lower half plane, the optimum linear system is specified by the equations
and 0
1
-(t) fg() G() ejXt dX -0 ff() G-(X)(2)
(3) Y. W. Lee -52-Oio (T) " "-.-I
0IG(X)
I -= G+(X) G-(X) h(o) iiii(T-aO)do . (2)7. Techniques of Optimum Filter Design
Experience has shown that in many cases it is more convenient to approach the design of optimum linear systems from a prescribed time response rather than from a prescribed frequency response. The wide variety of time responses, and in some instances their complexity, required in this study makes it highly desirable to construct a flexible transmission system which can be easily adjusted to approximate a desired response. Such a system has been designed, using the principle of delay, and is now under construction.
A simplified form of the system is shown in Fig. VII-18 wherein the delay is obtained
by means of an artifical line. The output of the system is the sum of weighted voltages obtained by tapping the line at regular intervals. Cathode-follower stages are used at
OUTPUT
_r
Fig. VII-18 Delay-line filter.
the tap points so that essentially no energy will be taken from the line. The voltage from a particular tap is weighted simply by means of a potentiometer in the cathode circuit; by appropriate adjustment of all the potentiometers one is able to approximate a large number of responses. The use of delay permits an adjustment with little effect on previous adjustments.
Approximation of transient response.
a. (left) Prescribed impulse response
b. (right) Pulse response of line
To illustrate the procedure, suppose it is desired to obtain a system which has the impulse response h(t) shown in Fig. VII-19a. The response is seen to consist
of a continuous part plus impulses occurring at t = 0 and t = a. In approximating this response with the line, the impulse used to initiate the transient may be a
h (t)
Fig. VII-19
(VII. COMMUNICATIONS RESEARCH)
pulse having a duration approximately that of the electrical distance between tap points on the line. As the voltage pulse travels down the line, a weighted replica of its shape is fed from the taps to the output; thus the approximation to the response h(t) may appear as shown in Fig. VII-19b where the pulse shape is idealized to a rectangular form.
If h(t) is negative for some intervals of time, the necessity of taking pulses of nega-tive polarity from the line may be obviated by adding into the output a neganega-tively varying exponential voltage as a kind of bias.
The adjustment of the line for the proper impulse response completes the design of the transmission system, and the line may then be used to transmit whatever signals (random time functions in this study) had been assumed in arriving at the prescribed
transient response. Y. W. Lee, C. A. Stutt
8. Amplitude and Conditional Probability Distributions of a Quantized Time Function
Measurements have been made of the zero crossing period distributions of several different voices. Partial noise suppression was obtained through the use of a 20-cps square-wave bias signal.
If we define the clipped speech wave as a rectangular wave having a unit value when the voice wave is zero or positive, and having a zero value when the voice wave is negative, the autocorrelation function of this clipped speech wave is given by
cii(T) = P(0 . x(t + T)
I
0< x(t) P(O < x) .That is, the given autocorrelation function is equal to the conditional probability that the voice wave is non-negative at a time t + T (having been non-negative at the earlier time t) times the probability that the voice wave is non-negative. Both probabilities can be
measured directly with the amplitude distribution analyzer discussed in previous Quar-terly Progress Reports. Using this technique, the autocorrelation functions of clipped
speech have been measured for several different voices.
Technical Report No. 148 which is being written will cover the measurement theory, the equipment design, and the experimental results obtained in this project.
W. B. Davenport
9. Felix (Sensory Replacement)
One of the deficiencies of Felix in the past was that the effective filter bandwidth and the pattern received by the skin stimulators was a function of the sound intensity. To overcome this defect we have installed the microphone, a circuit which successively
-54-differentiates, clips, and integrates the speech. Dr. Licalider of the Acoustics Labora-tory has shown that the modification of speech indicated above does not affect its intelli-gibility. Actually, the differentiator and clipper would be sufficient as a volume control. The integrator is added to reduce the level of the harmonics in the clipper rectangular wave output below skin sensitivity.
SPEECH INPUT
Fig. VII-20 Block diagram of Felix.
We have also made a change in the method of adjusting the apparatus to the skin sensitivity of each subject. Instead of using a pulsed sinusoid as a tuning signal, we will henceforth use pulsed random noise. The sinusoidal input fails to allow for two impor-tant considerations: (a) The skin thresholds of feeling and pain of electrical stimula-tion rise gradually from low to high frequency in any given bandwidth. (b) No allowance
can be made for the possibility of the impulse on one stimulator masking the impulse on another.
A block diagram of the present unit is shown in Fig. VII-20.
J. B. Wiesner, L. Levine, O. Straus
10. Speech Studies
a. A short-time correlator for speech waves
An experimental band-pass filter delay line comprising 15 inductively-coupled tuned circuits has been constructed and tested. The amplitude and phase characteristics are shown in Fig. VII-21. The frequency range of interest is + 4 kc from the midband fre-quency. Although the phase characteristic is very linear, the attenuation droop is too great. This droop can be overcome by stagger tuning of the coils; the adjustment is made experimentally and is readily made with filter parts comprising small numbers of tuned circuits. Figure VII-22 shows the amplitude and phase characteristics of a filter
comprising 7 inductively-coupled tuned circuits. The delay line will comprise 36 SKIN
2 STIMULATOR
(VII. COMMUNICATIONS RESEARCH) 4-8_ Z 0 12 -Z S16- 20--8 -4 0 4 8 12 1 1 -16 -12 4 8 0 12 z - 16 20 16 FREQUENCY8REF. MIDBAND)KG
-- 600 1.-u, w U)r400 W (D U) < 200 I I--16 -12 -8 -4 4 8 12 16 -200 --400_ -600 -800 -I I I I -40 -30 -20 -10 0 10 20 30 40 FREQUENCY (REF MIDBAND) KC
u, 100
-W 4
4<e 50
-16 -12 -8 -4
~-~
4 8 12 16FREQUENCY (REF MIDBAND)KC
Fig. VII-21 Amplitude and phase shift
of filter comprising 15 inductively-coupled tuned circuits. -50 -100 -150
FREQUENCY (REF MIDBAND)KC
Fig. VII-22 Amplitude and phase character-istic of filter comprising
7 inductively-coupled tuned
circuits.
similar filter parts each having a delay of 46 1sec approximately and making available 36 tapping points on the line. If required, phase equalizers will be added at intervals
along the line. R. M. Fano, P. E. A. Cowley
b. The effect of syllabic rate on speech intelligibility
In the last Quarterly Progress Report a method of speeding up speech without changing its fundamental pitch was outlined. The equipment has been completed and some pre-liminary tests have been run.
To accomplish the speed change, the outputs of the channels of a vocoder analyzer were recorded on a multichannel tape recorder and then played into the vocoder
synthe-sizer at various speeds. Since the pitch of the voice manufactured by the vocoder is determined by the instantaneous levels of the channel signals and not by the rate at which the signals arrive at the synthesizer, the speed of talking is varied by this method but the pitch is not changed.
The recording and playback equipment is shown in block diagram in Fig. VII-23. An eight-channel recorder was used; this meant combining the top two spectrum channels of the vocoder in order to permit the recording of the pitch channel as well as the
spectrum channels. This reduction of the number of channels (but not of bandwidth) seemed to have no appreciable effect on intelligibility. Variable playback speed was obtained by a combination of two methods. Drive capstans of several sizes allowed speed ratios of 1:2:3:4. Intermediate steps were obtained by varying the frequency of the source which drove the synchronous motors of the recorder. The variable-frequency
source was simply a rotary converter whose speed was regulated by controlling the d-c voltage driving it. The tape speed was measured by observing the drive capstan with a
strobotac.
Looking at the recording apparatus in Fig. VII-23 we see that the output of a vocoder analyzer channel was first modulated on a 500-cycle carrier. This allowed the recording of the d-c components of the channel signals and eliminated distortion of the low-frequency signals due to recorder wow. The modulators were of the balanced type with crystal diodes. They had a linear dynamic range of 40 db.
The output of a balanced modulator consists of the two side bands with the carrier suppressed, along with all the carrier harmonics plus or minus the odd harmonics of the modulating signal. Since the modulation is relatively linear in action, these undesired products are small and do not require much attenuation to be eliminated. Therefore a low-Q tuned circuit was used following the modulator to separate the side bands from the other modulation products. This circuit response was down 15 db at one octave on either side of the carrier and had a bandwidth of 150 cycles, sufficient to pass the maximum modulating-signal frequency of 25 cycles with negligible phase shift or attenuation.
FROM ANALYZE CHANNEL TO OTHER TO OTHER 7 CHANNELS 7 CHANNELS RECORDING EQUIPMENT TO SYNTHESIZER CHANNEL'I TO OTHER 7 CHANNELS PLAY-BACK EQUIPMENT
(VII. COMMUNICATIONS RESEARCH)
The tuned circuit was followed by the recording amplifier. This was a conventional pentode amplifier; a pentode was picked for its current character. A constant-current source is desirable for magnetic recording because the flux density on the tape is proportional to the ampere-turns of the recording head and, hence, to the recording current. The gain of the recording amplifier was such that with normal level signals introduced into the modulator, about 2 ma of recording current was available (about
double that required by the heads).
Bias current for recording was introduced to each head through a 500-p4f condenser which offered a low impedance to the 50-kc bias current but provided more than 60-db decoupling between channels at the signal frequency. A 50-kc amplifier delivering 8 watts of power fed all 8 channels in parallel.
For playback, a three-stage triode amplifier was designed with a maximum gain of about 90 db at 500 cycles. This was more than sufficient to raise the 5-millivolt output of the recording head to the 70 volts needed to drive the detector. By using well-filtered, d-c supplies for both the plates and filaments, the signal-to-noise ratio was kept at 60 db. A high-frequency de-emphasis RC network in the amplifier gave a negative slope of 6 db per octave above 200 cycles to the frequency characteristic. This was to com-pensate for the reverse characteristic of the playback head. The output voltage of a magnetic recorder is proportional to the derivative of the flux density and therefore increases 6 db per octave with frequency.
An infinite-impedance detector followed the playback amplifier. The high input impedance prevented any unnecessary loading of the amplifier and the output impedance was of the right order of magnitude to match the vocoder synthesizer input. An unbalanced detector was permissable to detect the balanced output of the recorder due to the nature of the vocoder channel signals. These signals are slowly-varying d-c signals of a single polarity; consequently, the output of the balanced modulator was a carrier whose ampli-tude was proportional to the modulating signal ampliampli-tude. To recover the modulation it was necessary only to clip the negative half of the carrier. A linear response within 2 db was maintained by the demodulator over a 40-db dynamic range.
The output of the detector was followed by a 100-cycle, low-pass filter, This was necessary to separate the modulation with a maximum frequency of 100 cycles (allowing a speed increase of 4: 1) from the 500-cycle carrier. The filter attenuated the carrier by about 40 db.
Some simplified articulation tests have been run on the overall equipment and indicate the following. The overall intelligibility is high, about 85 percent. No serious distortion arises from the introduction of the recording equipment. The intelligibility vs. speech speed characteristic shows a very definite cutoff. The exact location of this cutoff has been only roughly determined but seems to be around 20 phones or five syllables per second. More numerous and elaborate tests
-58-must be taken to determine the cutoff more accurately and also the slope of the character-istic beyond cutoff.
Such tests are in progress now.
R. M. Fano, J. Fairfield, Jr. 11. Pulse Coding of Picture Signals
The complete coding system has been built and put in working order. No results are forthcoming at this time. J. B. Wiesner, E. H. Gibbons
12. Pulse-Code Magnetic Recorder
The erasing circuit has been completed and now consists of the original Magnecord oscillator, with an erasing head of the same laminations as in the original head, but having a greater width (for operation with 35-mm tape). The number of turns in the erasing head was kept the same as in the original arrangement, but the fixed turning capacitor was decreased. The erasing circuit, together with the driving, recording and playback unit, is now being used by Mr. Fairfield for speech-speed increaser studies (p. 56 of this report).
The design of the electronic part of the recording system has been finished and all essential parts have been tested on a breadboard model, except for the stage recording on tape. The final diagram for the timing and coding circuit is shown in Fig. VII-24. At the present time, the coding and timing circuits are being built in the permanent form (according to Fig. VII-24) and ways to improve the characteristics of the recording
stage are being investigated.
J. B. Wiesner, L. Dolansky
13. Twin-Track Recorder for Slow Phenomena v
The two-channel f-m tape recording system for storage of low frequency signals has been completed and tested. A block diagram of one of the channels is shown in Fig. VII-25. In the recording section the output of the preamplifier serves as the voltage to which both grids of a conventional multivibrator are returned. The output frequency
of the multivibrator then varies nearly linearly with the input voltage, as shown in Fig. VII-26. A center frequency of 1000 cycles is used and the peak deviation from this for
100 percent modulation is 55 percent. This f-m signal is recorded on magnetic tape moving at a speed of 3 in./sec.
On playback, the tape is run at 15 in./sec. The signal, which now has a center fre-quency of 5000 cycles, is amplified and reshaped so that finally there is produced a series of pulses having constant width and height, but instantaneous frequency equal to that of the f-m signal. These pulses are fed through a low-pass filter so that all that appears at the playback output is the average value, proportional to the pulse repetition rate.
0",
2)ZAU7 - VIE
Sa I~-o uoiNPUT
100K '50K S60K .| F0 /c.r vvv.vv'., . . 3 F1 s15TOR5 WITHOUT wATT INDICAIoN FE
I~
iT (OOK 5HOULD BE Q.5W va, ,,11
F 0A0 bo CODE C300
~GJF
-FzoCODER
CUTPUT
Fig. VII-24 Pulse-code magnetic recorder.
Figure VII-27 shows the frequency response curve for the overall system. High frequency attenuation is caused entirely by the low-pass filter in the playback; low frequency attenuation occurs in the recorder preamplifier. (In the recorder described here, the preamplifier is RC-coupled. If necessary, the response could be made flat down to zero frequency by using a d-c amplifier for this purpose.) The waveforms of
Fig. VII-28(a) and (b) are the outputs for 6-cycle and 50-cycle square wave inputs respectively.
The tape handling unit is a modified Amplifier Corporation of America type 808A twin-track chassis. As yet, no effort has been made to obtain highly uniform tape speed, hence there are distinct noise components visible in the waveforms of Fig. VII-28.
The construction of a device for continuous playing of a 200-foot loop of tape, with variable delay between tracks, is to be begun soon by O. H. Straus and E. C. Ingraham. This device will be used with the recording equipment described here in the investigation of several low-frequency phenomena, notably brain waves.
J. B. Wiesner, P. E. Green, Jr.
C. TRANSIENT PROBLEMS
Prof. E. A. Guillemin W. H. Kautz Dr. M. V. Cerrillo L. Weinberg 1. Transient Theories
During the past few months, an effort has been made to obtain a deeper technical control of the approximating properties of the continued-fraction expansions of analytic functions in connection with the investigation of the general integral
f(t) = F(s) eW( s 't) ds (1)
y(s)
It is necessary to approximate FeW by simple functions in certain specific "regions of fast variation" in the s-plane, these regions being determined by that interval of time t over which a good approximation is desired, and by the contour y(s). The continued fraction expansions of algebraic and certain transcendental functions are important here because their approximants (partial sums) approximate the original function in particu-larly useful ways. The situation is somewhat analogous to the representation of a mero-morphic function in the vicinity of a group of its poles for the appropriate terms in its partial fraction expansion.
If the function being expanded is algebraic and multivalued, its continued fraction expansion represents one branch of the function; the position of the characteristic
(VII. COMMUNICATIONS RESEARCH)
branch cut in the s-plane depends upon the particular expansion used. The poles and zeros of the approximants alternate along the position of the cut, and tend to bunch together near the branch points. This behavior is illustrated in Fig. VII-29 for the
f, -+r.+h -r-rimn n f that e ancinn inf F(c~ = (1 + s21-/2
BRA
CL NE which has its characteristic cut as shown. If W(s,t)
= st in the integral (1), it is known that f(t) = Jo (t), and a cor-relation between the degrees of approximation of F(s) by the approximants and of J (t) by the integrals of these approximants can be made. These approximations are shown in Figs. VII-30, VII-31, VII-32 for three character-istic cuts and up to the sixth approximant; here fn(t) is the integral of the n-th approximant of F(s). It may be s-PLANE readily observed that the shortest cut corresponds to the
best approximation of J (t) about t = 0, while the longest cut produces a better approximation for large t. A cut of intermediate length yields accurate results near t = 1 or t = 2. The convergence in these intervals is very rapid, Fig. VII-29 Approximating so that for all practical purposes, the cut may be replaced properties of continued by two or three poles and zeros. The continued fractions
fraction expansions of
single branches of multi- given may be obtained by expressing F(s) in a
hypergeo-value functions. metric series, for which expansions are known (1).
+ f3(t)
Jo (t)
f5(t)
f4(t)
Fig. VII-30 Approximations to Jo(t) obtained from the continued fraction expansion corresponding to the shortest branch cut.
+ (s- -i) 2+. .... 2+. 2+ (s-I+i) 2+ 2 (s-l+i) 2+2 2+.
Fig. VII-31 Approximations to Jo(t) obtained from the continued fraction
expansion corresponding to the longest branch cut.
,2 ts 2 f2(t) /f3(t) (s+ I)+ 2 s(s )2 2( s++) 2(s+l)+. f3(t) Jo(t),f5() \1 f2 (t) s- PLANE
Fig. VII-32 Approximations to Jo(t) obtained from the continued fraction expansion corresponding to a branch cut of intermediate length.
f3(t)
(VII. COMMUNICATIONS RESEARCH)
If the function being expanded is an entire function, the poles and zeros of the approxi-mants lie in a (roughly) circular pattern about s = 0; the radius of the circle increases with the number of poles and zeros as the order of the approximant is increased. The possibilities of representing rational fractions (network system functions) by means of entire functions in certain portions of the s-plane is being investigated more fully at present.
A plot of the magnitude of the first Lommel generating function, computed more carefully than previously reported is shown in Fig. VII-33.
T-10.5 / - 2.5 k1.25 T 'a.8 T . T0.6 4 6 8
Fig. VII-33 Isometric plot of some typical cross sections of amplitude
function
126
= JU2(S, T) + iU1(S2,T) for real arguments.A detailed study of the solids of the transient generating functions has been started, following the general notion of transient classification into families and their members.
It has been found convenient to classify transients into three general families: resonance, transitional and selective or essential formation. Each particular family may be mixed with the members of the families listed above it, thereby forming the so-called mixed transients. Each family contains more members than those listed above it. Some of the results submitted here correspond to the mixed transitional type of transient, and are derived from the real cross section of the pure transitional solid. The mech-anism of transient composition is also illustrated.
-65-PURE TRANSITION FORMATION
(3rd ORDER)
REAL jAI(E1 SOLID
VICINITY OF B=0
0"
B REAL
PURE TRANSITION FORMATION
,MG(,B_ SOLID (3d ORDER) VICINITY OF B=O.-FUNCTIONS I cy, r
PURE AND MIXED TRANSITIONAL FORMATION (3" ORC (B = X,REAL;COINCIDING SIN( V PLANE Sd POLE SZERO ( PURE TRANSITION (3rd ORDER).
(X=B; PURE REAL)
) MIXED TRANSITION. COINCIDING POLE FORMATION.
) MIXED TRANSITION. COINCIDING ZERO FORMATION. GENERATING FUNCTIONS. T 271 e(BV+dvAA(B) 2 v dv SIv(Bv +V3) A, ri - e(BV+V3) dv (DIPOLE). IF v. =vbTHEN
Example of the mechanism of transient formation.
MIXED TRANSITION (3rdORDER) POLE FORMATION (X REAL CASE) GENERATING FUNCTION dv Tn v-v0 POLE (Va SMALL) DIRECTION OF INTEGRATION / S.P
V PLANE f -COINCIDING POLE
-4 -3
THIS FORMATION IS CHARACTERIZED
POLE DEVIATION-0.I 0 Fig. VII-37 Sa.
...
a a a POINTS ) a= INVARIANT (ALMOST POLE DEVIATION +0.1OVERSHOOT CORRECTING TERM
S(ZERO FORMATION)7 -0.3 0.2 GROUP VELOCITY POINT 2 345 6 8 7 10 1 13
Effect of dipole and zero deviations on
coin-ciding-dipole and coinciding-zero transients.
TRANSITION. COINCIDING POLE FORMATION
PURE RESONANCE I.i
FORMATION IC0 0.9 SL[+ ERF(X e )] 08 07 / POINT OF STEEPEST 0.6 V/ TANGENT (X) dX +I X --II 12
Effect of pole deviation on coinciding-pole transient.
Fig. VII-38 Comparison of a class of transitional
and resonance transients.
URVE
URVE
Fig. VII-35
BY A NEGLIGIBLE LATERAL SHIFT
-2 -1 C -0. -n-,
_
i_ I_ _ ___
I 0-Y[
uJ Fig. VII-3610
-8 6 -4 - .20 2 1!1 10 .2 XCos(X) -SiN(X) x2 -tO -6 -4 6 12 -6 -2 o 2 4 102 . X-.2. 3 AhX) 31 .12 -10 4 2 2, 8 , 2 _.2 _.3 _4 FOURTH ORDER FIFTH ORDER INFINITE ORDERFig. VII-39 Effect of the change of order in some
(VII. COMMUNICATIONS RESEARCH)
Fig. VII-34 shows a simplified aspect of the third order transitional solid, in which only a few cross sections are represented to make the picture more understandable. The solids corresponding to real, imaginary, magnitude, and phase of Ah3, 1(X) are given.
Fig. VII-35 shows the pure, pole, and zero transitional transients corresponding to the core of coinciding dipole, coinciding pole, and coinciding zero, and for X real.
Fig. VII-36 shows the effect of pole deviation from the coinciding position. It may be noted that the effect of the pole shift on the overshoot of the wave is large, but leaves practically invariant the rising part of the transient.
Fig. VII-37 shows the corresponding changes when the dipole and the zero are deviated from the coinciding position. This latter type of mixed transient is almost insensitive to a shift of the zero.
Fig. VII-38 illustrates the comparison between transitional and resonance transients. A comparison of transitional transients - pure, zero and pole - is given graphically in Fig. VII-39 in which the transients are generated by Ahn, 1(X), n = 3,4, 5,-; X real. Note how the transient becomes more and more symmetric as the order increases.
In all these transients we have represented only the effect of the longitudinal genera-ting function. The multiplication by a variable factor, here an exponential, must be included to obtain the final result. This factor is omitted in order to retain only the important terms which describe the transient and the corresponding mechanism of formation.
Reference
(1) H. S. Wall: Continued Fractions, chapter 18 (van Nostrand, New York, 1948).
D. ACTIVE NETWORKS
Prof. E. A. Guillemin Dr. M. V. Cerrillo Prof. J. G. Linvill J. G. Truxal
1. The Synthesis of Servomechanisms
It was shown in the last Quarterly Progress Report that the synthesis of servo-mechanisms is straightforward if the restrictive assumption is made that all components of the system are linear. Any general design procedure, however, must consider the possibility of nonlinearity in the fixed part of the system - particularly slow nonlinearity, or changes in system parameters over a time-interval long compared to the response time of the servo, and changes which are incoherent with the signal.
This research has led to an investigation of techniques for the control of the
-69-sensitivity of the overall system function to slow changes in a system parameter. One simple configuration permitting this control is shown in Fig. VII-40. If F(s) denotes the transfer function of the fixed part of the system, the effect of the variation of a
8i(s) 90s (s)
G(s) F(s)
K(s)
Simple servo configuration.
Although the use of positive infinite gain, it is desirable
parameter in F(s) on the overall system function H(s) can be reduced by increasing the gain of the tandem compensation network G(s). This is simply a restate-ment of the familiar idea in feedback amplifiers of increasing the loop gain to minimize the effects of non-linearity.
In the limiting case, G(s) w ®, the transmission is independent of F(s), H(s) being given by H(s) = 1/K(s). feedback in G(s) theoretically permits the attainment of practically to determine the minimum I G(s) I leading to a system which is satisfactory from a stability viewpoint over the expected range of varia-tion of F(s).
The sensitivity of H(s) to changes in a parameter x of F(s) is given by d ln H(s) H(s) d In F(s)
S dnx i - F(s) • G(s) d in x
For the simple example of the with t the variable
normalized transfer function of a hydraulic transmission
s(s + 2s + 1)
s 2s2 H(s)
H( 01 the interpretation of/(s) in terms of the sensitivity of the system stability is difficult because of the complex nature of (s) on the real-frequency (jo) axis. If the practice of the bulk of the literature in the servo field is used, with the maximum value of IH(jw) I used as a
P-7
stability criterion, the real part ofzl'(jw) must be deter-Fig. VII-41 H(s) as a real mined and interpreted. These difficulties can be
circum-function of real vari- vented by an interpretation of stability in terms of the able o;
behavior of the system function along the positive-real axis in the s-plane, for on this axis/(s) is a real function.
As will be described more fully in a forthcoming technical report, the overshoot of the step function response of typical servo systems can be determined from the behavior of H(o-) where o' Re(s). In practice, a limiting permissible value of H(a) can be
Fig. VII-40
(VII. COMMUNICATIONS RESEARCH)
determined, as shown by the dotted curve of Fig. VII-41, with the characteristic that all H(a) below this curve relate to systems having step-function responses with less than a
given overshoot.
With these concepts, the design procedure is straightforward. Integration of the expression for sensitivity yields the change in H(o) as a function of both G(o') and the change in the variable parameter. Knowledge of the maximum permissible change in H(a) and the specified range of the variable permits the determination of a minimum G(a). Once a suitable form for G(s) is chosen, the parameters of G(s) and the expression
for K(s) can be determined directly from the desired H(s) (with a mean value of the variable), the given F(s), and the known minimum G(a).
The procedure described very briefly here will be amplified and illustrated in the laboratory report mentioned above. Examples worked at this time indicate that the
procedure does serve as a useful design technique for the treatment of slow nonlinearities. E. A. Guillemin, J. G. Truxal
E. LOCKING PHENOMENA IN MICROWAVE OSCILLATORS Prof. J. B. Wiesner E. E. David, Jr. Prof. R. M. Fano W. P. Schneider 1. The Mutual Synchronization of Oscillators
A detailed theoretical examination of the mutual synchronization of oscillators has been carried out. The parallel and series operation of two similar oscillators has been
determined by use of the scattering matrix, characterizing the interconnecting network, and the Rieke diagrams of the oscillators used. The method is applicable to the general
case of M oscillators operating into an N terminal-pair network. It has been shown that the principal factors determining the operation are relative position of oscillators with respect to the interconnecting network, relative tuning of the oscillators, and inter-connecting network.
2. Effects of Starting Transients on Synchronized Behavior
Experimental work is continuing in an effort to verify the theory presented in Part II of R.L.E. Technical Report No. 100. A method of measuring preoscillation noise in a pulsed magnetron has been developed. The procedure involves measurement of the variations in starting time of a pulsed oscillator from pulse to pulse. A determination of the distribution in time of the leading-edge of an r-f magnetron pulse is now being made. It is hoped that such information will permit the envelope amplitude distribution of the preoscillation noise to be determined.
-71-3. A Suppressed-Carrier AM System
An experimental circuit, which utilizes two synchronized klystrons, has been con-structed. When modulation is applied in push-pull to the reflectors, a conventional suppressed-carrier AM signal results. Such factors as linearity, bandwidth and noise are now under investigation.