Validation of a quasi-2D model for aerated flows over stepped spillways for mild and steep slopes
8
0
0
Texte intégral
(2) 2 Identically to smooth chutes, the flow along the stepped slope can be divided into distinct regions (Falvey [4]). Near the dam crest, in the non-aerated region, the water flow accelerates while its depth decreases and the turbulent boundary layer grows rapidly with a smooth water surface. When the boundary layer reaches the surface, the turbulent energy of the vortices is large enough to initiate natural air entrainment at the so called inception point. The free surface becomes wavy and white with spray ejections making it difficult to define its delimitation. In this partially developed aerated region, the airwater mixture depth and the mean air concentration gradually increase till reaching an equilibrium between head loss and gravity. In this fully developed aerated region, air concentration at saturation, velocity and flow normal depth are constant from one edge to another. The localisation of the regions, which depends mainly on the discharge, the slope and the roughness, are defined by a set of empirical relationships proposed, among others, by Matos [5] and Boes [6]. Compared to smooth chutes, steps increase significantly energy losses due to the turbulent structures induced by the geometry of the bottom. Indeed, for a given chute, for low discharge, the flow starts to jump from step to step (see Figure 1a) impacting the downstream of the horizontal face, with or without a hydraulic jump development. This nappe regime is the most efficient for dissipating flow energy. As the discharge increases, air cavities fill progressively and the flow begins to slide over the pseudo-bottom formed by the step edges (Figure 1b). With increasing kinetic energy, 3D recirculating cells start to develop over the step faces (Figure 1c), with the remain of a 2D internal jet deflected near the step edge. While the velocity profile inside the step has a 3D complex pattern, above the pseudo-bottom the velocity is quite uniform, in the mean slope direction. During this skimming regime, head losses are mainly associated to the vortices as well as to the internal jet. Both turbulent structures and air entrainment are essential to be taken into account in the quasi-2D model since they have a direct effect on energy dissipation and on flow depths, two relevant parameters for designers.. Figure 1. Sketch of the three flow regimes: a) nappe, b) transition and c) skimming flow with the corresponding pictures of the flow over the 30° stepped flume..
(3) 3 MATHEMATICAL APPROACH Balance equations and flow computation Despite the two-dimensional structure of the flow in the vertical plane, the most relevant characteristics of the flow can be described with a depth-averaged technique. The proposed numerical approach consists in applying an extended form of the shallow-water equations, taking into account self-aeration processes, the uneven vertical velocity distribution, and the macro-roughness dissipation effects. The flow is modelled by the conservative Navier-Stokes equations, integrated on the air-water mixture depth. The mass balance is written as follows: ∂ ∂ (1) ( ρ h ) + ( ρ hU ) = 0 , ∂t ∂x where ρ ( x, t ) = ρ w (1 − C ) + ρ a C ≈ ρ w (1 − C ) represents the mixture density, with ρ w and ρ a respectively the density of water and of air, h the mixture depth, U the depthaveraged velocity, t and x the time and space coordinates. Considering a frame of reference inclined along the mean slope of the spillway, the following momentum balance equation is obtained (André et al. [7]): ∂Z ∂ ∂ ∂ g (2) ( ρ hU ) + ( ρ h ρ xxU 2 ) + ρ h 2 cosθ + ρ gh cosθ b = ρ gh sin θ + τ bx , ∂t ∂x ∂x 2 ∂x with θ the mean slope of the pseudo-bottom, Z b the bottom elevation in the inclined frame of references, τ bx the bottom shear stress and ρ xx the Boussinesq coefficient, representing the uneven velocity profile. Eq. (2) is based on one single hypothesis, stating that the square of the velocity component normal to the pseudo-bottom can be neglected compared to the square of the component parallel to the pseudo-bottom. This assumption is commonly applied for shallow-water simulation on steep slopes (see for example Berger and Carey [8]). On the basis of the laboratory observations and due to the high flow velocity, it was suggested to represent the air entrainment along the chute by a transport equation: ∂C ∂C +U = Sa , (3) ∂t ∂x with S a a source term and C the local depth-averaged air concentration. Sa , the air source term in Eq. (3), intends: - to represent the air entrainment and detrainment processes as a function of the flow conditions, the slope and the entrance condition (gated or crested structures), - to satisfy the observed conditions i.e C = 0 upstream of the inception point and C increasing downstream up to C = Cu , with Cu the saturation air concentration. For this purpose, the air source term is globally expressed by: 2. β. ∂u (4) Sa = −Γ m m (C − Cu ) − U r C 1 − C , ∂x with Γ and β, calibrated constants with the experimental results, Ur, the air bubble release velocity of the diffusive term U r C 1 − C derived from the depth-averaging of the.
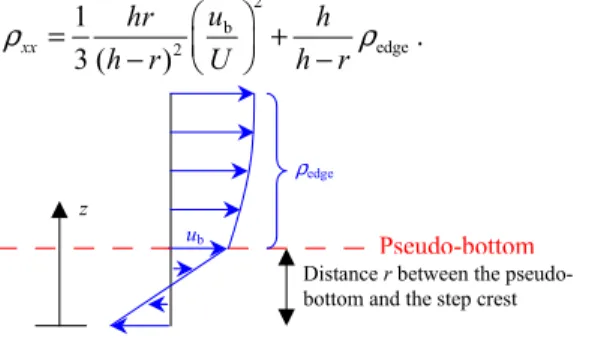
(4) 4 diffusive model of Chanson [9]. For modelling the onset of air entrainment, m = 0 or m = 1 respectively upstream and downstream of the inception point. The position of the latter is given by an empirical relationship depending on the entrance type, the Froude number and the chute slope. Cu is also provided by experimental results. The set of Eq. (1)-(3) can be further simplified considering that ρ = ρ w (1 − C ) and S a is simply evaluated as a function of the difference between the local air concentration and its equilibrium value: S a = −m Γ ( C − Cu ) (André et al. [7]). Non-uniform velocity profile Assuming a uniform velocity profile over the water depth is clearly too simplistic for stepped spillway applications. Although still rather schematic, the velocity profile considered here includes a recirculation below the pseudo-bottom level and is thus far more realistic. The so-called Boussinesq coefficient ρ xx in Eq. (2), defined according to the following integral on the cross-section A, A ρ xx = 2 ∫∫ U 2 dA (5) q A enables to take into account this non uniform velocity profile. A diagram of the selected profile is presented on Figure 2. At the pseudo-bottom, the interface velocity ub is given according to experimental results. Above the pseudo-bottom, for z > r , the velocity of the skimming layer is assumed to be non-uniform, characterised by ρedge , a calculated coefficient of uneven velocity distribution. The macro-turbulent structures of the flow are thus indirectly incorporated into the model. According to the velocity profile sketched on Figure 2, the longitudinal variation of ρ xx is given by: 2 h 1 hr ub (6) ρ xx = ρedge . + 2 3 (h − r ) U h − r ρedge z ub. Pseudo-bottom Distance r between the pseudobottom and the step crest. Figure 2. Non-uniform velocity profile assumed in the quasi-2D numerical model.. Friction modelling Since the step topography is directly modelled in the momentum Eq. (2) and the flow turbulent structures are indirectly modelled through the Boussinesq coefficient ρ xx in the momentum balance, the losses term may be represented only by the shear stress effect over the step. In this first approximation, the loss term, τbx has been then modelled by the Manning relation, Eq. (7) with n, the Manning coefficient, fitted in order to obtain velocity and flow depth comparable to experimental data..
(5) 5. τ bx = gn 2 hm (1 − C )U. ρ xxU 2 Rh. 4/3. (7). with Rh the hydraulic radius. If no wall effect is assumed, Rh = h (André et al. [7]). In order to handle properly wall friction in a narrower flume, this expression has been corrected : Rh = bh ( b + 2h ) , with b the spillway width. A goal of the present study is to achieve results reflecting the observations, with a friction coefficient as close as possible to the relevant value for the material (n = 0.013 to 0.016 s/m1/3 in the present case). NUMERICAL MODEL Numerical simulations have been performed with WOLF software, which has been developed for several years at HACH. WOLF applies a finite volume technique to solve quasi-2D and -3D free surface flows (Archambeau [10]). This solver of the depthaveraged Navier-Stokes equations also allows to model sediment transport (Dewals [11]) as well as air entrainment, transport and detrainment. In the present applications, the time discretization is based on a dissipative Runge-Kutta scheme to enhance the convergence. VALIDATION ON MILD AND STEEP SLOPES Mild slope (30°) The quasi-2D model of aerated flow over stepped chutes model had been firstly applied to the 30° gated flume (jetbox entrance as described in André et al. [3]), for transition and skimming flow regimes, the most likely encountered in prototypes. The validation was based on the experimental results concerning the free surface profile (waves amplitude and period), the air concentration evolution along the chute, the longitudinal mean velocity and the normal mixture depth in the uniform region. The sensitivity analysis of the air source term Sa of Eq. (4) gave realistic results for the longitudinal variation of the air concentration with S a = −0.25 m (C − Cu ) . In Figure 3a, the computed air concentration is compared with experimental results for skimming flow (qw = 0.12 m2/s) and with the empirical formula of Boes [12] for a 30° gated or crested stepped chute: C ( X ) = Cu {1 − exp[−0.05( X + 25)]} , where X = ( x − Li ) / H i and Li, Hi, respectively the longitudinal position and depth at the inception point. If the implementation of the air transport equation permits the swelling of the flow depth, it is not enough to cushion the topography impact on the free surface which follows exactly the steps form (details in André et al. [7]). Reaching a quite realistic free surface shape has been provided by the addition of the correction coefficient ρxx in the momentum equation. ρxx models indirectly the turbulent structures (recirculating cells and internal jet effect): - on the head losses term with a decrease of the Manning coefficient from 0.03 s/m1/3 to 0.024 s/m1/3 if ρxx is included in τbx, - on the waves amplitude of the free surface, in accordance with the observations. In fact, for increasing discharges the waves amplitude decreases because the turbulent structures of the steps are cushioned by the large skimming layer (see Fig. 1c)..
(6) 6 Finally, the optimal numerical results were obtained for the set of equations composed with the mass balance, the momentum balance with ρxx according to Eq. (6), and with n = 0.024 s/m1/3 in τbx (with Rh = h ). The computed mixture depth in the uniform region is given in Figure 3b for qw = 0.12 m2/s and 0.16 m2/s (skimming flow). Since the computed flow depth and velocity are of same order of magnitude as the measured ones, the computed residual energy is thus validated. In spite of these promising results, the modelling of the 2D structures in the vertical plane still need to be improved. In fact, the correction coefficient as defined herein still involves an overestimated Manning coefficient and the waves of the free surface are still little out of phase compared to observations.. 0.45. a). 0.14 0.14. Cu Main flow direction. 0.40. b). 0.12 0.12 0.10 0.10. 0.35 0.30. axis(m) (m) Z Zaxis. Mean air concentration C (-). 0.50. 0.25 0.20. Measurements Γ=1 Γ=0.7 Γ=0.25 Experimental formula [Boes (2000)]. 0.15 0.10 0.05 0.00 0.0. 0.5. 1.0. 1.5. 2.0. 2.5. 3.0. 3.5. 4.0. X axis (m). 4.5. 5.0. 5.5. 0.08 0.08 0.06 0.06. Modelling topography Measured free surface, qw=0.12 m2/s Optimal computed free surface, qw=0.12 m2/s Measured free surface, qw=0.16 m2/s Optimal computed free surface, qw=0.16 m2/s. 0.04 0.04 0.02 0.02. 6.0. 6.5. 7.0. 0.00 0.00 5.00 5.00. 5.04 5.04. 5.08 5.08. 5.12 5.12. 5.16 5.16. 5.20 5.20. 5.24 5.24. 5.28 5.28. X axis (m)ininthe uniform region X axis (m), uniform region. 5.32 5.32. 5.36 5.36. Figure 3. a) Air entrainment effect on the longitudinal variation of C, for qw=0.12 m2/s; b) Computed uniform mixture depth for qw=0.12 and 0.16 m2/s with ρxx given by Eq. (6) and n = 0.024 s/m1/3 (without wall effect).. Steep slope (52°) The experimental flume of HACH-ULg (Collard [13]) is 52° steep and has a total height of 2.034 m at the level of its ogee crest (Figure 4). The flume is 0.494 m wide and the steps height is 0.03 m. The computation grid is composed of 1238 regular cells of 0.0038 m length with an integer number of cells for each step. The total discharge is imposed at the subcritical upstream boundary when at the downstream of the computation domain, no boundary condition is implemented since the flow is supercritical.. Flow direction. Stilling basin. Pseudobottom Figure 4. Description of the 52° experimental flume of HACH-ULg and (box) meshing of one step..
(7) 7 In a first series of tests, the specific discharge is 0.0552 m³/s/m and the equilibrium air concentration has been measured: C = 0.56 . The most realistic results were obtained for a Manning coefficient n = 0.025 . Figure 5 presents a comparison between the computed mixture depth and the measured values. Most numerical results are satisfactorily similar to experimental data. The profile is correct at the spillway crest and in the upstream part of the chute. Further downstream the mixture depth computed by the numerical model appears slightly lower than the laboratory measurements. Nevertheless, this discrepancy has no influence on the region downstream of the inception point and on the uniform depth which remains in good agreement with experimental value. Results of similar adequacy with experimental data were obtained for other discharges as well: 0.0449 m³/s/m, 0.0506 m³/s/m and 0.0607 m³/s/m. Results on the longitudinal variation of the computed air concentration are very encouraging. Indeed, as illustrated in Figure 6, computed values are in good agreement when compared with Matos [5] empirical formula and with experimental values. Measured. WOLF. Elevation (m). Topography. Topography. Measured. WOLF. (b) Cell number (a) Cell number Figure 5. Free surface for the discharge of 27.6 l/s (a) on the whole 52° steep flume (b) in the uniform area. 0.6. 0,6. 0.5. 0,5. 0.4. 0,4. C 0.3. C 0,3. 0.2. C (Exper). 0.1. C (Matos). 0,2. Experimental. 0,1. 0.0. Numerical. 0,0. 0. 10. 20 Step number. 30. 40. 0. 5. 10. 15. 20. 25. 30. Step number. Figure 6. Depth-averaged air concentration profile along the chute. Comparison between experimental results by HACH-ULg, Matos’formula and numerical results in the 52° flume, for a discharge of 27.6 l/s.. CONCLUSION The presented numerical model for the description of the hydraulic behaviour of aerated flows over stepped chutes of various slopes is based on the depth-averaged balance of mass and momentum for an air-water mixture, and on a transport equation for the air concentration. The consideration of the specific flow properties such as the coefficient of uneven velocity profile has permitted to model indirectly the macro-turbulent structures of the flow (recirculating cells and internal jet) and then their effect on the dissipation process. This approach provides very promising results by predicting flow characteristics quite close to the measurements. Still a higher accuracy will be achieved by further.
(8) 8 developments of a more general description of aerated flows over macro-roughness. The present developments provide already a tool of interest for the design of stepped chutes. REFERENCES [1] Benmamar, S., Kettab, A., and Thirriot, C., Numerical simulation of turbulent flow upstream of the inception point in a stepped channel, in Proc. XXX IAHR Congress. Theme D: pp. 679-686. Thessaloniki, Greece, 2003. [2] Chen, Q., Dai, G., and Liu, H. Volume of Fluid Model for Turbulence Numerical Simulation of Stepped Spillway Overflow. J. of Hydraul. Eng., 128(7): pp. 683-688, 2002. [3] André, S., Boillat, J.-L., and Schleiss, A. Efficient surface protection by macroroughness linings for overtopped embankment dams. Proc. Int. congress on conservation and rehabilitation of dams: pp. 407-415, Balkema, 2002. [4] Falvey, H.T., Air-water flow in hydraulic structures, in USBR Engineering Monograph n°41. 1980. [5] Matos, J., Hydraulic design of stepped spillways over RCC dams, in Proc. Int. Workshop on Hydraulics of Stepped Spillways, Minor and Hager, Editors. 2000, Balkema: Rotterdam. pp. 187-194. [6] Boes, R. and Hager, W.H. Two-phase flow characteristics of stepped spillways. J. Hydraul. Eng., 129(9): pp. 661-670, 2003. [7] André, S., Dewals, B.J., Pirotton, M., and Schleiss, A., Quasi 2D-numerical model of aerated flow over stepped chutes, in Proc. XXX IAHR Congress, Theme D: pp. 671-678. Thessaloniki, Greece, 2003. [8] Berger, R.C. and Carey, G.F. Free-surface flow over curved surfaces - Part I: perturbation analysis. Int. J. Numer. Meth. Fluids, 28(2): pp. 191-200, 1998. [9] Chanson, H. Air bubble entrainment in open channels: flow structure and bubble size distribution. Int. J. of Multiphase flow, 23(1): pp. 193-203, 1997. [10] Archambeau, P., Dewals, B., Detrembleur, S., Erpicum, S., and Pirotton, M., A set of efficient numerical tools for floodplain modeling, in Shallow Flows, G.H. Jirka and W.S.J. Uijttewaal, Editors. 2003, A.A. Balkema. [11] Dewals, B., Archambeau, P., Erpicum, S., Mouzelard, T., and Pirotton, M. Coupled computations of highly erosive flows with WOLF software. Proceedings of the 5th International Conference on Hydro-Science & -Engineering, Warsaw, 2002. [12] Boes, R.M. Zweiphasenströmung und Energieumsetzung an Grosskaskaden. PhD thesis, Minor H.-E. editor, VAW-ETHZ, Zurich, 2000. [13] Collard, M. Etude expérimentale et théorique des écoulements biphasiques sur les évacuateurs en marches d'escalier. Diploma thesis, University of Liege, 2003. ACKNOWLEDGEMENT The authors wish to express their gratitude to Maud Collard, undergraduate student who was in charge of the measurements in the 52° flume (ULg, HACH). The research project is funded by the Federal Office for Water and Geology, Switzerland and the European Research Community On Flow, Turbulence and Combustion (EPFL part), as well as by the Duesberg foundation of ULg and the Deprez foundation of ULg (ULg part)..
(9)
Figure


Documents relatifs
The model performances against datasets being documented in previous sections, we focus here on key mechanisms ex- pected from a “high-latitude” model: (1) the conversion of winter
ﺎﻧﺎﻨﺘﻣا ﻢﻴﻈﻋو ﺎﻧﺮﻜﺷ ﻞﻳﺰﲜ مﺪﻘﺘﻧ صﻼﺧﻹاو ءﺎﻓﻮﻟا قﺪﺼﺑ ةذﺎﺘﺳﻷا ﺎﻨﺘﻓﺮﺸﻣ ﱃإ " ﺔﺸﺋﺎﻋ شﻮﻨﻴﻋ " ةﺮﻛﺬﳌا ﻩﺬﻫ داﺪﻋإ ﻦﻣ ﺎﻨﺘﻨﻜﻣ ﱵﻟا ﺔﻤﻴﻘﻟا ﺎﻬﺤﺋﺎﺼﻧ
Fig. Kinetics of hydrogen absorption in NdScSi at 350 °C and 5 bar. Tencé et al.. solve the hydride crystal structure, neutron diffraction measure- ments were performed during
Evolution of weekly temperature data assimilation statistics from in situ profiles, function of the depth averaged over the whole Mediterranean basin : number of observations
More precisely, it is possible to perform formal asymptotic expansions for weakly nonlinear surface waves, and to derive a well-posed amplitude equation even though the
We show now that the two-fluid model degenerates into the classical water- wave equations in the limit of an interface separating two pure fluids.. Consider the case where α is either
Taleb and Petit [14] performed dilatometry tests under thermal and stress cycles in order to determine if re-austenitization erases transformation induced plasticity..
3 - ﺐﻳدﻮﺑأ لﺎﻤﻛ ( 1942) : و يﺪﻘﻨﻟا ﻞﻘﳊا ﰲ ﻩرﺎﻜﻓأ ةرﻮﻠﺑ ﺎﳍﻼﺧ ﻦﻣ لوﺎﺣ ﱵﻟا ﺔﻳﺮﻌﺸﻟا عﻮﺿﻮﲟ ﺐﻳد ﻮﺑأ لﺎﻤﻛ ﻢﺘﻫا إ ءﺎﻄﻋ ، ﺔﻳﺮﻈﻨﻟا ﻩﺬﳍ ﺔﺑرﺎﻘﻣ دوﺪﺣ
