HAL Id: hal-01443060
https://hal.archives-ouvertes.fr/hal-01443060
Submitted on 22 Jan 2017HAL is a multi-disciplinary open access archive for the deposit and dissemination of sci-entific research documents, whether they are pub-lished or not. The documents may come from teaching and research institutions in France or abroad, or from public or private research centers.
L’archive ouverte pluridisciplinaire HAL, est destinée au dépôt et à la diffusion de documents scientifiques de niveau recherche, publiés ou non, émanant des établissements d’enseignement et de recherche français ou étrangers, des laboratoires publics ou privés.
Factorial experimental design applied to DRIE for
optimised process in power electronics applications
requiring high aspect ratio trenches.
Magali Brunet, Pascal Dubreuil, Hicham Kotb, Aline Gouantes, Anne-Marie
Dorthe
To cite this version:
Magali Brunet, Pascal Dubreuil, Hicham Kotb, Aline Gouantes, Anne-Marie Dorthe. Factorial ex-perimental design applied to DRIE for optimised process in power electronics applications requiring high aspect ratio trenches. . Microsystem Technologies, Springer Verlag, 2009, 15 (9), pp.1449-1457. �10.1007/s00542-009-0893-3�. �hal-01443060�
Editorial Manager(tm) for Microsystem Technologies Manuscript Draft
Manuscript Number:
Title: Factorial experimental design applied to DRIE for optimised process in power electronics applications requiring high aspect ratio trenches.
Article Type: Original Research
Keywords: High aspect ratio, DRIE, DoE, power electronics Corresponding Author: Prof. Magali Brunet,
Corresponding Author's Institution: LAAS-CNRS, Université de Toulouse, First Author: Magali Brunet, PhD
Order of Authors: Magali Brunet, PhD; Pascal Dubreuil; Hicham Mahfoz Kotb; Aline Gouantes; Anne-Marie Dorthe
Abstract: A reliable factorial experimental design was applied to DRIE for specifically producing high aspect ratio trenches. These trenches are to be used in power electronics applications such as active devices: Deep Trench Superjunction MOSFET (DT-SJMOSFET) and passive devices: 3D integrated capacitors. Analytical expressions of the silicon etch rate, the verticality of the profiles, the selectivity of the mask and the critical loss dimension were extracted versus the process parameters. The influence of oxygen in the passivation plasma step was observed and explained. Finally, the analytical
expressions were applied to the devices objectives. A perfectly vertical trench 100 µm deep was obtained for DT-SJMOSFET. Optimum conditions for reaching high aspect ratio structures were determined in the case of high density 3D capacitors.
1
Factorial experimental design applied to DRIE for optimised
process in power electronics applications requiring high aspect
ratio trenches.
Magali Brunet
1*, Pascal Dubreuil
1, Hicham Mahfoz Kotb
1, Aline Gouantes
1and Anne-Marie
Dorthe
2.
1
LAAS-CNRS, Université de Toulouse, 7 av. du Colonel Roche, F-31077 Toulouse, France.
* email :
[email protected]
, tel : +33 5 61 33 62 21, fax : +33 5 61 33 62 08
2
ISM, ENSCPB, Université Bordeaux, 16 av. PeyBerland, F-33607, Pessac, France.
Abstract :
A reliable factorial experimental design was applied to DRIE for specifically producing high aspect ratio trenches. These trenches are to be used in power electronics applications such as active devices: Deep Trench Superjunction MOSFET (DT-SJMOSFET) and passive devices: 3D integrated capacitors. Analytical expressions of the silicon etch rate, the verticality of the profiles, the selectivity of the mask and the critical loss dimension were extracted versus the process parameters. The influence of oxygen in the passivation plasma step was observed and explained. Finally, the analytical expressions were applied to the devices objectives. A perfectly vertical trench 100 µm deep was obtained for DT-SJMOSFET. Optimum conditions for reaching high aspect ratio structures were determined in the case of high density 3D capacitors.
1. Introduction:
The patented plasma recipe called Bosch process (Laermert and Schilp 1994) is commonly used since the 90’s to produce high-rate anisotropic trench etching mainly in microsystems applications: on a silicon wafer masked with photoresist, repeated exposure to an etchant plasma (SF6) in alternation with a passivation plasma (C4F8) produces deep structures with high aspect ratios. Two applications in power electronics are considered in this paper: high density integrated 3D capacitors (Brunet et al. 2006, Benazzi et al. 2007) used as output filters in future DC-DC microconverters and DT-SJMOSFET (Théolier et al. 2007). For integrated 3D capacitors, the effective surface area of the electrodes is increased by etching deep cavities in silicon. The best aspect ratios for the smallest features are necessary to produce high capacitance density. For VDMOS, the design requires to produce trenches that are 100 µm deep with a perfect verticality to allow charge balance. The DRIE parameters should be tuned to reach respectively these two objectives. The Bosch process involves two major mechanisms: ion-assisted dry chemical etching and the deposition of a polymer inhibiting layer. During the etch cycle, the SF6 gas dissociate into neutral fluorine radicals and ions responsible for the etching of the silicon. During the passivation cycle, the C4F8 gas is ionised to produce a fluorocarbon polymer responsible for the inhibiting layer. The bias power, the pressure in the chamber, the cycle times, the gas fluxes can influences greatly the species concentration and energy and thus the silicon etch rate as well as the feature profiles. The approach consisting in understanding separately the influence of each process parameter based on the plasma physics has been broadly studied in the literature (Blauw 2004, Ayón et al. 1999) and is essential to determine a process window giving high aspect ratio structures. With this prerequisite, a tool that would model the effect of each parameter on the structures profiles as well as the parameters interactions would be of great help to tune finely the process.
This paper presents an accurate optimization of the DRIE process achieved through Design of Experiments (DoE) based on 2k factorial experimental design by Montgomery 1995, also described in (Box et al. 2005) and (Goupy 2001). This approach is not usual for plasma processes as many unknown reactions can happen in the plasma. However, the authors believe that it is the most efficient and precise way to investigate the influence of various parameters and their interactions inside a *Manuscript
reasonable process window. It reduces development costs as several parameters are studied in parallel and several objectives for various applications can be reached as demonstrated in the paper. Chen and co-workers (Chen et al. 2007) have studied DRIE features with design of experiments based on Taguchi experimental method (Taguchi 1988). However, the influence of the factors interaction can not be extracted with this method whereas it is possible with Montgomery approach employed here. Moreover, two other advantages of the factorial experimental designs method as opposed to any other experimental design (including Taguchi) are the low number of experiments required and its accuracy (Borror and Montgomery 1999). The variance of the effects (called bi) for n experiments, is
proportional to the experimental variance (s²) according to (1):
n s bi
2
var (1)
In this work, it is demonstrated that with carefully chosen limits, where factors vary linearly, it is possible to obtain predictive expressions containing the influence of parameters on the responses and their interaction. With this simple and precise approach, the two objectives could be reached, i.e. for the DT-SJMOSFET and the 3D capacitors applications.
An aspect of this work was also to study the influence of oxygen in the passivation plasma. It has been indeed proven by other research teams (Blauw 2004, Ohara 2001) that a low-pressure, high density, oxygen-plasma pulse removes the polymer passivation layer efficiently. The so-called triple process could give aspect ratio as high as 60. For a gain in process time, we chose to introduce the oxygen during the passivation plasma (C4F8 + O2).
The fractional factorial experiment design that was used is detailed in a first part. Five main factors (Bias power, pressure, etch cycle time, passivation cycle time, oxygen presence in passivation plasma) were chosen. The four responses measured were the silicon etch rate (ERSi), the verticality of the profiles (difference between the width at the top Wt and at the bottom Wb of the structures), the critical dimension loss and the mask selectivity (photoresist etch rate ERR). In a second part, the effects extracted from the factorial designs are validated by an explanation on the related physical phenomena occurring during the process. In particular, the effects of the presence of oxygen in the passivation cycles on the profiles are studied. Finally, the analytical expressions were used to reach the devices objectives (DT-SJMOSFET and high aspect ratio 3D capacitors).
2. Experimental.
Prior to silicon etching, the wafers were prepared with a double mask (photoresist and silicon oxide) as follows: the silicon wafers were first thermally oxidised. The SiO2 was 330 nm thick. Then a photoresist layer (AZ1529) was spun on for photolithography. The structures on the mask were a series of trenches, 1 mm long and with their width equal their spacing. The width of the trench was 4.2 µm after photolithography. The SiO2 layer was etched with a CF4 plasma recipe in a ICP (Inductively Coupled Plasma) system.
The etching experiments were carried out in a STS multiplex tool, that has a low pressure and high frequency ICP etch system. The STS system uses fluorine-based gases for anisotropic deep silicon trench etching. The 13.56 MHz RF system produces a high-density, low-pressure, low-energy inductively coupled plasma. Non-uniformity in etching rate usually occurs across the wafer and for different etch times: ARDE (Aspect Ratio Dependent Etching) (Gottscho and Jurgensen 1992, Coburn and Winters 1989, Blauw 2004, Yeom et al. 2003, Kiihamäki and Franssila 1999, Chung 2004) and micro-loading effect (Jensen and Hansen 2004) have been broadly studied in the literature. Although it will be necessary in future development to take into account these effects, this is not the purpose of the presented work and the studies were thus carried out always with the same mask, and with the same etching time (77 min). This time was chosen long enough to produce trenches with depth close to the targeted 100 µm for the devices application.
The thickness of the photoresist was systematically measured before DRIE process and after DRIE process with a mechanical profilometer. From these measurements, the photoresist etch rate (ERR) was calculated. After DRIE, the cross-section was observed with SEM. The depth (D), the width at the top of the structure (Wt), the width at the bottom of the structure (Wb) were measured on the SEM pictures. From these measurements, the silicon etch rate (ERSi) could be calculated, as well as the verticality of the profile: V = Wt – Wb, and the critical dimension loss (Cd loss = Wt – 4.2 µm).
3
All these measurements were necessary to reach the objectives. High aspect ratios (D/Wt) are indeed required for capacitors application. The CD loss should also be minimal as the final devices contain very dense structures. For DT-SJMOSFET applications, a depth (D) of 100 µm and perfect verticality (V = 0) were aimed at.
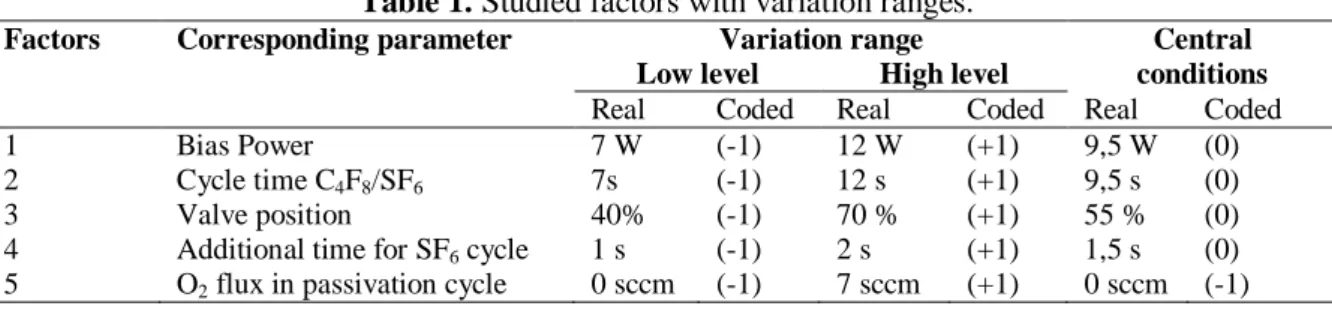
As mentioned before, five factors were considered in the factorial design. They are detailed in table 1 with their value range. Other parameters which are part of the Bosch process were kept constant. The RF coil power was 1000 W and the electrode RF power was 300 W. The C4F8 flux was kept to 85 sccm and the SF6 flux was kept to 130 sccm. The parameters ranges were carefully chosen so as to produce always deep high aspect ratio structures as well as observable response variation. In particular, in most Bosch processes (Blauw 2004, Ayón 1999), the etch cycle time is set longer than the passivation time. Here, the etch cycle (SF6) time was chosen to be minimum 1 second longer than the passivation time (C4F8). The valve position that controls the pressure in the chamber was chosen as a parameter. The corresponding pressures of SF6 gas and C4F8 gas versus the valve position are reported in figure 1. The minimum for the valve position was chosen to be 40%, when the pressure is low and the evacuation of reactive species produced by the plasma is high. For valve position lower than 40%, it was observed that the etching selectivity between the mask (photoresist) and the silicon was not assured anymore: the photoresist etch rate was too high due to physical etching with high energy ions. At a position of 70%, high pressure is present in the chamber favouring chemical etching. Central conditions were repeated several times during the study to establish an estimation of the experimental variance (s²). This variance is necessary to evaluate the influence of each factor, as explained later on.
The purpose of the work was to express the measured responses (Y) or ERSi, V, ERR and CD loss as a function of these five factors (Xi). A high and a low limit of variation are assigned for each factor. The final analytical expressions hold within the range defined by these limits. With five factors, a full study would need 32 (25) experiments to extract the influence of each factor and the interactions on the measured response.
The measured responses are expressed in polynomial form as follows (for example ERSi): Y = ERSi = b0 + b1X1 + b2X2 + b3X3 + b4X4 + b5X5 +
b12X1X2 + b13X1X3 + b14X1X4 + b15X1X5 + b23X2X3 + b24X2X4 + b25X2X5 +
b34X3X4 + b35X3X5 +
b45X4X5 + . (1) with Xi the factor level and bi linear coefficients (hereafter will be termed as effects) reflecting the influence of each factor on the responses. As usual for factorial designs, Xi are expressed in a reduced centered units form (high level = +1, low level = -1). bij are representative of the interactions between 2 factors. The influences of the interactions for more than 2 factors are considered as negligible. The experimental error is represented by .
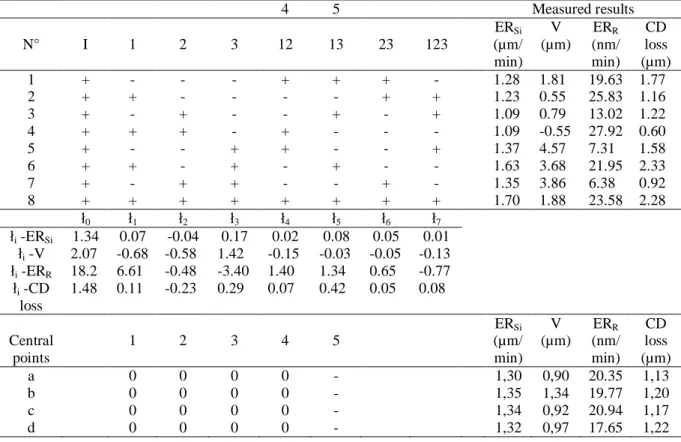
Since five factors were explored, a fractional factorial design (2k-2) with 8 experiments was built (Goupy 2001). A simple procedure involving the alias generators and contrasts was used which will reveal the effect of each factor and its interactions. The matrix of experiments with the factors levels is detailed in table 2. The factors 4 and 5 were implemented on the calculation columns 12 and 13 respectively.
The new mathematical expression is now:
Y = l0 + ł1X1 + ł 2X2 + ł 3X3 + ł 12X1X2 + ł 13X1X3 + ł 23X2X3 + ł 123X1X2X3 + (2) where łi are called the contrasts. The generators of this design are thus 124 ≡ 135 ≡ 2345.
For each experiment, the responses were measured and reported in the last four columns of table 2. As the matrix is orthogonal, the contrasts were simply calculated by a multilinear regression (algebric sum of the responses with the sign of the corresponding effect). In parallel, the experiments with central conditions were conducted (noted a to d in table 2).
Due to the fact that a fractional design was operated, the contrasts łi that were extracted are a function of several effects. With the chosen levels, the contrasts were then:
ł0 = b0 ł1= b1 + b24 + b35 ł2 = b2 + b14 ł3 = b3 + b15 ł4 = b4 + b12 ł5 = b5 + b13 ł23 = b23 + b45 ł123 = b25 + b34
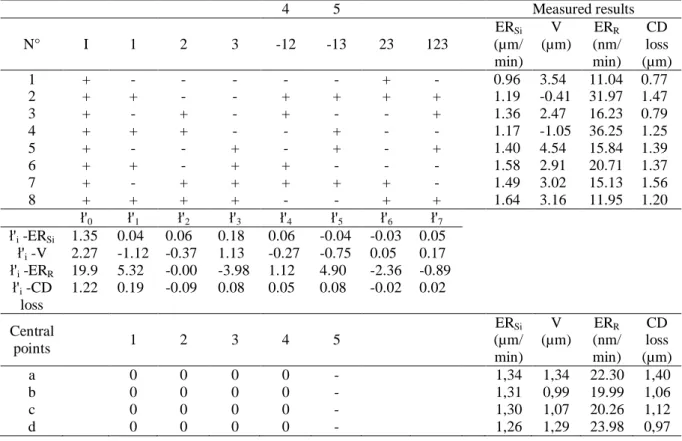
The complementary design (8 new experiments) was done with opposite generators (124 ≡ 135 ≡ -2345) in order to extract the pure effects bi of each factor and the corresponding interactions. This second matrix, which particularity is to have the column 4 and the column 5 with inverted signs, is detailed in table 3. Similarly, the experiments with central conditions (a to d) were done.
As a result, the contrasts ł'i for this new matrix were then: ł'0 = b0 ł'1 = b1 - b24 - b35 ł'2 = b2 - b14 ł'3 = b3 - b15 ł'4 = b4 - b12 ł'5 = b5 - b13 ł'23 = b23 + b45 ł'123 = - b25 - b34
It was possible to extract the effects bi and the interactions bij by simply combining the two matrices: bi = (łi + ł'i)/2
bij = (łi - ł'i)/2
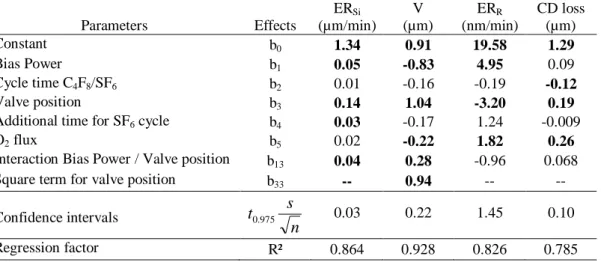
In order to complete this simple approach, the multilinear regression was also operated via MODDE software. Table 4 reports the calculated bi and bij values with MODDE that takes into account the experiments with central conditions for a more accurate calculation of the effects. R² represents the regression factor : the closer it is to one, the better the model. The confidence intervals for the effects were calculated based on a Student law and they are also reported in table 4:
n s t
bij 0.975 with n, the number of experiments.
The effects extracted from the calculations were compared to these confidence intervals and ignored if well outside the confidence intervals. The effects that were considered to influence the results are highlighted in bold in table 4 and can be reported in the analytical expressions (1).
For the verticality (V), although factorial designs are not the optimal designs for second order modelling, a square term (b33) was introduced that improves significantly the quality of the model: the R² factor increases from 0.798 to 0.928. It is thus proposed to consider as significant this second order influence of the valve position (and thus the pressure). The physical meaning of this term will be discussed in the following paragraph.
3. Discussion and validation of the factorial experimental designs.
The parameters effects extracted from the factorial experimental designs are discussed in the following. For the four responses studied (ERSi, V, ERR, CD loss), the most influent parameters extracted by the factorial experimental designs are the bias power and the valve position. In DRIE processes, the bias power and the pressure in the chamber (controlled here by the valve position) are the main parameters controlling the species produced in the plasma (neutrals and ions). And the
5
etching characteristics and the resulting profiles are closely related to the nature of the species produced in the plasma and their energy.
The pressure influences greatly the species generation in the plasma: neutral fluorine radicals versus ions. It is known that, at high source power levels (1000 W), the fluorine radical density is
proportional with the pressure. At the same time, the ion density in a continuous SF6 plasma varies
roughly inversely proportional with the square root of the pressure (Blauw 2004). In other words, when the valve is closed to an extent of 70%, the pressure in the chamber is high: a lot of radicals are present (produced by the high collision rate of neutrals) and reacts with the silicon atoms.The etching process is mainly chemical. Consequently, the process selectivity is increased: the silicon etch rate is increased (b3 for ERSi is positive) while the photoresist etch rate is reduced (b3 for ERR is negative). The downside of a high pressure is a more isotropic etching process which can produce a bigger CD loss (b3 for CD loss positive).
When the bias power is high (X1 = +1), ions produced in the plasma are accelerated towards the bottom of the trenches. As a result, the etching is more physical: the silicon etch rate, as well as the photoresist etch rate are increased. This is translated by b1 for ERSi and ERR being positive.
The efficiency of physical etching is mainly due to the energy (or mean length path) acquired by the ions and their presence in the plasma. Although the bias power is necessary for accelerating the ions towards the substrate, it is known that the number of ions and their mean length path depends on the pressure. At high pressure, the ions have a smaller mean length path and will recombine quickly inducing then a lower efficiency on the physical etching.
This double influence of the bias power and the pressure is translated by an interaction effect (effects b13) on the silicon etch rate.
To obtain perfect verticality, V should be equal to zero. It requires thus an optimisation of the parameters rather than a maximisation or minimisation.
The verticality is influenced by the impact of the ion angular distribution, which depends on the
pressure and the bias. At high pressure (X3 = + 1 with b3 positive), the angle is wide and leads to
isotropic etching because of the divergence of the ions collisions with the sidewalls. Sidewalls collisions cause erosion of the sidewall passivation layer and reduce the ion flux to the bottom of the
trench and leads to a stronger lateral etch (loss of verticality) and the critical dimension increases (b3
for CD loss positive).
If the bias power is high, the verticality is enhanced (X1 = +1 with b1 negative). Again, the interaction
between bias power and pressure is present in the verticality equation and can be explained as follows: at high pressure and high power, although the ions are accelerated, it is not enough for compensating the chemical etching (isotropic) induced by radicals which are the more numerous.
The best option for verticality is to work at low pressure, when the angular distribution is small and the ions/radicals ratio is small.
It was observed during the experiments that at high pressure, there was a strong accumulation of passivants (CF2) at the bottom of the trenches that induced a very bad verticality. The square term (b33) that was introduced in the model takes then into account this acceleration of trench closing at high pressure.
The influence of the cycle time (b2) and the additional time for SF6 plasma (b4) is less pronounced in the responses measured. The former one is influent in the CD loss. It is explained by the fact that when cycle time is at the high level, the SF6 etching process doesn’t compensate anymore the passivation on the sidewalls. As a result, due to an accumulation of passivant CF2, the CD loss is reduced (effect b2 negative).
For the additional time of SF6, it is understood that when it is at the high level (+2 sec), the etching process at the bottom of the trenches is more effective: the resulting silicon etch rate is increased (effect b4 positive).
The effect of parameter 5 (presence of oxygen in passivation plasma) is discussed in the next section. 4. Oxygen in passivation cycle.
It is interesting to note that parameter 5 (presence of O2) influences the following results: verticality, photoresist etch rate and CD loss. Additional experiments were conducted from the central conditions
(see table 1) and by varying the oxygen flux in the passivation plasma: 0 sccm, 3.5 sccm and 7 sccm of O2. Figure 2 reports the experimental and predicted results for this varying oxygen flux.
As expected from the factorial design results, the presence of oxygen in the passivation plasma has no influence on the silicon etch rate (figure 1a). However, there is an influence of oxygen on the verticality (figure 1b). It is believed that the oxygen increases the etch rate of CF2 during the passivation cycle. When no oxygen is present, the profiles are positive, i.e. the bottom width is smaller than the top width. If oxygen is introduced in the process, the CF2 layer becomes thinner. As a result, the width at the bottom of the trenches increases and the verticality is improved.
As expected, the more oxygen present in the passivation plasma, the more the photoresist mask is etched (figure 1c). This problem of loss in selectivity could be overcome by using another type of mask: SiO2 for instance. On this graph, although the trend is similar between the calculation and the experiments, the calculations underestimate the photoresist etch rate. This difference comes from the difficulty to detect the photoresist/SiO2 interface. In some experiments, the photoresist could have been completely etched before the end of the 77 min and not detected. This problem will be resolved in the future by installing on the STS equipment an end-point detection system such as an Optical Emission Spectrometer. The same observation is done on figure 1.d): the CD loss is overestimated. The difference between the calculations and the experiments comes from the difficulty to control perfectly the photolithography step: the initial width after photolithography depends greatly on temperature, hygrometry, photoresist age. Clearly, the more oxygen is present in the chamber, the thinner the passivation layer on the walls: the lateral etch rate is thus more important.
As a result, oxygen in passivation plasma can be an interesting parameter for adjusting the profiles verticality.
5. Application to devices objectives:
For DT-SJMOSFET, as mentioned before, it is necessary to produce 100 µm deep structures with perfect verticality. The parameters were thus chosen thanks to the analytical expressions. In order to reach 100 µm, the power was set to 11.5 W. To adjust the verticality, it was then necessary to set the valve position at 53% and the cycles at long times. Figure 3 shows the resulting profiles. The depth was 101 µm. The width was 5 µm at the top and also at the bottom of the trench, giving thus a perfectly vertical profile.
For 3D capacitors, the objectives are to reach the best aspect ratios: this means that for the mask studied, the trench should be as deep as possible with the smallest CD loss. The analytical expressions were used in order to set the following conditions: a high bias power (12 W), long cycle times, high pressure (65%). On figure 4, the obtained structures were 111 µm deep, for 4.7 µm large, leading to an aspect ratio of 23.6. It has to be noted that for these conditions, the photoresist etch rate was 12.6 nm/min. Such a low etch rate will allow to reach deeper structures by extending the etching time and thus high aspect ratios.
6. Conclusions.
In this work, factorial experimental designs were conducted with five DRIE parameters: bias power, pressure, passivation cycle time, etching cycle time and presence of oxygen in passivation plasma. The objective was to produce a controlled and optimized Bosch process: analytical expressions were obtained that gave the silicon etch rate, the verticality, the mask etch rate, the CD loss, as a function of the above mentioned parameters in a reasonable process window. Through these experiments, the effect of introducing oxygen in the passivation plasma was studied: it appears as an additional parameter to adjust verticality, useful if the mask is not made out of photoresist.
Finally, thanks to the analytical expressions, the objective of 100 µm deep structures with perfect verticality for DT-SJMOSFET applications was reached. In parallel, a process that could lead to high aspect ratio for high density 3D capacitors was defined. To conclude, fractional factorial design is an
7
approach adapted to DRIE processes and helpful for the realization of optimized structures in power electronics applications.
Acknowledgments.
This work was done on the technological platform of LAAS, and funded by ANR research program ANR-06-JCJC-0081.
References.
Ayón AA, Braff R, Lin CC, Sawin HH and Schmidt MA (1999), Characterization of a time multiplexed inductively coupled plasma etcher, Journal of the Electrochemical Society, 146, vol 1: 339-349.
Benazzi A, Brunet M, Dubreuil P, Mauran N, Bary L, Laur J-P, Sanchez J-L, Isoird K (2007), Performance of 3D capacitors integrated on silicon for DC-DC converter applications, European Conf. on Power Electronics and Applications.
Blauw MA (2004), Deep anisotropic dry etching of silicon microstructures by high-density plasmas, PhD Thesis, Delft University of Technology.
Box GEP, Hunter JS, Hunter WG (2005), Statistics for experimenters, Wileys series in probability and statistics, Second edition.
Brunet M, Dubreuil P, Scheid E, Sanchez J-L (2006), Development of fabrication techniques for high-density integrated MIM capacitors in power conversion equipment, Micromachining and Microfabrication Process Technology XI, part of the SPIE MOEMS-MEMS Symp., Photonics West.
Chen SC, Lin YC, Wu JC, Horng L, Cheng CH (2007), Parameter optimization for an ICP deep silicon etching system, Microsyst. Technol., 13: 465-474.
Coburn JW and Winters HF (1989), Conductance considerations in the reactive ion etching of high aspect ratio features, Applied Physics Letters, 55 (26): 2730-2732.
Gottscho RA and Jurgensen CW (1992), Microscopic uniformity in plasma etching, Journal of Vacuum Science Technology B, 10(5): 2133-2147.
Goupy J (2001), Introduction aux plans d’expériences – Optimisation du choix des essais et de l’interprétation, Duno. Chung C-K (2004), Geometrical pattern effect on silicon deep etching by an inductively coupled plasma system, J. Micromech. and Microeng., 14: 656-662.
Jensen S and Hansen O (2004), Characterization of the microloading effect in deep reactive ion etching of silicon, Proc. SPIE-Int. Soc. Opt. Eng. 5342: 111-118.
Kiihamäki J and Franssila, S, Pattern shape effects and artefacts in deep silicon etching, 1999, J. Vacuum Science and Technology, A 17(4), pp. 2280–2285.
Laermer F and Schilp A (1994), Method of anisotropically etching silicon, US Patent 5,501,893. Montgomery DC (1995), Design and analysis of experiments, John Wiley and Sons, US, third edition.
Ohara J, Kano K, Takeuchi Y and Otsuka Y (2001), Improvement of Si/SiO2 mask etching selectivity in the new D-RIE process, Proc. of the 14th IEEE Annual Intern. Conf. on Microelectromechanical Systems, New York. USA: 76-79. Taguchi G (1988), Introduction to quality engineering: designing quality into products and processes, Asian Productivity Organisation, Japan.
Théolier L, Isoird K, Morancho F, Roig J, Mahfoz Kotb H, Brunet M, Dubreuil P (2007), Deep Trench MOSFET structures study for 1200 Volts applications, Proc. European Conf. on Power Electronics (Denmark).
Yeom J, Wu Y, Shannon M A (2003), Critical aspect ratio dependence in deep reactive ion etching of silicon, Transducers’03, Boston, 2: 1631-1634.
Figures and tables captions.
Figure 1. Pressure of SF6 and C4F8 gas in the chamber versus the valve position. Table 1. Studied factors with variation ranges.
Table 2. Matrix 1 with factors levels, measured results ERSi, V, ERR, CD loss and contrasts calculations. Experiments with central conditions (a to d) are also reported.
Table 3. Matrix 2 with factors levels, measured results ERSi, V, ERR, CD loss and contrasts calculations. Experiments with central conditions (a to d) are also reported.
Table 4. MODDE calculated effects bi and bij from matrix 1 and matrix 2 with corresponding confidence intervals and regression factor.
Figure 2. Calculated and experimental results for a) silicon etch rate (ERSi), b) verticality (V), c) photoresist etch rate (ERR), d) CD loss versus the oxygen flux.
Figure 3. SEM pictures of a) cross-section; close-up views on b) the top and c)the bottom of the trenches for the following conditions: 11.5 W, C4F8: 10.5 sec; SF6: 12.5 sec, 53% no O2.
Figure 4. SEM pictures of a) cross-section; close-up views on b) the top and c)the bottom of the trenches for the following conditions: 12 W; C4F8: 12s; SF6 : 14 s; 65%; 0 sccm 02
A reliable factorial experimental design was applied to DRIE for specifically producing high aspect ratio trenches. These trenches are to be used in power electronics applications such as active devices: Deep Trench Superjunction MOSFET (DT-SJMOSFET) and passive devices: 3D integrated capacitors. Analytical expressions of the silicon etch rate, the verticality of the profiles, the selectivity of the mask and the critical loss dimension were extracted versus the process parameters. The influence of oxygen in the passivation plasma step was observed and explained. Finally, the analytical expressions were applied to the devices objectives. A perfectly vertical trench 100 µm deep was obtained for DT-SJMOSFET. Optimum conditions for reaching high aspect ratio structures were determined in the case of high density 3D capacitors.
abstract
line figure
Table 1. Studied factors with variation ranges.
Factors Corresponding parameter Variation range Central conditions Low level High level
Real Coded Real Coded Real Coded
1 Bias Power 7 W (-1) 12 W (+1) 9,5 W (0)
2 Cycle time C4F8/SF6 7s (-1) 12 s (+1) 9,5 s (0)
3 Valve position 40% (-1) 70 % (+1) 55 % (0)
4 Additional time for SF6 cycle 1 s (-1) 2 s (+1) 1,5 s (0)
5 O2 flux in passivation cycle 0 sccm (-1) 7 sccm (+1) 0 sccm (-1)
table
Table 2. Matrix 1 with factors levels, measured results ERSi, V, ERR, CD loss and contrasts calculations. Experiments with central conditions (a to d) are also reported.
4 5 Measured results N° I 1 2 3 12 13 23 123 ERSi (µm/ min) V (µm) ERR (nm/ min) CD loss (µm) 1 + - - - + + + - 1.28 1.81 19.63 1.77 2 + + - - - - + + 1.23 0.55 25.83 1.16 3 + - + - - + - + 1.09 0.79 13.02 1.22 4 + + + - + - - - 1.09 -0.55 27.92 0.60 5 + - - + + - - + 1.37 4.57 7.31 1.58 6 + + - + - + - - 1.63 3.68 21.95 2.33 7 + - + + - - + - 1.35 3.86 6.38 0.92 8 + + + + + + + + 1.70 1.88 23.58 2.28 ł0 ł1 ł2 ł3 ł4 ł5 ł6 ł7 łi -ERSi 1.34 0.07 -0.04 0.17 0.02 0.08 0.05 0.01 łi -V 2.07 -0.68 -0.58 1.42 -0.15 -0.03 -0.05 -0.13 łi -ERR 18.2 6.61 -0.48 -3.40 1.40 1.34 0.65 -0.77 łi -CD loss 1.48 0.11 -0.23 0.29 0.07 0.42 0.05 0.08 Central points 1 2 3 4 5 ERSi (µm/ min) V (µm) ERR (nm/ min) CD loss (µm) a 0 0 0 0 - 1,30 0,90 20.35 1,13 b 0 0 0 0 - 1,35 1,34 19.77 1,20 c 0 0 0 0 - 1,34 0,92 20.94 1,17 d 0 0 0 0 - 1,32 0,97 17.65 1,22 table
Table 3. Matrix 2 with factors levels, measured results ERSi, V, ERR, CD loss and contrasts calculations. Experiments with central conditions (a to d) are also reported.
4 5 Measured results N° I 1 2 3 -12 -13 23 123 ERSi (µm/ min) V (µm) ERR (nm/ min) CD loss (µm) 1 + - - - + - 0.96 3.54 11.04 0.77 2 + + - - + + + + 1.19 -0.41 31.97 1.47 3 + - + - + - - + 1.36 2.47 16.23 0.79 4 + + + - - + - - 1.17 -1.05 36.25 1.25 5 + - - + - + - + 1.40 4.54 15.84 1.39 6 + + - + + - - - 1.58 2.91 20.71 1.37 7 + - + + + + + - 1.49 3.02 15.13 1.56 8 + + + + - - + + 1.64 3.16 11.95 1.20 ł'0 ł'1 ł'2 ł'3 ł'4 ł'5 ł'6 ł'7 ł'i -ERSi 1.35 0.04 0.06 0.18 0.06 -0.04 -0.03 0.05 ł'i -V 2.27 -1.12 -0.37 1.13 -0.27 -0.75 0.05 0.17 ł'i -ERR 19.9 5.32 -0.00 -3.98 1.12 4.90 -2.36 -0.89 ł'i -CD loss 1.22 0.19 -0.09 0.08 0.05 0.08 -0.02 0.02 Central points 1 2 3 4 5 ERSi (µm/ min) V (µm) ERR (nm/ min) CD loss (µm) a 0 0 0 0 - 1,34 1,34 22.30 1,40 b 0 0 0 0 - 1,31 0,99 19.99 1,06 c 0 0 0 0 - 1,30 1,07 20.26 1,12 d 0 0 0 0 - 1,26 1,29 23.98 0,97 table
Table 4. MODDE calculated effects bi and bij from matrix 1 and matrix 2 with corresponding confidence intervals and regression factor.
Parameters Effects ERSi (µm/min) V (µm) ERR (nm/min) CD loss (µm) Constant b0 1.34 0.91 19.58 1.29 Bias Power b1 0.05 -0.83 4.95 0.09 Cycle time C4F8/SF6 b2 0.01 -0.16 -0.19 -0.12 Valve position b3 0.14 1.04 -3.20 0.19
Additional time for SF6 cycle b4 0.03 -0.17 1.24 -0.009
O2 flux b5 0.02 -0.22 1.82 0.26
Interaction Bias Power / Valve position b13 0.04 0.28 -0.96 0.068
Square term for valve position b33 -- 0.94 -- --
Confidence intervals n s t0.975 0.03 0.22 1.45 0.10 Regression factor R² 0.864 0.928 0.826 0.785 table
line figure
line figure
line figure
line figure
colour figure
colour figure
colour figure
colour figure
colour figure
colour figure