Small-Angle X-ray Scattering and Small-Angle Neutron Scattering
Studies of Liquid-Crystalline Halato(semi)telechelic Polymers
SOBRY ROGERA,VAN DEN BOSSCHE GUYA,FONTAINEFREDERICA,GOHY JEAN-FRANÇOISB AND
JEROMEROBERTB
aInstitute of Physics, University of Liège, B5, B4000 Liège, Belgium, and bCERM, University of Liège, B6, B4000 Liège, Belgium.
Abstract
Model liquid-crystalline ionomers have been synthesized, which consist of low molecular weight (700-49000) linear ω- and α,ω-sodium sulfonate- and carboxylato-poly(styrenes or isoprenes) selectively end-capped at one or both end(s) with an ionic mesogenic group. These compounds are referred to as liquid-crystalline halato(semi)telechelic polymers [LC H(S)TPs] A combination of small-angle X-ray scattering and small-angle neutron scattering studies on these LC H(S)TPs clearly shows the usual ionic peak related to interparticle interference between the ionic aggregates and a peak which can be related to the organization of a smectic mesophase. This mesogenic peak is generally masked by the foot of the broad ionic peak. The ionic peak Bragg spacing is much larger in the LC H(S)TP than in the H(S)TP precursor; This increased interaggregate distance results from the hindrance due to the
mesogenic organization and from the restricted mobility experienced by the chains closely attached to the mesogen layers. As a rule, the lower the glass transition temperature of the polymeric matrix, the better the definition of the ionic peak, The ionic peak is well defined as long as the temperature is lower than the temperature of transition from solid to smectic phase (32.3 K). At higher temperatures, the ionic peak intensity decreases with increasing temperature.
1. Introduction
Over the last 30 years, a considerable amount of research has been devoted to random ionomers because of their unique mechanical, rheological and transport properties (see, for instance, MacKnight & Earnest, 1981; Pinéri & Eisenberg, 1987; Eisenberg & Bailey, 1986). Although a lot of experimental and theoretical work has focused on the structure of ionomers, the details of their phase morphology are still debated.
A better understanding of ionomer morphology has resulted from the study of halato(semi)telechelic polymers [H(S)TPs], which are linear polymer chains selectively end-capped at one or both end(s) by an ionic group. Their well controlled molecular parameters and well defined molecular architecture make them very useful models for the more complex ionomers. Extensive studies of these model compounds have allowed identification of the key parameters that control the phase morphology (Williams, Russell, Jerome & Horrion, 1986; Jérôme, 1989). From these studies, the following
conclusions have been drawn: the ionic microdomains, known as 'multiplets', are small; their
dimensions, of the order of 6-9 Ǻ, do not depend much on the nature of the metallic cation; and contain up to circa ten ion pairs. The average distance between the domains is determined by the molecular weight of the polymer chain.
In contrast to metallic counterions, mesogenic ones are able to organize themselves to form ordered structures Thus, substituting the metallic counterions of H(S)TPs for a liquid-crystalline one should dramatically affect the phase morphology. These model compounds, referred to as liquid-crystalline halato(semi)telechelic polymers [LC H(S)TPs], are thus ideal candidates for morphological studies of liquid-crystalline ionomers.
In this paper, we present small-angle X-ray scattering (SAXS) and small-angle neutron scattering (SANS) results obtained on a series of LC H(S)TPs consisting of low-molecular-weight polystyrene and polyisoprene chains end-capped with sulfonate or carboxylate groups associated with a mesogenic cation.
2. Experimental 2.1 Synthesis method
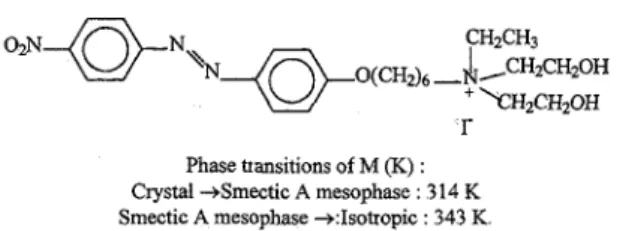
The ionic mesogenic M was prepared according to the procedure of Ujiie & Iimura (1992). The structure and properties of M are presented in Fig. 1 ω- and α,ω-sulfonato- and
carboxylatoρolystyrenes (PS) and -polyisoprenes (PI) were synthesized by living anionic
polymerization, as described by Broze, Jérôme & Teyssie (1982) and Register, Cooper, Thyagarajan, Chakrapani & Jérôme (1990).
LC H(S)TPs were obtained by ion-exchange reaction between the metallic counterions of the H(S)TPs and the ionic mesogenic M.
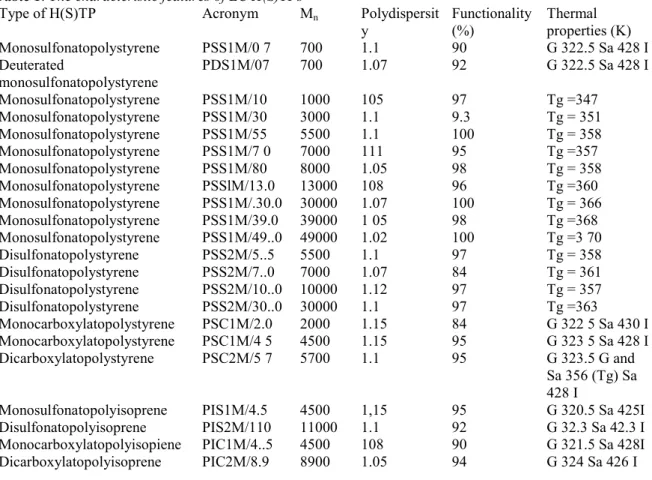
Table 1. The characteristic features of LC H(S)TPs
Type of H(S)TP Acronym Mn Polydispersit
y Functionality (%) Thermal properties (K) Monosulfonatopolystyrene PSS1M/0 7 700 1.1 90 G 322.5 Sa 428 I Deuterated monosulfonatopolystyrene PDS1M/07 700 1.07 92 G 322.5 Sa 428 I Monosulfonatopolystyrene PSS1M/10 1000 105 97 Tg =347 Monosulfonatopolystyrene PSS1M/30 3000 1.1 9.3 Tg = 351 Monosulfonatopolystyrene PSS1M/55 5500 1.1 100 Tg = 358 Monosulfonatopolystyrene PSS1M/7 0 7000 111 95 Tg =357 Monosulfonatopolystyrene PSS1M/80 8000 1.05 98 Tg = 358 Monosulfonatopolystyrene PSSlM/13.0 13000 108 96 Tg =360 Monosulfonatopolystyrene PSS1M/.30.0 30000 1.07 100 Tg = 366 Monosulfonatopolystyrene PSS1M/39.0 39000 1 05 98 Tg =368 Monosulfonatopolystyrene PSS1M/49..0 49000 1.02 100 Tg =3 70 Disulfonatopolystyrene PSS2M/5..5 5500 1.1 97 Tg = 358 Disulfonatopolystyrene PSS2M/7..0 7000 1.07 84 Tg = 361 Disulfonatopolystyrene PSS2M/10..0 10000 1.12 97 Tg = 357 Disulfonatopolystyrene PSS2M/30..0 30000 1.1 97 Tg =363 Monocarboxylatopolystyrene PSC1M/2.0 2000 1.15 84 G 322 5 Sa 430 I Monocarboxylatopolystyrene PSC1M/4 5 4500 1.15 95 G 323 5 Sa 428 I Dicarboxylatopolystyrene PSC2M/5 7 5700 1.1 95 G 323.5 G and Sa 356 (Tg) Sa 428 I
Monosulfonatopolyisoprene PIS1M/4.5 4500 1,15 95 G 320.5 Sa 425I
Disulfonatopolyisoprene PIS2M/110 11000 1.1 92 G 32.3 Sa 42.3 I
Monocarboxylatopolyisopiene PIC1M/4..5 4500 108 90 G 321.5 Sa 428I
Dicarboxylatopolyisoprene PIC2M/8.9 8900 1.05 94 G 324 Sa 426 I
Thermal properties are noted as follows: Tg glass transition; G glassy state; Sa smectic A mesophase; I isotropic state (temperatures in K).
The structure, properties and molecular characteristics of all the samples considered in this study are summarized in Table 1. The polymer chains (PS, PI) bear one (1, HSTP) or two (2, HTP) sulfonate (S) or carboxylate (C) ions which are neutralized by the mesogenic ions (M). The notations of Table 1 also include the molecular weight Mn. For example, PSS2M/ 5.5 corresponds to a polystyrene chain of molecular weight 5500 bearing at both ends a sulfonate ion neutralized by a mesogenic ion. Some of these LC H(S)TPs show smectic mesophases in a large temperature range. The liquid-crystalline properties of these compounds have been described in a previous publication (Gohy, Vanhoorne & Jerome, 1996).
2.2. SAXS measurements
The SAXS intensity was registered with both a Kratky compact camera at the Laboratory of Experimental Physics of the University of Liege (Belgium) and the D22 and D24 beamlines of the LURE-DCI Synchrotron Radiation Source at Orsay (France). The sample-detector distance d, wavelength λ and scattering vector s = 2sinθ/λ. ranges were as follows: Kratky camera d = 200 mm, λ = 1.5418 A and 0.005 nm-1 < s < 1 nm-1; D22 line d = 942 mm, λ = 1.3774 A and 0.015 nm-1 < s <
0.35 nm-1; D24 line d = 1975 mm, λ = 1.488 Å and 0.005 nm-1 < s < 0.25 nm-1.
The Kratky compact camera was equipped with a classical stabilized X-ray generator and the scattered intensity was registered with an Xe-filled high-effieiency Philips counter. It was generally measured in the fixed-time mode with a sampling time of 200 s per step but, on very small angles where the intensity was high enough, the fixed-count mode was used at a rate of 100000 counts per step. Absorption, sample thickness, parasitic scattering and electronic noise were taken into account in the standard manner. The number of steps was usually of the order of 3.30 for each sample. The entrance and detector slits were adjusted to 100 and 250 µm, respectively. However, in order to approach as closely as possible the origin of the angles, the first part of the curve was also registered with entrance and detector slits adjusted to 35 and 90 µm, respectively, and then multiplied by an adequate scaling factor to bring the registered values to the intensity level of the main curve. After scaling, the two curves were merged. The SAXS curves were registered in the finite-slit approach. We used the Vonk (1971) desmearing procedure and an original method reported by Sobry, Rassel, Fontaine, Ledent & Liégeois (1991). The two methods give the same results except for the beginning and the extreme ends of the curve.
Fig 1. The structure and properties of the ionic mesogen M. 2.3.. SANS measurements
The SANS experiments were performed with the spectrometer PACE in the reactor Orphée at the Laboratoire Leon Brillouin (CEA-CNRS), Saclay, France. The incident wavelength λ, isolated by a mechanical selector, was 0.5 nm ± 10%. The s range of the collimated beam was 0.04-0.45 nm-1. The 'raw intensity', Ir(s, T), was corrected in a standard manner for the scattering from the empty cell walls and scaled as I'(s, T) by the scattering cross section of 1 mm of water. This corrected and scaled I'(s, T) still comprised the incoherent background scattering. The background scattered intensity Ib(s, T) was thus subtracted from I'(s, T) to give the final I(s, T) value. Polystyrene was used to estimate the Ib(s, T) value.
Blends of deuterated and hydrogenated samples were prepared by solvent-casting tetrahydrofuran solutions of the PSSlM/0,7 and PDS1M/0.7 samples.
The PDS1M/0 7 sample was exchanged with different amounts of ionic mesogen. The resulting samples are referred to as PDS1M/0 .7 X % where X stands for the molar percentage of mesogen compared with the sulfonate end-groups available.
3. Results and discussion
3.1. Ionic peak and molecular weight
The main characteristic feature of the SAXS and SANS patterns of the H(S)TPs is the so-called 'ionic peak'. The origin of this peak is still under debate and is attributed to either interparticle interferences (Yarusso & Cooper, 1983) or the internal structure of ionic particles, i.e. to intraparticle interferences (MacKnight, Taggart & Stein, 1974; Fujimura, Hashimoto & Kawai, 1982). According to the recently revised multiplet-chister concept by Eisenberg, Hird & Moore (1990), the 'ionomer' peak would arise from an intermultiplet distance within the clusters.
Fig 2 The effect of molecular weight on the position of the ionic peak in PSS1M samples (each curve is indexed by the corresponding 10-3 M„) SAXS intensity has been multiplied by an adequate factor to avoid overlapping of the successive curves. This is generally true for all the curves reported in the following figures
In the present case, the ionic aggregates are expected to result from the dipolar association of a small number of mesogenic ions. The ionic peak position sIP is related to the mean distance between two aggregates. The characteristic distance, dIP, results from Bragg law dIP = 1/SIP.
Most of the samples investigated (see Table 1) consist of polystyrene chains of various molecular weights end-capped at one end (HSTP) with a sulfonate group and a mesogenic ion. Fig. 2 shows the observed SAXS intensity of these monosulfonatopolystyrenes in the range 0.01-04 nm-1.. All samples with Mn less than 10 000 show a peak in the range from 0.10 to 0.16 nm-1. The greater the molecular weight, the smaller the s position and the intensity of this peak. This latter observation qualitatively agrees with previous results in the case of sulfonatopolyisoprenes neutralized with a metallic cation X (monovalent or divalent) where dIP is proportional to the square root of the molecular weight (Mn)1/2 (Sobry, Fontaine, Ledent, Foucart & Jerome, 1998) In other words, the characteristic distance between the aggregates increases with the polymer chain length, More precisely, in the PIS2X, dIP is
approximately equal to the root mean square end-to-end distance [(r0)2]1/2 and is of the order of 6-10 nm, According to these results, the PSS1M peak observed in the range 0.1-0,16 nm-1 must be regarded as the ionic peak. In the PSSlM/13.0 sample, the ionic peak is observed around 0.08 nm-1, while, in the PSS1M/30 0 sample, a careful examination of the scattered intensity shows a weak peak in the upturn of the curve at nearly 0,03 nm-1, The two highest molecular weight samples (PSS1M/39.0 and PSS1M/ 49,0) do not show the ionic peak, which is probably rejected towards small angles, beyond the
investigated wavenumber range, The actual dependence of dIP/(Mn)1/2 on (Mn)1/2 exhibits a parabolic shape (Fig, 3). Obviously, the ionic peak position in LC HSTP does not agree with the constancy of dIP/(Mn)1/2 and the usually observed ionic peak positions in the polyisopiene or polystyrene samples.
squares refer to the left and right axis, respectively Assuming an error of 0.1 nm on dIP, the final error on dIP/(Mn)1/2 is negligible except for the lowest Mn sample where it is of the order of 0, 02 nm The actual dependence of dIP/(Mn) on (Mn)1/2 can be fitted as
dIP/(Mn)1/2 = 0.35 - 5.5 x 10⁻³(Mn)1/2 + 2..9 x 10-5Mn. (1)
dIP/(Mn)1/2 is nearly constant in the region of the minimum of the parabola, i.e. for (Mn)1/2 ranging from 50 to 120. This region corresponds to molecular weights greater than 2500 and less than 15 000. This is effectively the range of the molecular weights of the previously investigated PIS2Xs. In the present study, which for the first time investigates samples of low and high molecular weight, the relation of proportionality between dIP and (Mn)1/2 is only verified in an intermediate range of molecular weight.
In the case of the PIS2X samples, the observed value of dIP/(Mn)1/2 is of the order of 0.074. For the PSS1M samples, the minimum of the parabola is now observed for dIP/(Mn)1/2 = 0.083. Previous studies have shown that (Mn)1/2= 12„9[(r0)2]1/2 in the case of polyisoprene while (Mn)1/2 = 14 6[(r0)2]1/2 in the case of polystyrene (see, for example, Young & Lovell, 1991). As a result, dIP is of the older of [(r0)2]1/2 (129 x 0.074 ≈ 1) in the PIS2Xs while the minimum dIP value is nearly equal to 1,2[(r0)2]1/2 (14.6 x 0.083 ≈ 1.2) in the PSSlMs. Therefore, in the PSSlMs, the polymer chain would be in an extended conformation. In a previous paper (Gohy, Vanhoome & Jerome, 1996), it was suggested that the mesogen sulfonate multiplets were at the origin of a restriction of mobility which might induce a local extension of the neighbouring polymer chain. The strength of the anchoring of the ion pair in the multiplets is of course a determining factor in the restriction of mobility. In this respect, strong electrostatic interactions are operative between sulfonate and mesogenic ions and are at the origin of an important restriction of mobility which could also explain the lack of liquid-crystalline properties in most of the PSS samples.
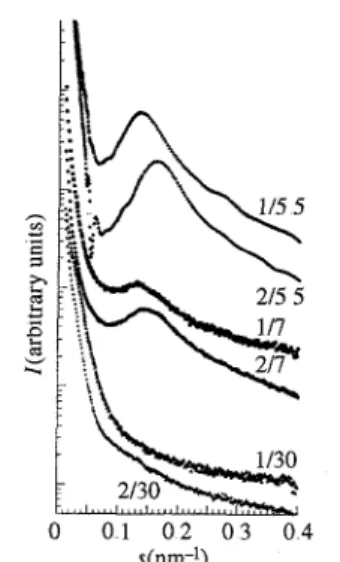
Fig. 4 The effect of the functionality on the position of the ionic peak of PSS samples
The difference between PIS2X and PSS1M samples may be due to three factors: the monofunctionality of the PSS1M chains while the PIS2X chains are difunctional, the nature of the polymer chain and the nature of the cation, metallic or mesogen. Fig. 4 shows an interesting comparison between mono- and difunctional sulfonato-polystyrenes neutralized with the mesogenic counterion. At the same molecular weight, dIP is always 15-20% smaller in the difunctional sulfonatopolystyrenes than in the
monofunctional analogues. The dIP values are 7.36, 7.76 and 47.2 nm, respectively, in the PSS1M samples of Mn 5500, 7000 and 30000 while the corresponding dIP values for the PSS2M samples of the same Mn are 6 09, 6.75 and 40.5 nm, respectively, Fig. 5 shows a comparison between PS and PI in the case of mono- and difunctional chains. The differences between the Mn are too small to explain the
systematic observation of a greater dIP in the Pis (7.57 and 8.48 nm) relative to the PSs (6 44 and 6.83 nm). These experimental observations suggest that, all other conditions being constant, polyisoprene chains yield a greater dIP than the corresponding polystyrene, whatever the functionality of the chain. In all cases, dIP is greater than the observed value for the PIS2Xs. Combining all the previous results shows that the greater distance between the ionic aggregates in the present study results from the replacement of the metallic cations, as previously investigated, by the mesogenic cation. The layer spacing of the mesogenic cation can be valued at about 3.2 nm, in agreement with the data published by Ujiie & Iimura (1992) on the same pure mesogenic ion analysed by wide-angle X-ray scattering.
Fig 5 A comparison of the SAXS intensity of mono- and difunctional polystyrene and polyisoprene samples.
Therefore, the distance between two neighbouring aggregates cannot be smaller than 3.2 nm, In this context, the second curve in Fig. 3 shows that by considering (dIP. - 5.5 nm) rather than dIP the constancy of (dIP - 5.5)/(Mn)1/2 with (Mn)l/2 is restored for Mn < 15 000 and the following relation is applicable: dIP = 5.5 + 0.023(Mn)1/2 Then, dIP seems to result from two contributions: the length of the polystyrene chain and the length of the mesogenic ion and the 'connecting groups', which are part of the polystyrene chain (see Fig. 6). Furthermore, it is possible that the strong upturn observed at high values of Mn in Fig. 3 may be related to a phase transition. However, we do not have any other experimental evidence of such a transition.
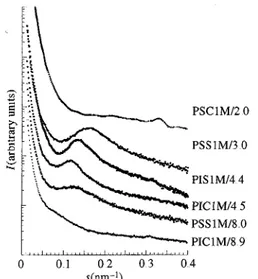
Fig. 7 shows the comparison between carboxylato- and sulfonato-LC HSTPs. Firstly, the intensity of the ionic peak is significantly less in the carboxylate samples than in the sulfonate ones. Moreover, depending on the sample, the ionic peak is not always observed. The more surprising result is that the ionic peak in the carboxylate is associated with a greater distance between the ionic aggregates when compared with that in the sulfonate samples.
Fig. 6 A model proposed for the supramolecular organization of PSS1M samples of Mn < 15 000 dMT is the thickness of the mesogenic core
Fig . 7 The effect of the sulfonate or carboxylate end group on the SAXS curve
In the PIC2Xs previously studied, this distance is smaller in catboxylates {0.71[(r0)2]1/2} than in sulfonates {[(r0)2]1/2}.
The dependence of dIP/(Mn)1/2 on (Mn)1/2 for the higher Mn prompts another question. At high M„, the ionic peak is rejected in the upturn of the SAXS curve. In polytertiobutylacrylates HTPs of molecular weight 21 000 neutralized with Na, Ba, Ca or Mg, a series of peaks of weak intensity has been detected at very small angles (Fontaine et al, 1993). This series is consistent with a hexagonal organization. Up to now, this organization has been regarded as the signature of a hyperstructure. However, the observation of the important shift of the ionic peak towards small angles when M„ increases suggests the possibility of assigning the first peak of the series to the ionic peak. In
polytertiobutyl-acrylate HTPs, the mobility of the chain is more restricted than in polystyrene HSTPs and it would not be surprising to observe a supplementary shift of the ionic peak towards small angles because of the restricted mobility of the polymer chains. The observed distance for the first peak of the series is of the order of 66 nm while interpolation of the above parabolic relation (Mn = 21 000), in the case of the PSS1Ms, yields a dIP value of the order of 22 nm.
Fig. 8. The SANS intensity of blends of PSS1M/0.7 and PDS1M/0.7. The weight percentage of PSS1M/0 7 in the blend is noted at the extremity of the corresponding curve SANS of PSS1M/0.7 and PDS1M/0. 7 at 333 K are also reported.
3.2. Mesogenic peak
In the SAXS curve of PSS1M/0.7 presented in Fig. 2, two distinct peaks are observed around 0.16 and 0.32 nm-1.
The first peak is assigned to the ionic peak, as previously discussed. In order to understand the origin of the second peak, SANS investigations were conducted on a hydrogenated polystyrene sample
(PSS1M/0. 7 or H sample) and a deuterated polystyrene sample (PDS1M/ 0 .7 or D sample). The results are presented in Figs. 8 and 9. In Fig. 8, the scattered intensity resulting from various mixtures H-D is presented For comparison, we have also used s as independent variable instead of q. The SANS intensity of each pure sample is notably different from the SAXS intensity (see Fig. 2) More precisely, with SANS, the ionic peak is very weakly observed in the H sample while the second peak is more intense. In the D sample, the second peak obviously results from two contributions reported at 0.25 and 0.30 nm-1. When the H/D ratio increases from 0 to 100%, the first one vanishes while the intensity of the second increases. At the same time, the ionic peak can be weakly observed when the hydrogenated part increases. At 333 K, a similar evolution is observed but the ionic peak intensity is greater
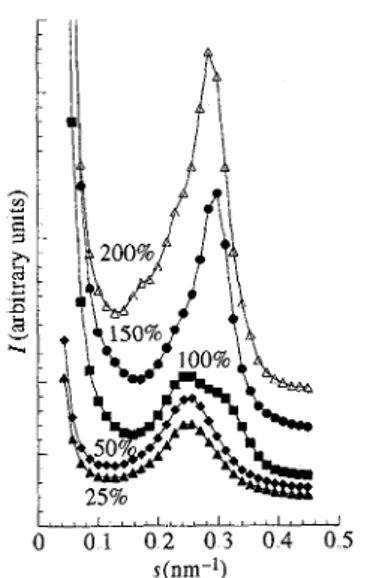
compared with the peak at 0.3 nm-1. Fig. 9 shows the evolution of the SANS intensity of the D sample when the mesogen proportion is progressively increased from 25 to 200%, relative to the stoichiometric proportion. The intensity of the peak at 0,3 nm-1 increases continuously with the mesogen proportion. From this experiment, it is obvious that the peak observed at 0.3 nm-1 depends on the quantity of mesogen. Therefore, this peak will be referred to as the mesogenic peak. The higher neutron scattering cross section of the N atoms of the mesogen explains its observation by SANS, while it is only weakly observed by SAXS.
Fig 9 The SANS intensity of PDSM1/0.7 exchanged with different amounts of ionic mesogen M The molar percentage of mesogen compared with that of the sulfonato end groups is noted along the corresponding curve.
This mesogenic peak should be related to the smectic organization of the mesogenic ions, which corresponds to an inter lamellar distance of 3.2 nm„ Its observation results from the scattering due to parallel interfaces.
The peak at 0.25 nm-1 is observed for all proportions of mesogen. Its intensity decreases when the mesogenic proportion increases This peak is not detected in the H sample and results from the presence of deuterium whose cross section is notably different from that of H. At this point in the discussion, it must be remembered that the D sample is only partially deuterated. In the end-function-alization step of the synthetic procedure, the living deuterated polystyrene chains are first capped with hydrogenated 1,1-diphenylethylene before being deactivated with 1,3-propanesulfone.
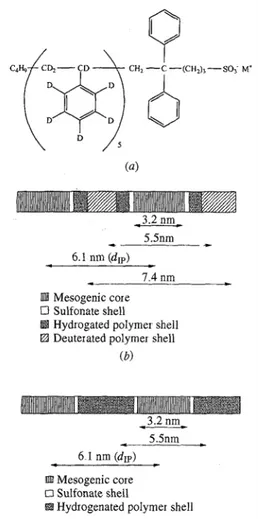
Fig. 10. (a) The chemical structure of the PDS1M/0. 7 sample, (b) A model proposed for the
suρramoleculai organization of the PDS1M/0.7 sample (c) A model proposed for the supramolecular organization of the PSS1M/0.7 sample
As a result, a hydro-genated segment is attached to the deuterated chain, as illustrated in Fig. 10(a). Since the molecular weight of the deuterated polystyrene is very low (Mn = 700), the length of the hydrogenated segment is not negligible compared with that of the deuterated one Thus, the mesogenic ion aggregates are surrounded by a sulfonate shell, then by a hydrogenated polymer shell and finally by a deuterated polymer shell as shown in Fig. 10(b). In SANS, the sulfonate shell is not very different from the hydrogenated part of the chains. In the H sample, the mesogenic aggregates are only
surrounded by the sulfonate shell as can be seen from Fig. 10(c). The deuterium peak corresponds to a distance of 4 nm. If the deuterium shell is assumed to be spherical, it may be conceivable that the deuterium peak represents the diameter D of the shell In this way, the s position of the peak is 1.84/D and the diameter of the external shell is of the order of 7.4 nm In the previous discussion, the shape of the ionic aggregates is assumed to be spherical. In practice, the qualitative considerations mentioned earlier are also valid when other shapes (platelets, cylinders or extended planes) are considered. Moreover, the shape of the aggregates could change with Mn and is probably related to the polymer/mesogen weight ratio, as in the case of block copolymers.
The ionic peak corresponds to the mean distance between two neighbouring aggregates This distance is of the order of 6.1 nm and is in good agreement with the smectic phase dimension (3.2 nm) and the radius of the deuterium shell (3.7 nm) as can be seen from Figs. 10(b) and (c) where a possible model of association of the chains is suggested When excess mesogen is added, the ionic peak is weakly observed in the D sample with SANS. Otherwise, this peak remains invisible in the SANS intensity of the D sample.
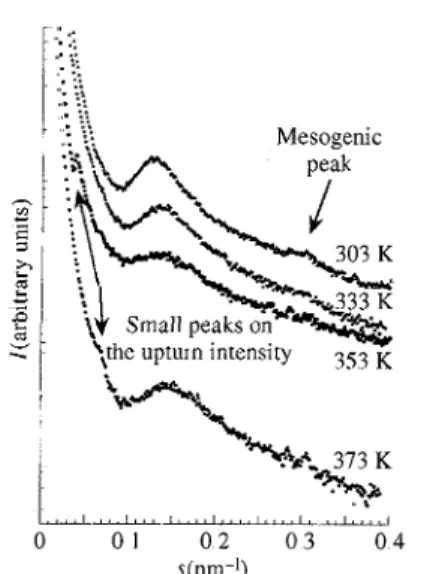
Fig. 11. The effect of temperature on the SAXS curve of PSS1M/0.7
In an SAXS experiment, the main contribution to the electronic contrast results from sulfonate ions while in an SANS experiment, the contrast is due to N and to deuterium when compared with H. The N ions are distributed along the mesogenic molecule. The SANS intensity reveals the mesogenic structure and the effect resulting from the replacement of H by deuterium However, the SAXS intensity results from the electronic contrast between the sulfonate ions and the hydrocarbonated chains, the O and N ions contributing slightly to the contrast Indeed, in this way, the SAXS ionic peak results from the presence of sulfonate ions and corresponds to the mean distance between the centres of the
neighbouring sulfonate shells. This contrast is very weak in the carboxylate samples so that the ionic peak is less intense than in the sulfonate ones.
The ionic peak is very weak or even not observed in the SANS intensity In deuterated PDS1M/0.7, the high contrast between deuterated polystyrene and the other part of the molecule masks the low contrast resulting from sulfonate ions. On the other hand, in hydrogenated PSS1M/0.7, the contrast along the polymer chain only results from the sulfonate ions, so that this peak is better observed when the PDS1M/0,7 proportion is decreased.
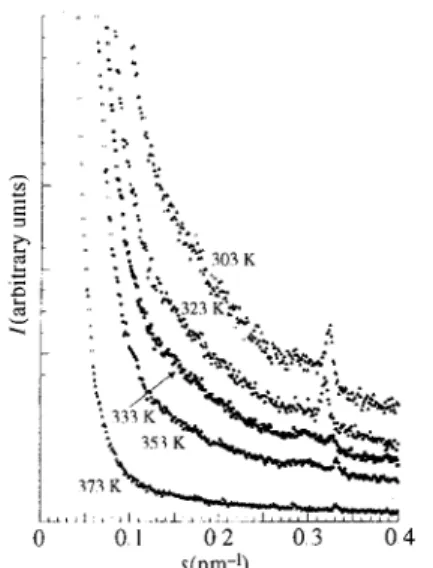
Fig 13 The effect ot temperature on the SAXS curve of PSC1M/5.7.
3.3. Temperature effect
The effect of temperature on the SAXS intensity is now examined,. At 318 K, the PSS1M/0.7 already shows an important decrease in the ionic peak intensity (Fig. 11). At higher temperatures, its intensity decreases more and the ionic peak disappears at 373 K while the intensity of the mesogenic peak, already observed at 30.3 K, increases slightly with temperature.
Similar observations (Fig. 12) can also be made on PIS2M/11.0, although the decrease in the ionic peak intensity is detected only from 333 K upwards. A shift of the ionic peak towards larger angles with increasing temperature is also observed. The dIP distance is 7,8 nm at 30.3 K, 7.4 nm at 3.3.3 K, 7.2 run at 353 K and 6.8 nm at 37.3 K, These observations are in agreement with the macroscopic liquid-crystalline character of the PSS1M/0.7 and PIS2M/11.0 samples (see Table 1), which is confirmed here by the persistence of the mesogenic peak. In PSC1M/5.7 (Fig, 1.3), the disappearance of the scattered intensity is continuous from 303 K.
Fig 15 Oscillations on the tail end of the SAXS intensity for mono-or difunctional PSS and for the PSC1M/2.0 sample.
3.4. Supplementary oscillations on the SAXS intensity
When the SAXS intensity is measured with a Kratky camera, a larger domain of s is observed and a better resolution of the SAXS profile is obtained. Three distinct observations have been made.
Firstly, at very small angles, the strong upturn of the SAXS intensity when s becomes zero often shows small oscillations (Fig. 14) and the s position at the beginning of the upturn (Fig. 2) seems to be dependent on the ionic peak position and its broadness. This latter observation results from the superposition of the strong upturn and the ionic peak so that the minimum intensity position seems to move towards higher angles when the ionic peak moves in the opposite sense. The oscillations on the upturn of the intensity are obtained with both desmearing procedures and have not yet been interpreted. They are apparently similar for all the monofunctional and the difunctional PS. Synchrotron-radiation experiments with sufficiently high resolution could confirm the reality of these oscillations. Such experiments are currently ongoing,
The second observation resulting from Kratky camera measurements concerns the possible structure of the ionic peak itself For example, PSS1M/8,0 (Fig, 7) shows two maxima while PSS1M/7.0 (Fig. 4) presents a small peak on the left side of the ionic peak. This should indicate that the ionic aggregates are not uniformly distributed in the polymer matrix and that the distribution of the aggregates is described by more than one repetitive distance between the ionic aggregates. On the contrary, in the low-molecular-weight samples, the ionic peak is well formed, indicating a regular distribution of interaggregate distances around a mean value.
The third observation concerns the tail end of the SAXS intensity where regular oscillations are detected (Fig. 15). The mesogenic peak is observed in the PSSlMs of mass 0.7 and 1.0 and in PSC1M/2,0, Otherwise, the curves of all the PSS1Ms are quite similar:. It should be noted that the oscillations move towards smaller angles when the molecular weight increases. However, no correlation is found between the position of the oscillations and the position of the ionic peak. The three PSS2Ms show similar oscillations, while PSC1M/2.0 exhibits a third structure of oscillations. A detailed analysis of these oscillations will be presented in a forthcoming paper.
4. Conclusions
A combined SAXS and SANS study of LC H(S)TPs has evidenced the association of the ion pairs into stable multiplets distributed throughout the polymer matrix. The SAXS and SANS curves are generally characterized by two peaks which have been assigned as the ionic peak and the mesogenic peak. The Bragg spacing associated with the ionic peak is much larger in the LC H(S)TPs than in the H(S)TP precursors. This increased interaggregate distance has been attributed to the bulkiness of the mesogenic multiplets (3.2 nm) and to the restriction of mobility experienced by the polymer chain segments in the proximity of the multiplets A general law has been derived for the average inteimultiρlet distance of ω-sulfonatopolystyrenes of Mn < 15 000. The proportionality between dionic peak and the square root of Mn is restored while considering dIP -5.5 run instead of dIP, The SAXS contrast mainly originates from the sulfonate ions, as confirmed by the weak intensity of the ionic peak in carboxylato samples.
The mesogenic peak is related to the organization of the smectic counterions in the multiplets and corresponds to the layer spacing of the pure mesogen. As a result, the shape of the multiplets would be lamellar rather than spherical, as is generally assumed in H(S)TPs, A careful examination of the origin of the SANS contrast in hydrogenated and partially deuterated samples has allowed us to understand the differences in the SANS curves of these samples.
The effect of temperature on the SAXS curves has been examined. As far as the ionic peak is concerned, its intensity decreases with increasing temperature.
Finally, oscillations in the SAXS curves measured with a Kratky camera are observed for all samples at very small angles and at the tail end of the curves. Although no interpretation of these oscillations is given in the present paper, a similarity between all the PSS1M samples is noticed The same conclusion also holds for the PSS2M samples.
Aknowledgements
GVdB and RS are very grateful to the FNRS and to the 'Ministere de l'Enseignement Superieur et de la Recherche de la Communauté Francaise de Belgique' for financial support.
JFG and RJ are indebted to the 'Services Federaux des Affaires Scientifiques, Techniques et Culturelles' for financial support in the framework of the 'Poles d'Attraction Interuniversitaires: Polymeres' and to the Human Capital and Mobility Large Scale Facility program of the European Community for financial support of the neutron scattering experiment performed at the Laboratoire Leon Brillouin.
References
Broze, G.., Jérôme, R & Teyssié, P. (1982). Macromolecules, 15, 920-927
Eisenberg, A. & Bailey, F E. (1986) Coulombic Interactions in Macromolecular Systems Am.. Chem. Soc. Symp. Ser 302 Washington, DC: American Chemical Society.
Eisenbeig, A.., Hird, B & Moore, R B. (1990) Macromolecules, 23, 4098-4107
Fontaine, F, Ledent, X, Sobry, R, Francois, E., Jeiome, R & Teyssié, P. (1993). Macromolecules, 26, 1480-1482 Fujimura, M., Hashimoto, T & Kawai, H (1982) Macro-molecules, 15, 136-144. Gohy, I, F, Vanhoome, E & Jérôme, R (1996). Macromolecules, 29, 3376-3383.
Jérôme, R (1989) Telechelic Polymers Synthesis and Application, ch 11. Boca Raton, FL: CRC Press, Inc MacKnight, W. J & Earnest, T R (1981). J. Polym Set Macromol Rev. 16, 41-122
MacKnight, W. J, Taggart, W. P. & Stein, R. S (1974). J Polym Sci Polym Symp Ed. 45, 113-128. Pinéri, M & Eisenberg, A. (1987) Structure and Properties of Ionomers, NATO ASI Series C, No 198
Boston: D. Reidel Register, R A, Cooper, S. L.., Thyagatajan, P., Chakrapani, S & Jerome, R. (1990). Macromolecules, 23, 2978-2983
Sobry, R., Fontaine, F, Ledent, J., Foucart, M & Jérôme, R (1998) In preparation Sobry, R.., Rassel, Y, Fontaine, F, Ledent, J & Liégeois, J.-M. (1991). J Appl Cryst 24, 692-701
Ujiie, S. & Iimura, K (1992) Macromolecules, 25, 3174-3178 Vonk, C. G (1971) J. Appl Cryst 4, 340-342
Williams, C E, Russell, T. P, Jérôme, R. & Horrion, J. (1986)Macromolecules, 19, 2877-2884. Yarusso, D J & Cooper, S L (1983) Macromolecules, 16, 1871-1880