HAL Id: hal-01586803
https://hal.inria.fr/hal-01586803
Submitted on 13 Sep 2017
HAL is a multi-disciplinary open access
archive for the deposit and dissemination of
sci-entific research documents, whether they are
pub-lished or not. The documents may come from
teaching and research institutions in France or
abroad, or from public or private research centers.
L’archive ouverte pluridisciplinaire HAL, est
destinée au dépôt et à la diffusion de documents
scientifiques de niveau recherche, publiés ou non,
émanant des établissements d’enseignement et de
recherche français ou étrangers, des laboratoires
publics ou privés.
Characterizing Latency in Touch and Button-Equipped
Interactive Systems
Géry Casiez, Thomas Pietrzak, Damien Marchal, Sébastien Poulmane,
Matthieu Falce, Nicolas Roussel
To cite this version:
Géry Casiez, Thomas Pietrzak, Damien Marchal, Sébastien Poulmane, Matthieu Falce, et al..
Char-acterizing Latency in Touch and Button-Equipped Interactive Systems. Proceedings of the ACM
Symposium on User Interface Software and Technology (UIST 2017), Oct 2017, Québec, Canada.
�10.1145/3126594.3126606�. �hal-01586803�
Characterizing Latency
in Touch and Button-Equipped Interactive Systems
Géry Casiez
1, Thomas Pietrzak
1, Damien Marchal
2,
Sébastien Poulmane
3, Matthieu Falce
4, Nicolas Roussel
3 1Université de Lille,
2CNRS,
3Inria Lille,
4MFC
{gery.casiez, thomas.pietrzak, damien.marchal}[email protected]
{sebastien.poulmane, nicolas.roussel}@inria.fr, [email protected]
ABSTRACT
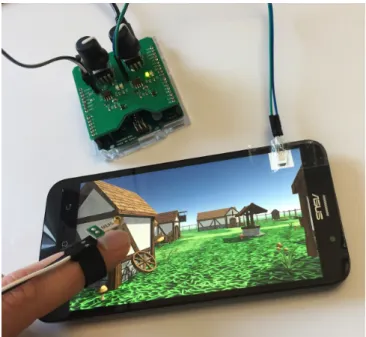
We present a low cost method to measure and characterize the end-to-end latency when using a touch system (tap la-tency) or an input device equipped with a physical button. Our method relies on a vibration sensor attached to a finger and a photo-diode to detect the screen response. Both are connected to a micro-controller connected to a host computer using a low-latency USB communication protocol in order to combine software and hardware probes to help determine where the latency comes from. We present the operating prin-ciple of our method before investigating the main sources of latency in several systems. We show that most of the latency originates from the display side. Our method can help appli-cation designers characterize and troubleshoot latency on a wide range of interactive systems.
Author Keywords
latency; lag; measure; toolkits; measurement tools.
ACM Classification Keywords
H.5.2User Interfaces: Input devices and strategies
INTRODUCTION
Any interactive system exhibits some delay between a user’s action and the corresponding system response, known as the end-to-end latency. This latency is caused by many factors pertaining to the input device, the operating system (e.g. de-vice drivers, control and communication policies), the soft-ware toolkits and application used, as well as the output de-vice. Depending on its amount and variation over time (jit-ter), the end-to-end latency can degrade the action-perception loop, impact user performance and make the system feel less responsive and interactive.
Latency has long been known to affect performance and user perception in indirect pointing tasks, Virtual Reality and touch interactions [1, 8–10, 12, 13, 16, 21]. While today’s touchscreens show latencies ranging from 50 to 200 ms [14],
it is known that users can perceive touchscreen latency as low as 2 ms [14] and that performance for dragging tasks degrades above 25 ms [10]. In indirect interaction, latencies above 50 ms are noticed and affect performance [8, 9].
Considering the importance of latency in interactive systems, it is essential to measure and report it, to assess how it af-fects users or the results of an experiment. Until recently, its measure has been a tedious process based on the use of external cameras [11, 14, 15, 18–21] but methods have been proposed to ease the process through interactive tools [2, 6] or repeated measures [3, 7]. These tools can be used to try to reduce latency but it can be a trial and error process without the understanding of the influence of each part of a system. In addition, none of the measurement tools allows to measure end-to-end latency while a user interacts with the system, and existing tools are limited to specific technologies.
We propose a new measurement method that consists in at-taching a vibration sensor to the user’s finger to determine
Figure 1: The hardware part of our method comprises a vibration sensor mounted on the finger to measure when a surface is touched or when a physical button is pressed, and a photo-diode to determine when the screen is updated.
when she taps a surface or presses a button, using a photo-diode to determine the screen response, and combining these two hardware probes with software ones through a low-latency communication protocol (Figure 1). The proposed combination of hardware and software provides a detailed picture of latency with contributions of different system lay-ers exposed.
The main contributions of this work can be summarized as follows:
• the first lightweight method to measure latency while users are interacting with arbitrary applications, whereas existing methods require them to perform specific tasks;
• the ability to measure it on the wide range of interactive systems that include a touch sensor (tap latency) or a phys-ical button;
• the combination of hardware and software probes at differ-ent levels to better understand where latency comes from; • the measurement of latency and jitter on different
oper-ating systems with different GUI toolkits which provides insights on their inner workings and can help application designers make informed choices.
The remaining of the paper is organized as follows: after dis-cussing some related works, we present the proposed method and its implementation. We then describe the measures we performed with it on different interactive platforms, and con-clude with a discussion of our results.
RELATED WORK
Our review of the related work first covers the human factors related to end-to-end latency before detailing existing mea-surement methods.
Human factors related to end-to-end latency
End-to-end latency has a detrimental impact on perception and performance in both direct and indirect interaction. Pavlovych and Stuerzlinger evaluated the influence of laten-cies of 33, 58, 83, 108 and 133 ms on a mouse-based pointing task with targets as small as 14 pixels and observed an in-creasing drop of performance above 58 ms [15]. In a similar task with targets as small as 12 pixels, Teather et al. observed a 15% performance drop between 35 and 75 ms [20]. Deber et al. studied the minimal perceivable latency with indirect touch devices and found a JND of 55 ms for dragging and 96 ms for tapping [8]. They have also shown that improve-ments in latency as small as 8.3 ms are noticeable from a wide range of baselines, particularly when dragging. Overall, these results suggest that latency above 50 ms impacts users’ perception and performance in indirect interactions.
Direct interaction is even more affected by end-to-end la-tency, as users can more easily notice the physical distance between their finger and the system’s output [8]. Jota et al. showed that users are able to perceive latency in response to tapping above 24 ms [10]. For dragging tasks, Ng et al. showed that latencies as small as 6 ms are perceivable [14], while Jota et al. showed that performance is affected above
25 ms [10]. For direct input systems using a stylus, Ng et al. reported perception limits of 2 ms for dragging and 6 ms for scribbling [13]. Overall these results indicate that even a few milliseconds of latency can be perceived in direct interaction, and that performance starts being affected at about 25 ms.
Techniques for measuring latency
The most common approach to measure end-to-end latency is to use an external camera to record both the physical action of the user on the input device and the corresponding on-screen response [2, 11, 14, 15, 17–21]. This is a tedious and time consuming process as the experimenter has to record a video, preferably using a high frame rate camera, to play it back frame by frame to match pairs of events such as the hand and an on-screen object changing direction, and then count the number of frames between the two events to get one measure of latency. Good measurements require careful camera place-ment and lighting conditions. See Casiez et al. for a detailed review of the relevant literature [3].
Bérard & Blanch proposed a “low overhead” approach for touch screens that consists in asking users to follow a target moving at a constant speed along a circular path with their finger, motion latency being determined by the on-screen dis-tance between the moving target and touch feedback [2]. The reported precision of this method is 4 ms but as the authors acknowledge, it requires significant training. Cattan et al. [5] proposed an alternative approach that requires users to per-form straight line trajectories at a constant speed of their choice while tuning the latency used by a linear prediction model until they observe the best match between the position of their finger and that of a visual feedback. They reached a precision of 2 ms and their method was overall preferred over that of Bérard & Blanch by participants. These two meth-ods have the merit to require no external hardware, but both require user training.
Deber et al. proposed a hardware solution to simulate touch events and detect the system’s visual response [7]. The pro-posed tool uses a mechanical relay attached to a brass contact to trigger capacitive touch events and a photo-diode to detect screen brightness changes. The system allows for repeated measures of end-to-end latency for tap actions, but does not allow one to determine where the latency comes from and only works with capacitive touch screens.
Casiez et al. measured the end-to-end latency of desktop computer systems using an unmodified optical mouse posi-tioned on the screen and displaying a moving pattern [3]. The pattern displacement fools the mouse sensor which results in controlled mouse events. End-to-end latency is determined as the time between a pattern displacement and the correspond-ing mouse event. As time measurements are done by the host-computer itself, this method allows to insert software probes at different places in the system. Measures on different oper-ating systems with different GUI toolkits showed that most of the latency comes from the hardware, with no further insight on its exact causes or sources, and that the GUI toolkit can have a significant impact on it.
The WALT project1uses a special stylus equipped with an
accelerometer to measure input latency, defined as the time from the moment a finger-like probe touches down on the screen until the kernel timestamps an action down event. The pen is considered to contact the surface when the accelerom-eter senses a shock above 3 g. Output latency is measured using a different setup. Our technique uses a simpler design and allows the user to interact using her finger. Microsoft Hardware Recommendation’s for original equipment manu-facturers2also describes a method to measure input latency
using a piezo microphone mounted on the touch surface. It is subject to the delay between the actual contact and the time the wave reaches the microphone and may be subject to ambi-ent noise. Overall these two projects do not allow to measure end-to-end latency and characterize it in a single operation. Our two main goals are to extend previous work by measur-ing latency while a user is interactmeasur-ing with a variety of de-vices, using hardware and software probes at different levels. Bérard et al. and Cattan et al. used interactive approaches that require users to perform specific tasks [2, 6]. Casiez et al. used software probes but no hardware ones [3]. Deber et al.’s method allows repeated measures on capacitive touchscreens, but on these devices only, and not while a user is interacting.
PROPOSED METHOD AND IMPLEMENTATION
Our method builds on previous ones introduced by Bérard et al., Deber et al. and Casiez et al. It combines hardware parts with specific software. The hardware parts were chosen and assembled in order to be as unobtrusive as possible and compatible with a variety of interactions. Instead of asking users to do something special we decided to equip their finger to detect when interaction occurs, and to use a photo-diode (like Deber et al.) to detect the system response. Like Casiez et al., we decided to use software probes, but we also de-cided to combine them with hardware ones using low-latency communications between our hardware solution and the host computer. All these elements taken together allow us to per-form latency measures that no one has ever done before. The hardware side of our implementation3 mainly consists in an Arduino Leonardo connected to a vibration sensor at-tached to the user’s finger and a photo-diode placed on-screen, for a total cost of less than $35. The rest of this section explains how these hardware elements are used in combina-tion with software probes to implement the proposed method.
Input (finger touch/press) detection
We use a vibration sensor (a MiniSense 1004). The sensor is made of a flexible PVDF piezoelectric polymer film loaded with a mass which bends it with inertia. It is glued on an elastic ring that one can comfortably wear when interacting with a touch surface, a keyboard or another button-equipped device as it leaves the pulp of the finger free. When a shock
1https://github.com/google/walt
2https://msdn.microsoft.com/en-us/library/windows/hardware/ dn293768(v=vs.85).aspx
3Additional information to replicate the hardware available at http://ns.inria.fr/mjolnir/lagmeter
4http://www.te.com/usa-en/product-CAT-PFS0011.html
occurs, e.g. when tapping a screen or pressing a button, the mass bends the sensor’s film due to acceleration. This results in strain that creates a piezoelectric response which in turn can be detected as a change of voltage across the electrodes of the sensor. Acceleration can of course also result from movements alone, which makes it necessary to carefully pro-cess the sensor’s signal to discriminate between true-positive (i.e. shocks related to interaction) and false-positive.
The vibration sensor signal first goes through an RC high-pass filter, the capacitor being the piezo sensor itself and the resistor being attached in parallel to it. We use a 1MΩ re-sistor giving a cutoff frequency around 650 Hz. This signal then goes to an interrupt pin of the Arduino micro-controller configured to detect rising edges. An optional amplification circuit composed of anLM311voltage comparator allows ad-justing the sensitivity of the sensor by adapting the voltage threshold required to trigger the interrupt. The threshold is adjusted with a potentiometer in a voltage divider circuit. An additionalPNP transistorprotects the comparator output from the influence of the Arduino GPIO impedence.
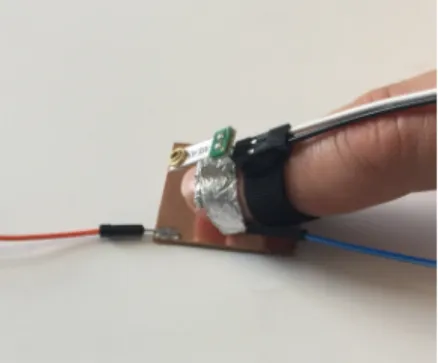
We define the response time of this input detector as the time between the user action (contact on a surface, or button press) and the first interrupt pin trigger. The voltage threshold in-fluences both the response time and accuracy of the detec-tor. With a low threshold, the response time is short, but false-positive input might be detected when the finger is sim-ply moving. Higher thresholds reduce the number of false-positives but increase the response time, and at some point, true-positives might not always be detected. Adjusting the voltage threshold thus consists in finding a good trade-off between a short response time and a low number of false-positives while preserving a high number of true-false-positives. We measured the response time of our detector by using it while tapping a copper plate with a finger wrapped with alu-minum foil (Figure 2). The copper plate and alualu-minum foil were connected through a resistor to another interrupt of the Arduino (rising edge interrupts trigger above 1.5V). We per-formed 200 measures using the amplification circuit with dif-ferent voltage thresholds (0.5, 1.0 and 1.5V) with moderate and stronger taps. A tap was considered "moderate" when the experimenter tapped as she would normally do on a touch surface and taps were "stronger" with more force than nor-mal. Taps were done with the hand naturally posed on the desk and using finger pad. We also performed measures with-out the amplification circuit. Results are summarized in Table 1 showing that the response time increases with higher refer-ence voltages. We observed few false-positives, and none for a voltage of 1.5V or no amplification. Overall the standard deviation is low, between 0.2 and 0.6 ms for the measures with no false-positive. Signal bounces were often observed, with a maximum time between the first and last interruption of 6.2 ms.
Finally, we measured the time corresponding to the begin-ning of interaction with physical buttons. Compared to touch surfaces, buttons consist of several mechanical parts. When pressing a computer mouse button, for example, the user first impacts the plastic casing and the plastic pivots on its hinge.
Ref V mean std max #fp 0.5V 1.4 µs 1.4 µs 12.6 µs 3 1.0V 1.6 µs 4.8 µs 66.0 µs 8 1.5 V 3.8 ms 0.6 ms 6.6 ms 0 no amplification 5.7 ms 0.2 ms 6.6 ms 0
Table 1: Response times of the vibration sensor for threshold values be-tween 0.5V and 1.5V and when the amplification circuit is bypassed. The rightmost column shows the number of false-positives detections. Each line was computed over 200 samples.
The plastic then hits the real internal switch, moves it and the contacts inside the switch touch each other, finally reg-istering an electronic signal. To clarify when the sensor pin triggers, we put copper tape on the plastic button and wrapped a finger with aluminum foil. The copper tape, mouse button and aluminum foil were connected through resistors to dif-ferent interrupts of an Arduino Leonardo to measure (1) the time the finger contacts the plastic case, (2) the time the button is triggered and (3) the time the sensor pin triggers. (2) -(1) was about 1.5 ms. Also the sensor starts triggering about 5 ms after the button is pressed down, corresponding to the measures we obtained with the copper plate. This confirms the sensor pin triggers when the button is pressed down. A typical response from the sensor is available in the Appendix. It clarifies that the vibration sensor is designed to detect hard contacts: finger contacting a surface or button pressed down.
Output (screen response) detection
The screen response is detected through a change in its bright-ness, ideally from black to white. This part of our setup is similar to that of [7]: we use aPDB-C156photo-diode with a flat-sided package that can be tapped on a display and has a fast and consistent response time with good visible light sensitivity. In contrast with [7], instead of reading the raw analog signal with an ADC, we use anotherLM311voltage comparator to trigger an interrupt and adjust the sensitivity with a potentiometer in a voltage divider circuit. We also did not observe the problems of noise reported in [7].
We define the response time of this output detector as the time between the brightness change and the first interrupt pin trig-ger. We measured it with a white LED placed in front of the
Figure 2: The vibration sensor response time was measured by using it while tapping a copper plate with a finger wrapped with aluminum foil.
photo-diode and wired to anSTM32micro-controller with a higher temporal resolution than the Arduino (12 ns vs 4 µs). With the best threshold tuning, we obtained an average re-sponse time of 3.9 µs (std = 0.02 µs) without signal bounce for 1000 repetitions. We do not report the threshold value because it depends on the screen luminosity. With a poor tun-ing, the mean response time goes up to around 20 µs, which is still far below the millisecond. The response time of our output detector is thus disregarded in what follows.
Communication with the host computer
Connecting our input and output detectors to the same Ar-duino board provides an efficient way to measure the end-to-end latency of a system, but we wanted to complement this approach with software probes as those from [3]. To the best of our knowledge, there is no robust solution for synchro-nizing a micro-controller clock with that of a host computer. Instead of trying to synchronize clocks and log hardware and software events separately, we investigated ways to efficiently exchange information between the Arduino and the host com-puter, in order to log all events at a unique place.
The Arduino Leonardo we use supports raw HID communi-cation at 1000 Hz. To evaluate the temporal cost of a com-munication, we performed repeated measures of round trip exchanges between the host computer and the Arduino, using HIDAPI5. The data consisted in 64 bytes reports made of
ran-dom data and elapsed by 100 ms. Measurements (n = 1000) were made on a MacBook Pro Retina 15-inch from mid 2014 with three different operating systems with no other applica-tion running (Table 2). The round trip time was on average of 1.2 ms, with a maximum value of 2 ms. The normal time for sending a report from the Arduino to the host computer can thus be reasonably estimated to 1 ms.
mean std max Windows 10 1.3 ms 0.3 ms 1.8 ms macOS 10.12 1.4 ms 0.3 ms 2.0 ms Ubuntu 16.04 0.9 ms 0.2 ms 1.9 ms
Table 2: Round-trip time between the host computer and the Arduino using Raw HID at 1000 Hz. All measures were made on the same com-puter.
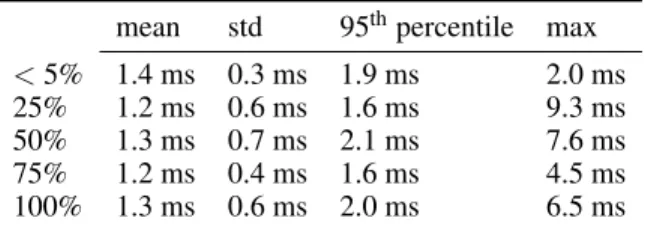
We investigated how the system load can affect the round trip time. We simulated different loads on macOS 10.12 using the stress utility6 with increasing numbers of CPU, IO and memory allocation processes: CPU=2, IO=5, VM=1 for a 25% load; CPU=4, IO=10, VM=2 for 50%; CPU=6, IO=15, VM=4 for 75%; andCPU=8, IO=20, VM=8for 100%. These new measure-ments (n = 1000) showed little impact of the system load on the average and standard deviation of the round trip time (Ta-ble 3). Although some measures went as high as 10 ms, most remained below 2.0 ms. In a worst-case scenario, the time for sending a report from the Arduino to the host computer can thus be reasonably considered below 5 ms.
5http://www.signal11.us/oss/hidapi/ 6http://people.seas.harvard.edu/~apw/stress/
mean std 95thpercentile max < 5% 1.4 ms 0.3 ms 1.9 ms 2.0 ms 25% 1.2 ms 0.6 ms 1.6 ms 9.3 ms 50% 1.3 ms 0.7 ms 2.1 ms 7.6 ms 75% 1.2 ms 0.4 ms 1.6 ms 4.5 ms 100% 1.3 ms 0.6 ms 2.0 ms 6.5 ms
Table 3: Impact of the system load on the round-trip time between the host computer and the Arduino on macOS.
Given the above results, Raw HID clearly seemed a very good way to exchange information between the Arduino and the host computer. In our implementation, when an interrupt is triggered, the Arduino sends a raw HID report encoding the event type (vibration-sensor or photo-diode) and a timestamp obtained using the micros7function, with 4 µs resolution. We debounce the vibration sensor’s signal by ignoring inter-rupts for 200 ms after the first interruption. This threshold is over conservative and could certainly be adjusted, given that we measure a maximum value of 6.2 ms between the first and last trigger of the piezo interrupt. No debouncing is done for the photo-diode as it does not seem necessary.
Inserting probes in the system
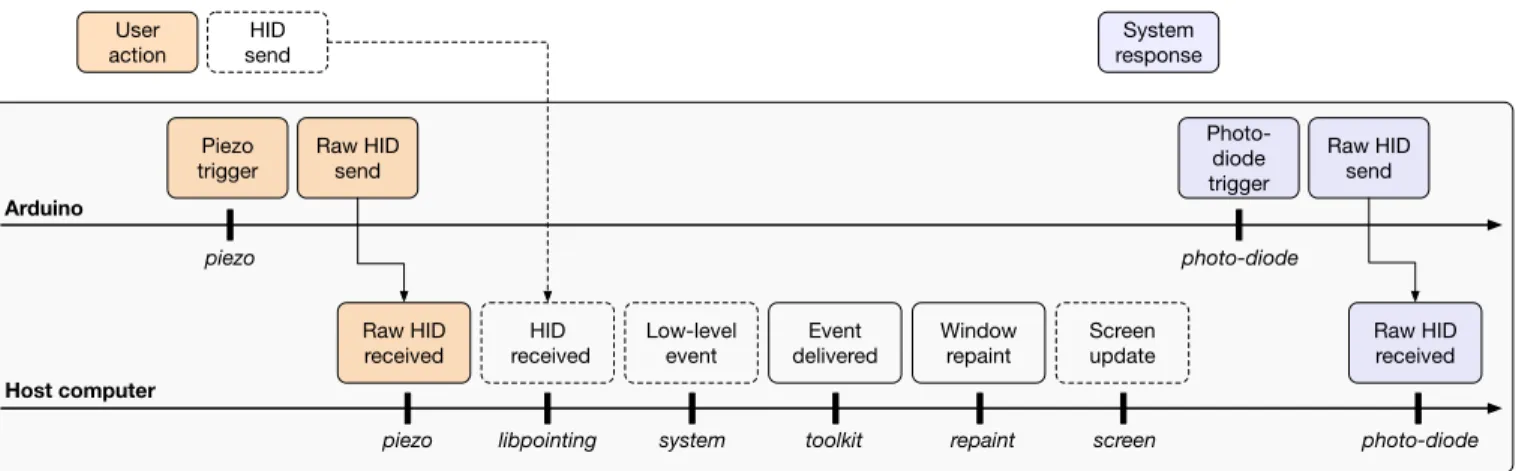
Our software probes consist of callback functions registered at different places. Each callback logs a timestamp and infor-mation available at the corresponding observation point. Fig-ure 3 shows the conceptual event sequence that our probes can record.
When user action is detected through the vibration sensor, the Arduino notes the time of this piezo event and forwards it to the host computer in a raw HID report. This report is re-ceived through HIDAPI by the computer which logs the event and the time of its arrival according to its own clock. If the input device in use is an HID pointing one (e.g. mouse or touchpad), we can use libpointing8 [4] to read the device’s report and log the information it contains. It might also be possible to log the system’s low-level event generated in re-sponse to user input, e.g. usingQuartz event tapson macOS. At some point, the input event is delivered to the application by a toolkit, e.g. through a callback or a listener mechanism. Upon reception of the input event, the application updates its internal state and repaints one or more of its windows. This is the time were we can repaint a specific window of ours over which the photo-diode is placed. On some sys-tems, it might be possible to know when it is logically done and the screen is ready to be physically updated, e.g. us-ingCGRegisterScreenRefreshCallback on macOS. The actual screen update is detected through the photo-diode by the Ar-duino which again notes the time of this event and forwards it to the host computer in a raw HID report. Like for the ini-tial piezo event, this report is received through HIDAPI by the computer which logs the event and the time of its arrival according to its own clock.
7https://www.arduino.cc/en/Reference/Micros 8http://libpointing.org
The end-to-end latency of the system can be computed in two ways by subtracting the piezo time from the photo-diode time using either the Arduino clock values or those of the host computer. When using the host computer clock values, la-tency can be further characterized by looking at the recorded times for the various software probes. Note that the list of software probes given above is by no means exhaustive and could be extended based on other system or toolkit services.
MEASURES
Unless stated otherwise, the reported measures were per-formed using the aforementioned MacBook Pro running ma-cOS 10.12. Toolkits used were Qt 5.8 and freeglut 3.0, ref-erenced as GLUT. Timestamps were created on host comput-ers with millisecond or sub-millisecond precision, e.g. us-ing gettimeofday. We used specific applications show-ing a black background that switched to white upon “touch down” or “mouse button down” events and back to black upon “touch up” or “mouse button up”. The CPU load was kept minimal, below 5%. Each of the analysis presented below is based on at least 150 valid blocks, i.e. sequences of events logged on the host computer starting with piezo and ending with photo-diode.
The photo-diode was always positioned at the center of the display and the vibration sensor was used with the amplifi-cation circuit bypassed. We made this choice to ease future replication (this circuit is optional) and because the response time for this setting is comparable to an amplification of 1.5 V and its variance is low (5.7 ms and 0.2 ms, see Table 1). By-passing the amplification circuit renders the potentiometer in-operable, which makes it impossible to inadvertently change the detector configuration during measurements. Without am-plification, we of course increase the chances of not detecting the piezo signal, but such trials can be simply discarded when analyzing the logs.
The presented end-to-end latencies were computed by sub-tracting the piezo time from the photo-diode time using either the Arduino clock values (end-to-end∗values) or those of the host computer (end-to-end values) and adding 5.7 ms, the re-sponse time for the chosen input detector configuration. The response time of the output detector was disregarded for rea-sons explained above.
Intermediate latency values were computed by subtracting the host computer piezo time from the considered event time (lib-pointing, system, toolkit, repaint or screen), adding 5.7 ms and further adding 0.7 ms for the initial communication be-tween the Arduino and the host computer (half the round-trip time observed on macOS, see Table 2).
Latency using a mouse button
Casiez et al. measured the end-to-end latency on desktop computers using a mouse and found substantial differences between the GLUT and Qt toolkits, GLUT showing a latency of 46.7 ms on average (std 5.3 ms) and Qt showing 66.0 ms (std 5.1 ms) [3]. We replicated their measures using a wired Logitech M-BT58 mouse at 125 Hz, similar to the Logitech
Host computer Arduino Raw HID send Raw HID received repaint
libpointing system toolkit screen
piezo photo-diode HID received Low-level event Event delivered Window repaint Screen update Raw HID received HID send System response piezo photo-diode Raw HID send Piezo trigger Photo-diode trigger User action
Figure 3: Conceptual event sequence between a user action and the system’s response. Events observed by the Arduino and the host computer probes are shown in italic on the corresponding timelines. Optional probes are shown in dashed lines.
MX310 mouse they used and found a similar end-to-end la-tency of 67.9 ms (std 4.9 ms) with a Qt 5.8 application dis-playing a texture. On the exact same computer this shows that the system upgrade (macOS 10.10 to 10.12) and toolkit upgrade (Qt 5.7 to 5.8 ) do not seem to have affected latency. We then measured end-to-end latency using our method, again using the Logitech M-BT58. We used all the software probes shown on Figure 3 implemented as asynchronous and non-blocking callbacks and configured the two toolkits for double buffer display.
We compared the measurement of about 150 trials with our two implementations. Table 4 shows the mean and standard deviation for each probe. Our results are very close to those obtained in [3]: the differences between measures are below 2 ms with similar standard deviations, providing a first vali-dation of our method and suggesting there is no difference in terms of latency between pressing a mouse button and mov-ing the mouse. The end-to-end latency computed with Ar-duino clock values (end-to-end∗) is very close (0.1 ms) to the one computed with those of the host computer (end-to-end), which also illustrates the efficiency and robustness of our communication protocol.
About 12 ms elapse between the mouse button press and the reception of the mouse HID report by the host computer (lib-pointingevent). About 2.5 ms then elapse before the appli-cation drawing code (repaint). The time between the draw-ing code and the moment when the screen is ready to be re-freshed (screen) remains comparable between GLUT (25.3 ms) and Qt (31.6 ms). Strangely, most of the difference be-tween the two toolkits seems to reside in what comes after this and before the actual screen change detected by the photo-diode (end-to-end): 9.7 ms for GLUT and 22.5 ms for Qt.
Influence of HID polling rate
We measured the influence of HID polling rate using our C++/Qt application and a Logitech G9 mouse, a utility pro-gram allowing to configure it between 125 Hz and 1000 Hz. Results are summarized in Table 5. They suggest that the internals of the G9 mouse are different from the Logitech
M-C++ / GLUT C++ / Qt mean std mean std libpointing 12.1 ms 3.3 ms 11.0 ms 2.3 ms system 12.1 ms 3.4 ms 11.5 ms 2.4 ms toolkit 12.4 ms 3.5 ms 12.0 ms 2.4 ms repaint 12.5 ms 3.5 ms 13.5 ms 2.4 ms screen 37.8 ms 7.5 ms 45.1 ms 3.9 ms end-to-end 47.5 ms 7.6 ms 67.6 ms 4.0 ms end-to-end∗ 47.6 ms 7.6 ms 67.6 ms 4.0 ms
Table 4: Comparison between the macOS GLUT and Qt implementa-tions using a Logitech M-BT58 mouse.
125 Hz 250 Hz 500 Hz 1000 Hz libpointing 3.3 (2.1) 0.8 (1.3) 0.4 (1.0) 0.6 (0.9) system 4.0 (2.1) 1.4 (1.3) 1.0 (1.1) 1.1 (1.0) toolkit 4.6 (2.2) 2.0 (2.0) 1.6 (1.2) 1.7 (1.1) repaint 6.2 (2.3) 3.7 (2.1) 3.3 (1.2) 3.2 (1.2) screen 36.7 (4.6) 34.6 (5.2) 34.4 (5.6) 33.3 (5.6) end-to-end 61.6 (3.9) 59.3 (4.7) 59.0 (5.0) 58.2 (5.1)
Table 5: Influence of input frequency on latency (ms) with a Logitech G9 mouse on a Macbook Pro and C++/Qt. std are provided in brackets.
BT58 we used: even at 125 Hz, the time to receive the HID event is only 3.3 ms compared to 11 ms for the M-BT58, suggesting the G9 took less time to send the USB messages. Increasing the frequency up to 1000 Hz results in marginal improvements (less than 4 ms). The gaps between repaint, screenand end-to-end even further hint at an important con-tribution of the “drawing and refresh time” to end-to-end la-tency.
Influence of display frequency
We used a Dell S2716DG monitor capable of refreshing up to 144 Hz to evaluate the influence of display frequency on end-to-end latency. We performed measures using C++/GLUT and C++/Qt at 60 and 120 Hz, our macOS system being un-able to drive the screen at 144 Hz. The Logitech G9 mouse was used for input, configured at 1000 Hz. Doubling the dis-play frequency allows to reduce the latency by 15.5 ms with
GLUT and 15.9 ms with Qt. We repeated the measure on Windows 10 using the same screen at 144 Hz and obtained comparable results for GLUT with an end-to-end latency of 21.4 ms, but a shorter one for Qt with 23.5 ms. On Windows 10, the time up to repaint was also about 2 ms.
C++ / GLUT C++ / Qt 60 Hz 120 Hz 60 Hz 120 Hz libpointing 0.4 (1.9) 0.6 (1.0) 0.5 (1.0) 0.4 (1.0) system 1.0 (2.0) 1.2 (1.1) 1.1 (1.1) 1.0 (1.1) toolkit 1.7 (2.1) 2.0 (1.2) 1.7 (1.1) 1.7 (1.1) repaint 1.8 (2.1) 1.9 (1.3) 2.2 (1.2) 2.2 (1.2) screen 23.5 (4.7) 13.0 (2.5) 30.4 (6.4) 20.6 (3.0) end-to-end 36.6 (3.6) 21.1 (2.5) 45.5 (6.4) 29.6 (2.7)
Table 6: Influence of display frequency and toolkit (Qt and GLUT) on latency (ms) with a Logitech G9 mouse on a Macbook Pro with a Dell S2716DG monitor. std are provided in brackets.
DISCUSSION
In absence of a gold-standard to measure and characterize end-to-end latency, our method can only be assessed through the analysis of its inner workings and comparisons with mea-sures performed using other methods in identical of similar contexts.
We use timestamps generated by the host computer with mil-lisecond or sub-milmil-lisecond precision, which are recorded upon the invocation of callbacks. We can assume the time differences we compute have also millisecond precision at most. Errors of measure can come from the vibration sensor, photo-diode and USB communication between the Arduino and the host computer. Interrupts have latencies of the order of micro-seconds and the photo-diode response time is 20 µs at most, a few order of magnitude below what we want to measure. We have shown that the latency of Raw HID com-munication is low, below 1 ms. In addition, by comparing the difference of the piezo and photo-diode timestamps recorded by the Arduino to the difference of those recorded by the host computer, we have shown they are very close with a differ-ence below 0.1 ms. We can thus assume the USB communi-cation has little impact on the precision of our measures. We have lastly shown the vibration sensor has a response time of 5.7 ms on average with a small standard deviation (0.2 ms). Taken together, we can assume our measures have a precision of the order of 1 or 2 ms, which is below the threshold of what humans can perceive in different contexts.
Using a computer mouse with hardware and software very similar to [3], we obtained very close results: the maximum absolute difference between measured latencies is 1.6 ms. The results we obtained for the iPhone 6 and iPad Air 2 run-ning iOS 9.2 are also close to the iPhone 6 and iPad mini running iOS 8.4 tested by Deber et al. [7], with a difference of 0.7 ms for the iPhone 6 (see Appendix). This replication work and the consistency obtained with different measure-ment methods allows to cross validate the two methods. The probes we inserted allow to determine the contribution of different hardware and software parts to end-to-end la-tency. In our test applications that do nothing else than
chang-ing the background color of their window, the time between the libpointing and repaint events is typically below 3 ms. Another application would certainly take some time to pro-cess the event and update its internal state between these two events. But overall, our results show that most of the latency comes from before the libpointing event, or after the repaint one. We will refer to these two ends as “input latency” and “output latency” in what follows.
Using a standard 125 Hz optical mouse, we observed an in-put latency of the order of 12 ms and we have shown it can go down to less than 2 ms using a 1000 Hz gaming mouse. Using a 1000 Hz mouse, we have shown the libpointing event comes about 0.5 ms after the mouse button was pressed, sug-gesting the vibration sensor is not necessary to measure end-to-end latency on these devices. For touch, this input latency is higher, in the range of 14 to 25 ms using native toolkits on Android devices and around 30 ms for Apple trackpads (see Appendix). Interestingly, we highlighted that the way these input devices are treated by the system severely affects latency, probably because of gesture interpretation.
Most of the end-to-end latency is due to the output latency, which might come from the GUI toolkit, the operating system (its graphic subsystem), the graphics card and the physical screen. Overall the output latency is in the range of 19 to 247 ms across all the measures we performed. We tested both the internal MacBook Pro 60 Hz display and an external Dell S2716DG monitor capable of refreshing at 60 and 120 Hz, using GLUT and Qt applications. On both displays running at 60 Hz, GLUT presents an output latency of 35.1 ms on the internal display and 34.8 ms on the external display while Qt provides an output latency of 54.1 ms on the internal display and 43.3 ms on the external display. It is not clear where this difference comes from. On the external display, moving from 60 to 120 Hz reduces the output latency from 34.8 ms to 19.2 ms (-15.6 ms) for GLUT and from 43.3 ms to 27.4 ms (-15.9 ms) for Qt. For a given device, operating system and hardware, choosing the appropriate toolkit is important to reduce the output latency, as observed on Android. A general rule to follow is to use native toolkits tailored for the system, in order to minimize end-to-end latency. WebGL seems a reasonable alternative for cross-platform development, but it does not work on all hardware. Other toolkits clearly have room for improvement. The variability we observed with the other toolkits emphasizes the importance of our method to perform systematic investigations in order to make the right design decisions in terms of latency.
We measured the end-to-end latency on different devices with applications specifically created for that purpose and that did not do anything else. The measures obtained can be consid-ered as “best case scenarios”. Two toolkits showing similar performance with our method are not guaranteed to remain comparable with more demanding graphics settings. Addi-tional measures out of the scope of this paper would be re-quired to clarify this question.
Our method can be easily used to benchmark existing ap-plications for which the source code is available. One sim-ply needs to add a small drawing area in its interface, large
enough to fit the photo-diode (7×5 mm), that would switch from black to white upon user action. The location of this area remains to be taken into consideration when interpreting the results as screens usually update from top to bottom. Such a setup would allow to study the evolution of latency during the ecological use of an application, which corresponds to the latency the user actually experiences. This could be quite dif-ferent from the latency measured in controlled conditions as different pieces of code can be called upon user interaction. The sensor attached to the finger can be a limitation but it still allows a developer to benchmark an application using real-istic scenarios. In controlled experiments where latency is a control variable, our method could be used to check that it re-mains within a given range and does not confound the results. Our method allows to measure latency on any touch sur-face, including non-capacitive ones. IR-based technologies are typically used on large touch screens and exhibit latency. The fact of being able to measure on any button-equipped device allows measuring latency with game-controllers, for example, where latency is known to affect user experience. Among all the measures we performed, the lowest end-to-end latency was 21.1 ms on a desktop using a 1000 Hz mouse, a 120 Hz screen and C++/GLUT, which is below the 50 ms considered to affect performance in indirect interactions and can thus be used to perform controlled Fitts’ law experiments, for example. For touch, the minimum end-to-end latency we obtained is 48.2 ms on an iPad Air 2 using the Cocoa toolkit which is well above 25 ms, known to affect performance with direct interaction.
Other measurement methods could benefit from our design. For example, the latency Hammer described in [7] could be adapted to use Raw HID communication as we do to support a combination of hardware and software probes similar to ours.
CONCLUSION
We developed a new method for measuring end-to-end la-tency that supports the combination of hardware and soft-ware probes in a system to determine where the latency comes from. Our method can be used to measure latency while the user is interacting with a system, and works with the wide range of input devices equipped with touch sensors or physi-cal buttons. The measures we performed on different systems and toolkits highlight the major role of toolkits and screens in the end-to-end latency. Our results can help developers choose an appropriate system and toolkit when developing an interactive application. Our method also gives them the abil-ity to check the consequences of the design choices they make by measuring the end-to-end latency in ecological settings.
ACKNOWLEDGMENTS
This work was supported by ANR (TurboTouch, ANR-14-CE24-0009).
REFERENCES
1. Michelle Annett, Albert Ng, Paul Dietz, Walter F. Bischof, and Anoop Gupta.
2. François Bérard and Renaud Blanch. 2013. Two Touch System Latency Estimators: High Accuracy and Low
Overhead. In Proceedings of the 2013 ACM
International Conference on Interactive Tabletops and Surfaces (ITS ’13). ACM, New York, NY, USA, 241–250. DOI:
http://dx.doi.org/10.1145/2512349.2512796
3. Géry Casiez, Stéphane Conversy, Matthieu Falce, Stéphane Huot, and Nicolas Roussel. 2015. Looking Through the Eye of the Mouse: A Simple Method for Measuring End-to-end Latency Using an Optical Mouse. In Proceedings of the 28th Annual ACM Symposium on User Interface Software & Technology (UIST ’15). ACM, New York, NY, USA, 629–636. DOI:
http://dx.doi.org/10.1145/2807442.2807454
4. Géry Casiez and Nicolas Roussel. 2011. No More Bricolage! Methods and Tools to Characterize,
Replicate and Compare Pointing Transfer Functions. In Proceedings of the 24th Annual ACM Symposium on User Interface Software and Technology (UIST ’11). ACM, New York, NY, USA, 603–614. DOI:
http://dx.doi.org/10.1145/2047196.2047276
5. Elie Cattan, Amélie Rochet-Capellan, and François Bérard. 2015a. A Predictive Approach for an End-to-End Touch-Latency Measurement. In Proceedings of the 2015 International Conference on Interactive Tabletops & Surfaces (ITS ’15). ACM, New York, NY, USA, 215–218. DOI:
http://dx.doi.org/10.1145/2817721.2817747
6. Elie Cattan, Amélie Rochet-Capellan, Pascal Perrier, and François Bérard. 2015b. Reducing Latency with a Continuous Prediction: Effects on Users’ Performance in Direct-Touch Target Acquisitions. In Proceedings of the 2015 International Conference on Interactive Tabletops & Surfaces (ITS ’15). ACM, New York, NY, USA, 205–214. DOI:
http://dx.doi.org/10.1145/2817721.2817736
7. Jonathan Deber, Bruno Araujo, Ricardo Jota, Clifton Forlines, Darren Leigh, Steven Sanders, and Daniel Wigdor. 2016. Hammer Time!: A Low-Cost, High Precision, High Accuracy Tool to Measure the Latency of Touchscreen Devices. In Proceedings of the 2016 CHI Conference on Human Factors in Computing Systems (CHI ’16). ACM, New York, NY, USA, 2857–2868. DOI:http://dx.doi.org/10.1145/2858036.2858394
8. Jonathan Deber, Ricardo Jota, Clifton Forlines, and Daniel Wigdor. 2015. How Much Faster is Fast Enough? User Perception of Latency & Latency Improvements in Direct and Indirect Touch. In Proceedings of the 33rd Annual ACM Conference on Human Factors in Computing Systems (CHI ’15). ACM, New York, NY, USA, 1827–1836. DOI:
http://dx.doi.org/10.1145/2702123.2702300
9. Stephen R Ellis, François Bréant, Brian M Menges, Richard H Jacoby, and Bernard D Adelstein. 1997. Operator interaction with virtual objects: effect of system latency. In Proceedings of HCI International ’97. Elsevier, 973–976.
10. Ricardo Jota, Albert Ng, Paul Dietz, and Daniel Wigdor. 2013. How Fast is Fast Enough? A Study of the Effects of Latency in Direct-touch Pointing Tasks. In
Proceedings of the SIGCHI Conference on Human Factors in Computing Systems (CHI ’13). ACM, New York, NY, USA, 2291–2300. DOI:
http://dx.doi.org/10.1145/2470654.2481317
11. Jiandong Liang, Chris Shaw, and Mark Green. 1991. On Temporal-spatial Realism in the Virtual Reality
Environment. In Proceedings of the 4th Annual ACM Symposium on User Interface Software and Technology (UIST ’91). ACM, New York, NY, USA, 19–25. DOI:
http://dx.doi.org/10.1145/120782.120784
12. I. Scott MacKenzie and Colin Ware. 1993. Lag As a Determinant of Human Performance in Interactive Systems. In Proceedings of the INTERACT ’93 and CHI ’93 Conference on Human Factors in Computing Systems (CHI ’93). ACM, New York, NY, USA,
488–493. DOI:http://dx.doi.org/10.1145/169059.169431
13. Albert Ng, Michelle Annett, Paul Dietz, Anoop Gupta, and Walter F. Bischof. 2014. In the Blink of an Eye: Investigating Latency Perception During Stylus Interaction. In Proceedings of the 32Nd Annual ACM Conference on Human Factors in Computing Systems (CHI ’14). ACM, New York, NY, USA, 1103–1112. DOI:http://dx.doi.org/10.1145/2556288.2557037
14. Albert Ng, Julian Lepinski, Daniel Wigdor, Steven Sanders, and Paul Dietz. 2012. Designing for
Low-latency Direct-touch Input. In Proceedings of the 25th Annual ACM Symposium on User Interface Software and Technology (UIST ’12). ACM, New York, NY, USA, 453–464. DOI:
http://dx.doi.org/10.1145/2380116.2380174
15. Andriy Pavlovych and Wolfgang Stuerzlinger. 2009. The Tradeoff Between Spatial Jitter and Latency in Pointing Tasks. In Proceedings of the 1st ACM SIGCHI Symposium on Engineering Interactive Computing
Systems (EICS ’09). ACM, New York, NY, USA, 187–196. DOI:
http://dx.doi.org/10.1145/1570433.1570469
16. Andriy Pavlovych and Wolfgang Stuerzlinger. 2011. Target Following Performance in the Presence of Latency, Jitter, and Signal Dropouts. In Proceedings of Graphics Interface 2011 (GI ’11). Canadian
Human-Computer Communications Society, School of Computer Science, University of Waterloo, Waterloo, Ontario, Canada, 33–40.
http://dl.acm.org/citation.cfm?id=1992917.1992924
17. Daniel R. Saunders and Russell L. Woods. 2014. Direct measurement of the system latency of gaze-contingent displays. Behav Res Methods 46, 2 (June 2014), 439–447.http://dx.doi.org/10.3758/s13428-013-0375-5
18. Anthony Steed. 2008. A Simple Method for Estimating the Latency of Interactive, Real-time Graphics
Simulations. In Proceedings of the 2008 ACM
Symposium on Virtual Reality Software and Technology (VRST ’08). ACM, New York, NY, USA, 123–129. DOI:
http://dx.doi.org/10.1145/1450579.1450606
19. Colin Swindells, John C. Dill, and Kellogg S. Booth. 2000. System Lag Tests for Augmented and Virtual Environments. In Proceedings of the 13th Annual ACM Symposium on User Interface Software and Technology (UIST ’00). ACM, New York, NY, USA, 161–170. DOI:
http://dx.doi.org/10.1145/354401.354444
20. R. J. Teather, A. Pavlovych, W. Stuerzlinger, and I. S. MacKenzie. 2009. Effects of tracking technology, latency, and spatial jitter on object movement. In 2009 IEEE Symposium on 3D User Interfaces. 43–50. DOI:
http://dx.doi.org/10.1109/3DUI.2009.4811204
21. Colin Ware and Ravin Balakrishnan. 1994. Reaching for Objects in VR Displays: Lag and Frame Rate. ACM Trans. Comput.-Hum. Interact.1, 4 (Dec. 1994), 331–356. DOI:http://dx.doi.org/10.1145/198425.198426
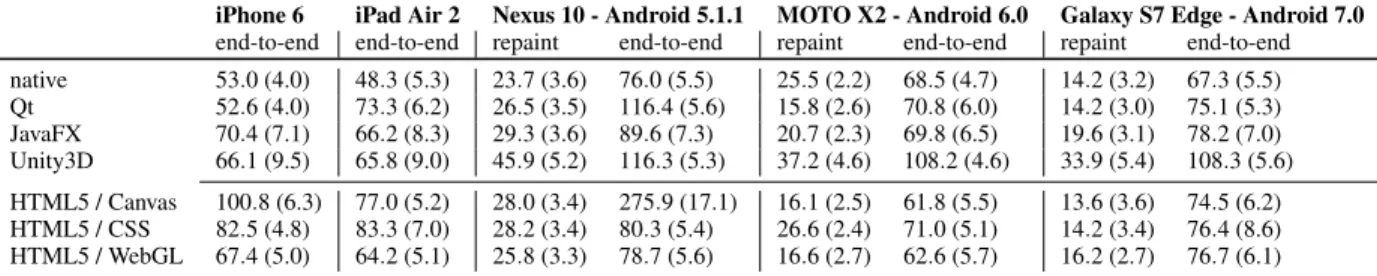
iPhone 6 iPad Air 2 Nexus 10 - Android 5.1.1 MOTO X2 - Android 6.0 Galaxy S7 Edge - Android 7.0 end-to-end end-to-end repaint end-to-end repaint end-to-end repaint end-to-end native 53.0 (4.0) 48.3 (5.3) 23.7 (3.6) 76.0 (5.5) 25.5 (2.2) 68.5 (4.7) 14.2 (3.2) 67.3 (5.5) Qt 52.6 (4.0) 73.3 (6.2) 26.5 (3.5) 116.4 (5.6) 15.8 (2.6) 70.8 (6.0) 14.2 (3.0) 75.1 (5.3) JavaFX 70.4 (7.1) 66.2 (8.3) 29.3 (3.6) 89.6 (7.3) 20.7 (2.3) 69.8 (6.5) 19.6 (3.1) 78.2 (7.0) Unity3D 66.1 (9.5) 65.8 (9.0) 45.9 (5.2) 116.3 (5.3) 37.2 (4.6) 108.2 (4.6) 33.9 (5.4) 108.3 (5.6) HTML5 / Canvas 100.8 (6.3) 77.0 (5.2) 28.0 (3.4) 275.9 (17.1) 16.1 (2.5) 61.8 (5.5) 13.6 (3.6) 74.5 (6.2) HTML5 / CSS 82.5 (4.8) 83.3 (7.0) 28.2 (3.4) 80.3 (5.4) 26.6 (2.4) 71.0 (5.1) 14.2 (3.4) 76.4 (8.6) HTML5 / WebGL 67.4 (5.0) 64.2 (5.1) 25.8 (3.3) 78.7 (5.6) 16.6 (2.7) 62.6 (5.7) 16.2 (2.7) 76.7 (6.1)
Table 7: Mean and (std) of end-to-end latency (ms) on an iPhone 6, iPad Air 2, both running iOS 10.2.1, a Nexus 10 running Android 5.1.1, a MOTO X2 running Android 6.0 and a Galaxy S7 Edge running Android 7.0; all using native application (Cocoa or Java), Qt, JavaFX and Unity3D toolkits in addition to HTML5 applications running in Safari and using a standard canvas, CSS and WebGL.
APPENDIX
This appendix reports on measures performed on various touch surfaces and keyboards.
Comparison of toolkits on touch devices
We compared different toolkits and Web applications on an iPhone 6 and an iPad Air 2 both running iOS 10.2.1, a Nexus 10 running Android 5.1.1, a MOTO X2 running Android 6.0 and a Galaxy S7 Edge running Android 7.0. For each system, we developed a native test application using Java or Cocoa and alternative ones using Qt, JavaFX and Unity3D. We also developed three HTML5/JavaScript test applications on Sa-fari (for iOS) and Chrome (for Android): a standard HTML canvas filling all the page; an HTML document using CSS; and a WebGL scene using Three.js9.
All the test applications we developed were instrumented so as to log repaint events in a file using millisecond or sub-millisecond precision timestamps. Measures on Android de-vices were performed with the Arduino directly connected to them through a USB port and using a custom service that logged its events into a file. By merging this log with the one recorded by the test application in use, we were able to com-pute not only the end-to-end latency but also the time between the user action and the application drawing code (repaint). As we were unable to directly connect it to the iPhone or iPad, Arduino events were logged on an auxiliary computer when testing these devices, which made it only possible to compute the end-to-end latency10.
Our measures are summarized in Table 7. The ones obtained with our iPhone 6 (53 ms) and iPad Air 2 (48 ms) are close to what was obtained by Deber et al. with an iPhone 6 (52.3 ms) and an iPad mini (54 ms) running iOS 8.4.1 [7]. The measures obtained with our Nexus 10 (76.0 ms) is also close to the 73.2 ms they reported for a Nexus 9 running Android 5.1.1.
Overall, the observed end-to-end latency ranges from 48 to 276 ms depending on the device / system / toolkit, replicat-ing results from the literature [14] where the tested systems were not described. For the same toolkit, results can be quite different between devices / systems. Our Qt application has a
9https://threejs.org/
10Synchronizing the clocks of the iOS devices and the auxiliary
com-puter would allow other computations, but we did not even try to go that far.
high latency on the Nexus 10 for example (116.4 ms) but the same application on the MOTO X2 exhibits 45.6 ms less la-tency. The same is true for HTML5/Canvas. The general rule we observe is that using a native language/toolkit is usually the best choice for minimizing the end-to-end latency, while HTML5/WebGL seems a good alternative for cross-platform Web development.
For Android devices, the repaint columns of Table 7 show the time between user action and the moment when the ap-plication starts drawing in response to it. With the exception of Unity3D, this “reaction time” was quite consistent across toolkits for a given hardware and Android version, which fur-ther hints at an important contribution of the “drawing and refresh time” to end-to-end latency.
Measuring latency on trackpads and keyboards
We finally measured the latency of the MacBook Pro when using its internal keyboard and trackpad, as well as external Bluetooth ones (Apple Wireless Keyboard and Apple Magic Trackpad 1). We again used the C++/Qt application. With both the internal and the external trackpads, we were sur-prised to measure high end-to-end latencies, above 230 ms (see Table 8). After observing this, however, we hypothesized the system waits for more than 150 ms upon touch detection, presumably to determine if a gesture or other contacts will follow before generating the event. To validate this hypoth-esis, we repeated the measures by placing a first finger on the trackpad and using second one to tap on the surface. The time until repaint dropped drastically around 30 ms. We per-formed similar measures with the keyboards. While we ex-pected higher latencies with the wireless one, we found very similar values between the two.
Trackpad 1 finger Trackpad 2 fingers Keyboard
internal external internal external internal external system 182.4 (25.6) 191.7 (34.5) 27.0 (3.2) 30.9 (4.1) – –
toolkit 182.9 (25.6) 192.3 (34.4) 27.5 (2.5) 31.4 (4.1) 24.2 (3.1) 23.0 (4.9) repaint 184.3 (25.6) 193.6 (34.4) 28.7 (3.3) 32.8 (4.1) 25.6 (3.1) 24.4 (4.9) end-to-end 235.2 (26.0) 245.3 (34.7) 80.5 (5.8) 91.2 (13.5) 78.2 (5.3) 77.1 (7.8)
Table 8: Comparison of end-to-end latencies (ms) between internal and external (wireless) trackpads and keyboards; for the trackpads when no finger is already is contact and when one finger is already in contact.
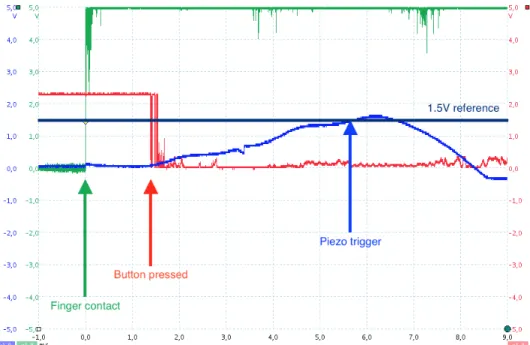
Figure 4: Screen capture of an oscilloscope showing the signals of 1) the finger contacting the plastic case of a mouse (green), 2) the triggering of the mouse button (red) and 3) the piezo response (blue), when pressing a computer mouse button. Additional details are provided in the subsection "Input (finger touch/press) detection".