HAL Id: hal-02626228
https://hal.inrae.fr/hal-02626228
Submitted on 26 May 2020
HAL is a multi-disciplinary open access archive for the deposit and dissemination of sci-entific research documents, whether they are pub-lished or not. The documents may come from teaching and research institutions in France or abroad, or from public or private research centers.
L’archive ouverte pluridisciplinaire HAL, est destinée au dépôt et à la diffusion de documents scientifiques de niveau recherche, publiés ou non, émanant des établissements d’enseignement et de recherche français ou étrangers, des laboratoires publics ou privés.
between specific IgE antibodies and their association
with asthma: A cross-sectional analysis within a
population-based birth cohort
Sara Fontanella, Clément Frainay, Clare S. Murray, Angela Simpson, Adnan
Custovic
To cite this version:
Sara Fontanella, Clément Frainay, Clare S. Murray, Angela Simpson, Adnan Custovic. Machine learning to identify pairwise interactions between specific IgE antibodies and their association with asthma: A cross-sectional analysis within a population-based birth cohort. PLoS Medicine, Public Library of Science, 2018, 15 (11), 22 p. �10.1371/journal.pmed.1002691�. �hal-02626228�
Machine learning to identify pairwise
interactions between specific IgE antibodies
and their association with asthma: A
cross-sectional analysis within a population-based
birth cohort
Sara FontanellaID1, Cle´ment FrainayID2,3, Clare S. Murray4, Angela Simpson4‡,
Adnan CustovicID1‡*
1 Section of Paediatrics, Department of Medicine, Imperial College London, London, United Kingdom, 2 Department of Epidemiology and Biostatistics, School of Public Health, Faculty of Medicine, Imperial
College London, London, United Kingdom, 3 INRA, UMR1331, Toxalim, Research Centre in Food
Toxicology, Toulouse, France, 4 Division of Infection, Immunity and Respiratory Medicine, Faculty of Biology, Medicine and Health, Manchester Academic Health Sciences Centre, University of Manchester and
University Hospital of South Manchester NHS Foundation Trust, Manchester, United Kingdom ‡ These authors are joint senior authors on this work.
*a.custovic@imperial.ac.uk
Abstract
Background
The relationship between allergic sensitisation and asthma is complex; the data about the strength of this association are conflicting. We propose that the discrepancies arise in part because allergic sensitisation may not be a single entity (as considered conventionally) but a collection of several different classes of sensitisation. We hypothesise that pairings between immunoglobulin E (IgE) antibodies to individual allergenic molecules (compo-nents), rather than IgE responses to ‘informative’ molecules, are associated with increased risk of asthma.
Methods and findings
In a cross-sectional analysis among 461 children aged 11 years participating in a popula-tion-based birth cohort, we measured serum-specific IgE responses to 112 allergen compo-nents using a multiplex array (ImmunoCAP Immuno-Solid phase Allergy Chip [ISAC]). We characterised sensitivity to 44 active components (specific immunoglobulin E [sIgE]>0.30 units in at least 5% of children) among the 213 (46.2%) participants sensitised to at least one of these 44 components. We adopted several machine learning methodologies that offer a powerful framework to investigate the highly complex sIgE–asthma relationship. Firstly, we applied network analysis and hierarchical clustering (HC) to explore the connec-tivity structure of component-specific IgEs and identify clusters of component-specific sensi-tisation (‘component clusters’). Of the 44 components included in the model, 33 grouped in
a1111111111 a1111111111 a1111111111 a1111111111 a1111111111 OPEN ACCESS
Citation: Fontanella S, Frainay C, Murray CS, Simpson A, Custovic A (2018) Machine learning to identify pairwise interactions between specific IgE antibodies and their association with asthma: A cross-sectional analysis within a population-based birth cohort. PLoS Med 15(11): e1002691.https:// doi.org/10.1371/journal.pmed.1002691
Academic Editor: Thomas Platts-Mills, University of Virginia, UNITED STATES
Received: May 28, 2018 Accepted: October 8, 2018 Published: November 13, 2018
Copyright:© 2018 Fontanella et al. This is an open access article distributed under the terms of the
Creative Commons Attribution License, which permits unrestricted use, distribution, and reproduction in any medium, provided the original author and source are credited.
Data Availability Statement: Data and code are available athttps://github.com/sfontane/ Interaction-patterns-between-specific-IgE- antibodies-in-molecular-allergy-diagnostics-and-prediction.
Funding: The authors AC and AS received from the Medical Research Council (https://mrc.ukri.org/) with grants MR/L012693/1 and MR/K002449/1. The funders had no role in study design, data
seven clusters (C.sIgE-1–7), and the remaining 11 formed singleton clusters. Cluster mem-bership mapped closely to the structural homology of proteins and/or their biological source. Components in the pathogenesis-related (PR)-10 proteins cluster (C.sIgE-5) were central to the network and mediated connections between components from grass (C.sIgE-4), trees 6), and profilin clusters 7) with those in mite 1), lipocalins (C.sIgE-3), and peanut clusters (C.sIgE-2). We then used HC to identify four common ‘sensitisation clusters’ among study participants: (1) multiple sensitisation (sIgE to multiple components across all seven component clusters and singleton components), (2) predominantly dust mite sensitisation (IgE responses mainly to components from C.sIgE-1), (3) predominantly grass and tree sensitisation (sIgE to multiple components across C.sIgE-4–7), and (4) lower-grade sensitisation. We used a bipartite network to explore the relationship between component clusters, sensitisation clusters, and asthma, and the joint density-based non-parametric differential interaction network analysis and classification (JDINAC) to test whether pairwise interactions of component-specific IgEs are associated with asthma. JDI-NAC with pairwise interactions provided a good balance between sensitivity (0.84) and specificity (0.87), and outperformed penalised logistic regression with individual sIgE com-ponents in predicting asthma, with an area under the curve (AUC) of 0.94, compared with 0.73. We then inferred the differential network of pairwise component-specific IgE interac-tions, which demonstrated that 18 pairs of components predicted asthma. These findings were confirmed in an independent sample of children aged 8 years who participated in the same birth cohort but did not have component-resolved diagnostics (CRD) data at age 11 years. The main limitation of our study was the exclusion of potentially important allergens caused by both the ISAC chip resolution as well as the filtering step. Clustering and the net-work analyses might have provided different solutions if additional components had been available.
Conclusions
Interactions between pairs of sIgE components are associated with increased risk of asthma and may provide the basis for designing diagnostic tools for asthma.
Author summary
Why was this study done?
• The relationship between allergic sensitisation and asthma is complex.
• Asthma prediction models based on the IgE responses to the whole allergen extracts exhibit relatively poor performance.
• This study examines the relationship between IgE responses to multiple allergen compo-nents in component-resolved diagnostics (CRD) and their associations with asthma.
collection and analysis, decision to publish, or preparation of the manuscript.
Competing interests: I have read the journal’s policy and the authors of this manuscript have the following competing interests: CM reports reports honoraria for speaking at Novartis, Astra Zeneca, Thermo Fisher, GSK; being a member of an advisory board for Novartis and GSK; and grants from NIHR, North West Lung Centre Charity, Moulton Charitable Foundation. AS reports research grant funding from Medical Research Council, NIH, National Institute of Health Research, JP Moulton Charitable Foundation and lecture fees from Thermo Fisher Scientific. The other authors have no competing interests to declare.
Abbreviations: AD, atopic dermatitis; AUC, area under the curve; COPD, chronic obstructive pulmonary disease; CRD, component-resolved diagnostics; HC, hierarchical clustering; HDM, house dust mite; IgE, immunoglobulin E; ISAC, ImmunoCAP Immuno-Solid phase Allergy Chip; ISU, ISAC Standardised Unit; JDINAC, joint density-based nonparametric differential interaction network analysis and classification; MDS, multidimensional scaling; NICE, UK National Institute of Health and Care Excellence; OR, odds ratio; PAM, partition around medoids; PR, pathogenesis-related; ROC, receiver operating characteristic; sIgE, specific immunoglobulin E; SPT, skin prick test.
What did the researchers do and find?
• Serum-specific IgE responses to 112 allergen components were measured using a multi-plex array among children in a population-based birth cohort.
• Researchers applied network analysis and hierarchical clustering (HC) to explore the connectivity structure of component-specific IgEs and identified seven clusters of com-ponent-specific sensitisation. Cluster membership mapped closely to the structural homology of proteins and/or their biological source.
• HC identified four ‘sensitisation clusters’ among study participants.
• The relationship between component clusters, sensitisation clusters, and asthma was explored using a bipartite network.
• The differential network of pairwise component-specific IgE interactions was inferred, which demonstrated that interactions among 18 pairs of allergen components predicted asthma with a good balance between sensitivity and specificity. For example, children with IgE antibodies to different allergenic proteins from both dog and cat, or horse and house dust mite, are at higher risk of developing asthma.
What do these findings mean?
• IgE responses to multiple allergenic proteins are functionally coordinated and co-regulated.
• Pairwise interactions within this complex network predict clinical phenotypes. Interac-tions between pairs of sIgE components are associated with increased risk of asthma and provide the basis for designing diagnostic tools for asthma.
Introduction
Asthma is the most common noncommunicable disease in childhood. Over recent decades, a large body of evidence has demonstrated a close relationship between specific
immunoglobu-lin E (sIgE) antibody responses and asthma [1,2], but the data about the strength of this
associ-ation are conflicting [2,3]. Furthermore, in a clinical situation, confirmation of allergic
sensitisation using standard diagnostic tests (skin prick tests [SPTs] and/or measurement of sIgE) does not necessarily indicate that patient’s symptoms are caused by an allergic reaction
[1]. We have previously proposed that these inconsistencies are in part consequent to ‘allergic
sensitisation’ not being a single entity (as considered conventionally) but an umbrella term for a collection of several different classes of sensitisation that differ in their association with asthma and other allergic diseases. To test this, in a previous study we applied a machine learn-ing approach with Bayesian inference to a comprehensive set of skin tests and sIgE data to whole allergen extracts collected from infancy to school age in a population-based birth cohort
[4]. Children clustered into four distinct sensitisation classes characterised by different
pat-terns of responses to specific allergens and the time of onset of sensitisation [4]. The risk of
asthma was increased almost 30-fold amongst children belonging to one of these classes (assigned as ‘Multiple early sensitisation’, comprising less than one third of children diagnosed
as sensitised using conventional definitions). We have replicated these findings in another
birth cohort [5] and have shown that diminished lung function in adolescence and early
adult-hood is associated with ‘Multiple early’, but not other sensitisation classes [6,7].
In food allergy, there is increasing evidence that sensitisation to some, but not all, allergenic proteins in allergen extracts is important for making a distinction between true allergy and
asymptomatic sensitisation [8]. For example, we have shown that immunoglobulin E (IgE)
response to peanut proteinAra h 2 is much more predictive of true peanut allergy than
stan-dard tests using whole allergen extract [9,10]. Measuring sensitisation to these individual
mol-ecules (referred to as allergen components) using component-resolved diagnostics (CRD) may be more informative than standard tests in respiratory allergy, as well. The developments in molecular diagnostics have led to products such as the multiplex Immuno Solid-phase Aller-gen Chip (ImmunoCAP ISAC), in which sIgE to more than 100 allerAller-gen components can be
measured simultaneously [11]. Using a machine learning approach, we have shown that
pat-terns of component-specific IgE responses in this multiplex assay have reasonable
discrimina-tion ability for asthma and rhino-conjunctivitis [12]. In a further study using latent variable
modelling, we identified several cross-sectional clusters of IgE responses in school age
chil-dren, and each of these clusters was associated with different clinical symptoms [13]. Our
sub-sequent study using nested latent class probabilistic modelling has indicated that longitudinal trajectories of sensitisation to several grass and house dust mite (HDM) allergens during
child-hood had different associations with clinical outcomes [14].
Based on these findings, we propose (1) that the impact of allergic sensitisation on asthma is a complex phenomenon that cannot be captured by considering individual allergen sIgE responses separately, or in isolation; and (2) that sIgE responses to multiple allergenic proteins are functionally coordinated and co-regulated, and this complex network of interactions fore-shadows asthma development. Specifically, we hypothesise that interaction patterns between component-specific IgE antibodies rather than individual IgE responses to ‘informative’ com-ponents are associated with risk of asthma. To address our hypothesis, we measured sIgEs to 112 allergen components using a commercially available multiplex array among participants in a population-based birth cohort, and we used unsupervised machine learning techniques to explore how component-specific IgEs interact with each other and to identify common sensiti-sation profiles among children. We then used a supervised machine learning approach to explore interactions of component-specific IgEs in relation to asthma.
Materials and methods
Study design, setting, and participants
The Manchester Asthma and Allergy Study is a population-based birth cohort [15].
Participat-ing families were recruited from the maternity catchment area of Wythenshawe and SteppParticipat-ing
Hill Hospitals in South Manchester and Cheshire, United Kingdom [15]. All pregnant women
were screened for eligibility at antenatal visits (8th–10th week of pregnancy) between 1 Octo-ber 1995 and 1 July 1997. Of the 1,499 women and their partners who met the inclusion crite-ria, 288 declined to take part in the study, and 27 were lost to follow-up between recruitment and childbirth. The study was approved by the Research Ethics Committee and parents gave written informed consent.
Data sources/Measurement and definition of outcomes
Children attended review clinics at ages 1, 3, 5, 8, 11, and 16 years. Validated questionnaires were interviewer administered to determine parentally reported history of wheeze, eczema, and rhinitis, and treatments received. SPT was used to ascertain atopic sensitisation to
common inhalant and food allergens, and lung function measurements were obtained using spirometry at all visits from age 5 years. A blood sample was collected in children who gave
assent for venepuncture [16]. Primary care medical records were examined and data including
wheeze episodes, prescriptions of asthma medications and oral corticosteroid, and hospitalisa-tions were extracted.
In this study, we performed a cross-sectional analysis using data collected at age 11 years. ‘Current wheeze’ was defined as a positive answer to the question, ‘Has your child had
wheezing or whistling in the chest in the last 12 months?’ [17] ‘Current asthma’ was defined as
a positive answer to two out of three of: ‘Has the doctor ever told you that your child had asthma?’; ‘Has your child had wheezing or whistling in the chest in the last 12 months?’; and
‘Has your child had asthma treatment in the last 12 months?’ [18]. Further details of follow-up
and definitions of clinical outcomes are presented in the supplementary appendix (S1
Appendix).
CRD
We measured sIgE to 112 allergenic molecules using ImmunoCAP ISAC (Thermo Fisher Sci-entific-Phadia AB, Uppsala, Sweden) at the follow-up at age 11 years. The level of component-specific IgE antibodies was reported in ISAC Standardised Units (ISU). To ascertain co-occur-ring sensitisations among participants, we dichotomised IgE data according to the manufac-turer’s guidelines, using a binary threshold (positive>0.30 ISU). To evaluate the differential connectivity structure of component-specific IgEs, we used continuous raw values.
Statistical learning
In this cross-sectional analysis, we included all children with available CDR data. We analysed data for components with sIgE>0.30 ISU in at least 5% of children (active components) and
among participants with at least one active component sIgE>0.30 ISU (filtering) [19]. A
flow-chart describing the analysis steps involved in this study is presented inS1 Fig.
Statistical grouping of allergen components and their connectivity
structure: Component clusters
We investigated patterns of sIgE co-expression using hierarchical clustering (HC), which transforms a distance matrix into a nested series of partitions that can be represented through a treelike graph (dendogram). By exploring this graph, one can obtain useful information on the hierarchy of the clusters and their similarities. At the lowest level of the hierarchy, each cluster contains a single observation. At the highest level, there is only one cluster containing all of the data. HC algorithms can follow an agglomerative or a divisive approach. Agglomera-tive strategies start at the bottom and at each level recursively merge a selected pair of clusters into a single cluster. This produces a grouping at the next higher level with one fewer cluster. The pair chosen for merging consist of the two groups with the smallest intergroup dissimilar-ity. Divisive methods start at the top and at each level recursively split one of the existing clus-ters at that level into two new clusclus-ters. The split is chosen to produce two new groups with the
largest between-group dissimilarity. With both paradigms there areN−1 levels in the hierarchy
[20]. In our analysis, we used the agglomerative procedure combined with the average linkage
method, which defines the distance between two clusters as the average distance between each point in one cluster to every point in the other cluster.
Compared with partitional clustering, HC techniques do not require one to fix the number of clusters a priori, can find different levels of similarity between the sIgE components within
the hierarchy of clusters, and, hence, can highlight different patterns of connectivity and bio-logical properties.
Distances between sIgE components were expressed by means of the distance correlation
matrix [21]. The advantage of using distance correlation is that it is capable of detecting
non-linear relationships. We then used network analysis to visualise the connectivity structure of sIgEs.
Final partitions can significantly differ according to the chosen clustering approach. Hence, to evaluate the robustness of our findings, we compared the retrieved clusters with partitions obtained through a divisive HC procedure and a partitional clustering technique using the
Rand index [22].
Patterns of sensitisation among study participants: Sensitisation clusters
To identify patterns of sensitisation among children, we used an HC approach combined with
Ward’s linkage [23] and the Jaccard distance between binary responses to sIgE profiles. At
each iteration of the clustering algorithm, the Ward’s method joins the clusters so that the total within-cluster variance is minimised. Ward’s linkage is conservative, monotone, correctly
infers the hidden structure within the data, and often outperforms the other approaches [24,
25]. We usedχ2and Kruskal–Wallis tests to evaluate the associations between the identified
clusters and clinical outcomes.
Differential sIgE co-expression patterns in asthma
We used a bipartite network to visually explore the relationship between component clusters, sensitisation clusters, and asthma. We investigated whether sIgE to individual components is associated with the risk of asthma using a penalised logistic regression model. To test the hypothesis that pairwise interactions of component-specific IgEs are associated with asthma, we used joint density-based nonparametric differential interaction network analysis and
classi-fication (JDINAC) [26]. We utilised this recently developed nonparametric model to identify
differential interaction patterns of network activation of sIgEs that are most closely related to asthma, and to build a classification model using the network biomarkers. JDINAC has the advantage of capturing nonlinear relations between component-specific IgEs without the need for parametric assumption on their probability distribution.
The main assumption of the JDINAC model is that network-level difference between chil-dren who have asthma and chilchil-dren who do not have asthma arises from the collective effect of differential pairwise component IgE interactions. Here, the interactions are characterised by
the conditional joint density of pairs of component-specific IgEs [26], estimated through a
nonparametric kernel method. Formally, let Xn×pbe the data matrix ofn individuals and p
sIgE allergens. Hence,Xl,l = 1,. . .,n, represents the level of sIgEs in the l-th child. Let Yldenote
the binary variable defined as follows: Yl¼
0 if l is non asthmatic
1 if otherwise
(
LetP denote the probability of having asthma, P = Pr(Yl= 1), andGidenote thei-th sIgE.
Then, JDINAC logistic regression-based approach can be exploited to test the model: logitðPÞ ¼ a0þ Xp i¼1 X j>i bijlnf 1 ijðGi;GjÞ f0 ijðGi;GjÞ ;s:t:X p i¼1 X j>i bij�c; c > 0 wheref1 ijðGi;GjÞ andf 0
and class 0, respectively. The conditional joint densitiesf1
ijðGi;GjÞ indicate the strength of
asso-ciation betweenGiandGjin class 1, and parametersβijindicate differential dependency
pat-terns between condition-specific groups [26]. The estimation procedure is based on a multiple
splitting and prediction averaging procedure, which guarantees robust and accurate results.
The data are split in two parts. On the first part, joint kernel density functions, ^f1
ijand ^f
0
ij, are
estimated, while on the second part,L1penalised logistic regression is fitted. The procedure is
repeated for a predefined number of iterations (for estimation details and algorithm, see [26]).
To ensure robustness of the results, we ran both models with 10-fold cross validation in 50 independent repetitions. To reduce the effect of imbalanced data, we included class weight in both models. sIgE raw values were log-transformed (log(x+1)) prior to these analyses.
Validation
To evaluate the robustness of our results and provide external narrow validation [27], we repeated
the analysis among cohort participants who had ISAC CRD data at age 8 years, excluding the chil-dren whose data were used in the primary analysis at age 11 years. For chilchil-dren in the validation step, both CDR data and clinical outcomes were ascertained at age 8 years.
All statistical analyses were run in the programming language R [28]. Distance correlation
was computed with the packageenergy [29]. JDINAC scripts were made available by the
authors [26] athttps://github.com/jijiadong/JDINAC. We usedigraph package for network
visualisations [30],epitools to estimate the odds ratio (OR) [31],clValid to compute internal
validity measures for HC [32], andcaret to infer the penalised logistic regression model [33].
Results
Participant flow and demographic data
Among 1,184 children born into the cohort, 822 attended clinical follow-up at age 11 years. CRD data were obtained for 461 (56.1%) children. Demographics of these 461 participants are
presented inS1 Table; we have also previously reported that there were no significant
differ-ences in demographic characteristics or outcomes between cohort members with and without
CRD [13]. Of 461 children with CRD, 221 (47.9%) had positive sIgE to at least one of the 112
allergen components [13], and 94 (20.4%) had current asthma. After filtering [19], 44/112
allergen components were active; 213 (46.2%) children had at least one of the active compo-nent IgEs >0.30 ISU, 73 (34.3%) of whom had asthma. The list of compocompo-nents that were
inac-tive [19] and the proportion of children who had positive sIgE to these ‘rare’ components are
presented inS2 Table.
There was a significant difference in the total number of positive component-specific IgEs between children who have asthma and children who do not have asthma, with children who have asthma responding to more allergens than children who do not have asthma (median 11
[IQR: 6–18] versus 6 [IQR: 3–10 ],p<0.001,S2 Fig). The responses to individual components
stratified by disease status did not show considerable differences between sensitised children
with and without asthma (Fig 1). However, we highlight an increase in the positive responses
to some allergenic proteins among children who have asthma, particularly group 2 HDM
com-ponents and furry animal lipocalins (S3 Table).
Statistical grouping of allergen components (component clusters) and their
connectivity structure
Of the 44 allergen components included in the model, 33 grouped in seven component clusters
clusters was determined by fixing the threshold for the dissimilarity measure (1−distance cor-relation) equal to 0.40, which ensured high similarity between the components.
We compared the adopted model with the divisive HC clustering DIANA (Divise Analysis)
[34], and the partition around medoids (PAM) [34] algorithm. The Rand index, 0.99 for
DIANA and 0.98 for PAM, suggested that the obtained groups were stable and robust. Internal
validity indices also showed that cluster membership was very stable (S3 Fig).
C.sIgE-1 was composed exclusively of HDM components (Group 1 and 2 HDM allergens); C.sIgE-2 of peanut components associated with true peanut allergy (2S albumins and 7S
globu-lin) [9]; C.sIgE-3 of lipocalins from cat, dog, horse, and mouse; C.sIgE-4 of grass components;
C.sIgE-5 of PR-10 proteins from various sources; C.sIgE-6 of tree allergens; and C.sIgE-7 of
Fig 1. Patterns of sensitisations stratified by asthma status. Participants are represented in columns and sIgE components in rows. A black square indicates that a participant has a sIgE>0.30 to a particular allergen component. sIgE, specific immunoglobulin E.
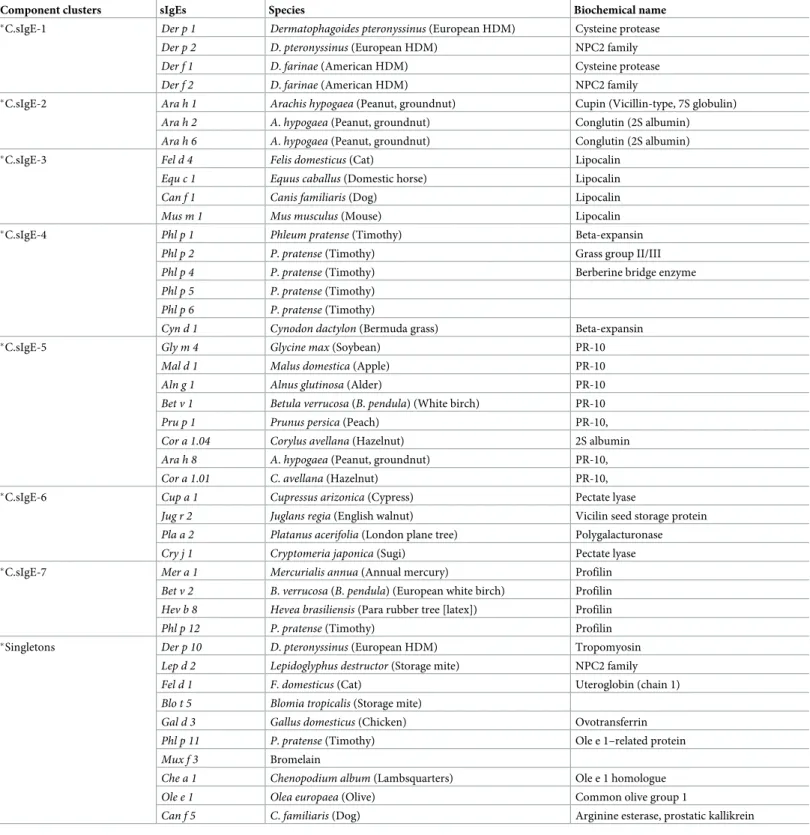
Table 1. Component-specific IgE clusters membership.
Component clusters sIgEs Species Biochemical name
�C.sIgE-1 Der p 1 Dermatophagoides pteronyssinus (European HDM) Cysteine protease
Der p 2 D. pteronyssinus (European HDM) NPC2 family Der f 1 D. farinae (American HDM) Cysteine protease Der f 2 D. farinae (American HDM) NPC2 family
�C.sIgE-2 Ara h 1 Arachis hypogaea (Peanut, groundnut) Cupin (Vicillin-type, 7S globulin)
Ara h 2 A. hypogaea (Peanut, groundnut) Conglutin (2S albumin) Ara h 6 A. hypogaea (Peanut, groundnut) Conglutin (2S albumin)
�C.sIgE-3 Fel d 4 Felis domesticus (Cat) Lipocalin
Equ c 1 Equus caballus (Domestic horse) Lipocalin Can f 1 Canis familiaris (Dog) Lipocalin Mus m 1 Mus musculus (Mouse) Lipocalin
�C.sIgE-4 Phl p 1 Phleum pratense (Timothy) Beta-expansin
Phl p 2 P. pratense (Timothy) Grass group II/III Phl p 4 P. pratense (Timothy) Berberine bridge enzyme Phl p 5 P. pratense (Timothy)
Phl p 6 P. pratense (Timothy)
Cyn d 1 Cynodon dactylon (Bermuda grass) Beta-expansin
�C.sIgE-5 Gly m 4 Glycine max (Soybean) PR-10
Mal d 1 Malus domestica (Apple) PR-10 Aln g 1 Alnus glutinosa (Alder) PR-10 Bet v 1 Betula verrucosa (B. pendula) (White birch) PR-10 Pru p 1 Prunus persica (Peach) PR-10, Cor a 1.04 Corylus avellana (Hazelnut) 2S albumin Ara h 8 A. hypogaea (Peanut, groundnut) PR-10, Cor a 1.01 C. avellana (Hazelnut) PR-10,
�C.sIgE-6 Cup a 1 Cupressus arizonica (Cypress) Pectate lyase
Jug r 2 Juglans regia (English walnut) Vicilin seed storage protein Pla a 2 Platanus acerifolia (London plane tree) Polygalacturonase Cry j 1 Cryptomeria japonica (Sugi) Pectate lyase
�C.sIgE-7 Mer a 1 Mercurialis annua (Annual mercury) Profilin
Bet v 2 B. verrucosa (B. pendula) (European white birch) Profilin Hev b 8 Hevea brasiliensis (Para rubber tree [latex]) Profilin Phl p 12 P. pratense (Timothy) Profilin
�Singletons Der p 10 D. pteronyssinus (European HDM) Tropomyosin
Lep d 2 Lepidoglyphus destructor (Storage mite) NPC2 family Fel d 1 F. domesticus (Cat) Uteroglobin (chain 1) Blo t 5 Blomia tropicalis (Storage mite)
Gal d 3 Gallus domesticus (Chicken) Ovotransferrin Phl p 11 P. pratense (Timothy) Ole e 1–related protein Mux f 3 Bromelain
Che a 1 Chenopodium album (Lambsquarters) Ole e 1 homologue Ole e 1 Olea europaea (Olive) Common olive group 1
Can f 5 C. familiaris (Dog) Arginine esterase, prostatic kallikrein Abbreviations: HDM, house dust mite; IgE, immunoglobulin E; PR, pathogenesis-related.
profilins. The HC highlighted the structural relationships of the allergen components within protein families.
The co-expression network inFig 2shows the interactions and underlying connectivity
structure of component-specific IgEs. The connectivity expresses how sIgE components are correlated and co-regulated with each other. Components belonging to the PR-10 (C.sIgE-5) cluster were central to the network, showing higher connectivity than other components; com-ponents in this cluster seem to mediate connections between comcom-ponents from grass (C.sIgE-4), tree (C.sIgE-6), and profilin (C.sIgE-7) clusters with components in HDM (C.sIgE-1),
lipo-calins (C.sIgE-3), and peanut clusters (C.sIgE-2).Alt a 1 and Blo t 5 were weakly connected to
other component-specific IgEs. Components in the HDM cluster showed high intraclass connectivity.
Characteristics of sensitisation profiles (sensitisation clusters) among study
participants
The structure of sensitisation profiles among study participants was inferred in a completely unsupervised manner, with the optimal solution suggesting four sensitisation clusters (based
on the Calinski-Harabasz criterion [35]). Cluster membership was stable (S4 Fig). In the
Fig 2. Component-specific IgE network and hierarchical cluster reveal connectivity structure in sIgE. The network consists of a set of nodes, joined in pairs by lines or edges. Colours represent cluster memberships and node diameter is proportional to the scaled connectivity of each sIgE, while edge colour and width represent the strength of connection between pairs of sIgE components. IgE, immunoglobulin E; sIgE, specific immunoglobulin E.
model comparisons, the Rand index showed moderate agreement with the partition obtained with DIANA (0.53) and good agreement with the partition obtained with PAM (0.79).
After visual inspection of the patterns (Fig 3), we labelled these four sensitisation profiles as
(1) Multiple sensitisation, with positive sIgE to multiple components across all seven compo-nent clusters (C.sIgE-1–7) and singleton compocompo-nents; (2) Predominantly HDM sensitisation, with IgE responses mainly to components from C.sIgE-1; (3) Predominantly grass and tree sensitisation, with positive sIgE to multiple components across C.sIgE-4–7; and (4) Lower-grade sensitisation.
Association with clinical outcomes (asthma, rhinitis, and atopic dermatitis [AD]) differed
for different sensitisation profiles (S4 Table,S5 Table). Children in the HDM cluster were
more likely to have asthma (OR: 4.44; 95% CI: 1.72–11.46;p = 0.002) and wheeze (OR: 7.31;
95% CI: 2.74–19.48;p < 0.001), but not rhinitis or AD, while those in the grasses/trees cluster
were more likely to have rhinitis (OR: 6.62; 95% CI: 2.84–15.40;p < 0.001). Membership of
the Multiple sensitisation cluster was associated with the highest risk of asthma (OR: 4.97; 95%
CI: 1.99–12.34;p < 0.001) and a high risk of wheeze (OR: 4.41; 95% CI: 1.70–11.41; p < 0.001)
Fig 3. Patterns of IgE responses to allergen components for individual participants. Rows represent sIgEs, while columns indicate children. Colours represent sensitisation clusters’ membership. Squares are coloured if and only if a child has a positive response, <0.30 to a particular sIgE. IgE, immunoglobulin E; sIgE, specific immunoglobulin E.
and rhinitis (OR: 6.18; 95% CI: 2.71–14.12;p < 0.001) (S5 Table). No significant associations
were found with lung function measurements (S6 Table).
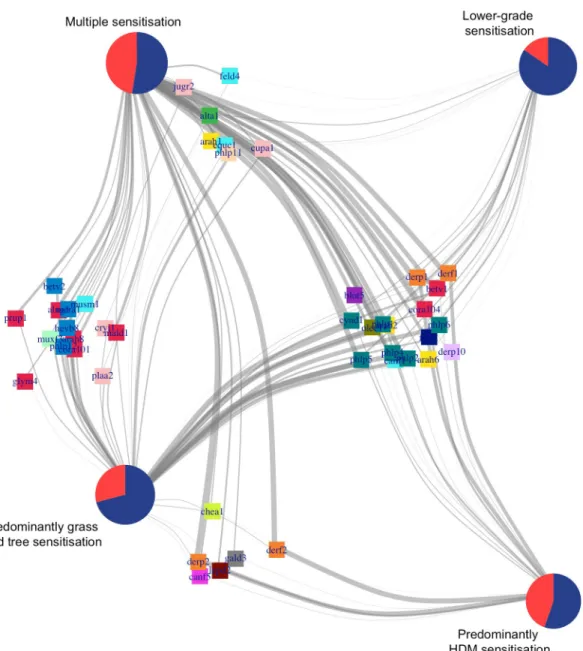
Differential sIgE co-expression patterns in the prediction of asthma
Fig 4summarises the relationship between sensitisation clusters and asthma, and the connec-tivity with component-specific IgEs and component clusters. Although a significantly higher proportion of children with asthma was found in the Multiple sensitisation and HDM clusters,Fig 4. Bipartite network to uncover the relationship between sensitisation clusters and asthma, and the connectivity with component-specific IgEs and component clusters. In the bipartite network, nodes represent one or more types of entities, and edges between the nodes represent a specific relationship between the entities. Here, pie charts represent individuals aggregated according to sensitisation cluster membership and asthma status. Red indicates children with asthma, while blue indicates no asthma. Squares represent sIgE allergens and colours represent cluster membership. Edges show whether a subject has a positive response to a particular c-sIgE. MDS layout was used to infer the network. HDM, house dust mite; IgE, immunoglobulin E; MDS, multidimensional scaling; sIgE, specific immunoglobulin E.
the majority of children in each of the sensitisation clusters did not have asthma. All clusters shared similar connection to some component clusters (C.sIgE-3 and C.sIgE-4), but we observed distinct patterns of connectivity between the cluster with a higher proportion of chil-dren with asthma compared with those with a higher proportion of chilchil-dren who did not have asthma. Specifically, only children in Multiple sensitisation and Predominantly HDM clusters were strongly connected to the allergens in C.sIgE-1, while children in Predominantly grasses/ trees and Lower-grade sensitisation clusters were distinctively connected to C-sIgE-2.
S5 Figshows examples of bipartite subnetworks of a subset of component clusters. Panel A shows the connectivity between a set of informative components in the lipocalin cluster (C.
sIgE-3) withFel d 1. The analysis has shown that children with connection to only one sIgE
were not at higher risk of asthma, but those who were connected to two or more components were at increased risk of having asthma. Similar behaviours are observed for all the other net-works, apart from interactions involving the grass IgE cluster (C.sIgE-4).
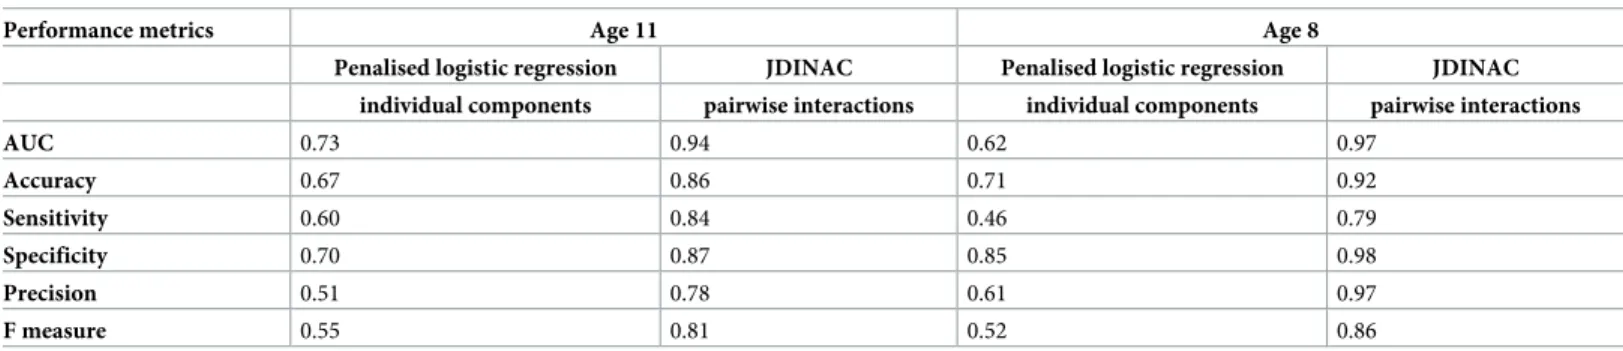
To investigate whether individual components sIgE or pairwise interactions of component-specific IgEs are stronger associates of asthma, we compared the performances of penalised
logistic regression and JDINAC in classifying asthma (Table 2). In the multivariate logistic
regression model, we include all the 44 individual components as predictors. To improve
com-parability between the two models, a penalty on theL1-norm was included in the logistic
model.
Penalised logistic regression with individual components had poor performance, with low sensitivity (0.60) and moderate specificity (0.70). It did not provide an efficient classification rule. In contrast, JDINAC provided a good balance between sensitivity (0.84) and specificity (0.87). Results from 10-fold cross validation in 50 independent repetitions on the whole data set showed that JDINAC with pairwise interaction outperformed penalised logistic regression with individual components, with area under the curve (AUC) equal to 0.94, compared with
0.73 (Fig 5).
These results suggest that the interactions between pairs of sIgE are more informative than the individual components in asthma classification.
We then proceeded to infer the differential network of pairwise component-specific IgE interactions that predict asthma by connecting the sIgEs pairs with high differential
depen-dency weights (defined as the number of repetitions in which ^bij6¼ 0). A total of 18 pairs of
component-specific IgEs exhibited a significant differential interaction between children who
have asthma and children who do not have asthma (Fig 6). The network emphasises
Table 2. Evaluation and comparison of prediction performances of logistic regression based on individual components and JDINAC based on pairwise interactions of sIgE allergens.
Performance metrics Age 11 Age 8
Penalised logistic regression JDINAC Penalised logistic regression JDINAC individual components pairwise interactions individual components pairwise interactions
AUC 0.73 0.94 0.62 0.97 Accuracy 0.67 0.86 0.71 0.92 Sensitivity 0.60 0.84 0.46 0.79 Specificity 0.70 0.87 0.85 0.98 Precision 0.51 0.78 0.61 0.97 F measure 0.55 0.81 0.52 0.86
Abbreviations: AUC, area under the curve; JDINAC, joint density-based nonparametric differential interaction network analysis and classification; sIgE, specific immunoglobulin E.
multisource connections. HDM and animal components, which were central to the network, showed higher connectivity than other components. The interactions between the grass-related sIgEs (Phl p 2 and Phl p 12) and between Lep d 2 and Fel d 1 were linked to a healthy state. In contrast, the remaining pairwise interactions were linked to asthma. The connections
betweenFel d 1 and Can f 1, Der p 1 and Equ c 1, and Der f 2 and Der p 1 had a strong impact
on the prediction results because of the higher differential weights.
External narrow validation. Of 899 children who attended follow-up at age 8 years, CRD data were obtained for 543 (60.4%). After removing 266 children who had CRD data at age 11
and were hence involved in the previous analyses (S1 Fig), 226 (41.6%) participants were
included in the validation set. The filtering procedure resulted in a final sample composed of 108 children who had at least one of the 31 active components >0.30 ISU, of whom 37 (34.2%) had asthma at follow-up at age 8. A flowchart of participants included in the primary analysis
and validation is presented inS6 Fig.
JDINAC and penalised logistic regression were run with 10-fold cross validation in 50
inde-pendent repetitions. Results were consistent with primary analyses (Table 2) in that penalised
logistic regression had low sensitivity (0.46) and high specificity (0.85), whereas JDINAC pro-vided a good balance between sensitivity (0.79) and specificity (0.98). JDINAC had superior
performance in classifying asthma, with AUC of 0.97 compared with 0.62 (Fig 5). Most
Fig 5. ROC curves for JDINAC and penalised logistic regression. The curves were obtained through the prediction averaging procedure on 50 independent repetitions combined with of 10-fold cross validation. JDINAC, joint density-based nonparametric differential interaction network analysis and classification; ROC, receiver operating
characteristic.
differential pairwise component-specific IgE interactions previously found were confirmed (Fig 7). In particular, pairwise interactions between HDM and animal components had higher differential weights and hence a strong impact on the prediction result, while connectivity between IgE to grass- and tree-related components showed protective pairwise interactions.
Discussion
Key findings
Our study suggests that the relationship between allergic sensitisation and asthma is complex and cannot be fully captured or explained by considering sIgE responses to any individual allergenic molecule(s). In contrast to IgE-mediated food allergy, in which sensitisation to a limited number of ‘informative’ allergenic proteins differentiates between true food allergy
and asymptomatic sensitisation (such asAra h 2 in peanut allergy) [9], we did not identify
such ‘informative’ component(s) as a hallmark of an increased risk of asthma. By clustering component-specific IgE responses only (i.e., not the children), we identified seven clusters of component-specific sensitisation, with cluster membership mapped closely to the structural homology of proteins and their biological source. By clustering study participants, we identi-fied four sensitisation clusters that were characterised by unique patterns of sensitisation to allergenic molecules from different component clusters. In this study, the analysis of the
Fig 6. Differential pairwise component-specific IgE interactions in asthma estimated by JDINAC. The presence of an edge presented in the differential network means that the dependency of corresponding pair sIgEs is different between those who have asthma and those who do not have asthma. The edge colour indicates the direction of association. Red: interaction linked to asthma presence; green: interaction linked to reduced risk of asthma. Edge width is proportional to differential weight. Only pairs of sIgEs that were significantly associated to the risk of asthma in 25% of the validation runs were included in the network. IgE, immunoglobulin E; JDINAC, joint density-based nonparametric differential interaction network analysis and classification; sIgE, specific immunoglobulin E.
relationship between component clusters, sensitisation clusters, and asthma revealed that the key associate of asthma was the interaction between component-specific IgEs, indicating that the important feature of IgE response linked to an increased risk of asthma is not individual IgE to any informative component(s), but the pattern of interactions between component-spe-cific IgEs. Further analyses revealed a differential network of pairwise interactions between a limited number of component-specific IgEs from different component clusters, which pre-dicted asthma with a good balance between sensitivity and specificity. In this study, we found that amongst sensitised children, some of these connectivities were associated with an
increased risk of asthma (e.g., betweenFel d 1 and Can f 1, Der p 1 and Equ c 1), while others
decreased the risk (e.g., between sIgEs to grass componentsPhl p 1 and Phl p 5).
Limitations
One of the limitation of our study is that there may be a number of potentially important aller-gens that are not included on the ISAC chip (e.g., those from fungi), and it is possible that the
clustering would provide different solutions if additional components had been available [13].
We acknowledge that our analysis identified only pairwise interactions, and that the relation between asthma and the connectivity structure of sIgE may be more complex. Hence, higher-order interactions will need to be investigated in the future. Furthermore, because of the itera-tive nature of the JDINAC estimation procedure, we could not estimate the association strength of the differential pairwise interactions. The interpretation is therefore limited to the direction of the association, and further improvements in model design and further validations are needed to fully capitalise on the potential of these findings.
Fig 7. Differential pairwise component-specific IgE interactions in asthma estimated by JDINAC on the 8-year-old children data set. IgE, immunoglobulin E; JDINAC, joint density-based nonparametric differential interaction network analysis and classification; sIgE, specific immunoglobulin E.
We acknowledge that through our filtering process [19], some potentially important aller-gens may have been excluded. However, the filtering process was necessary to moderate the effect of measurement errors and noise. Zero-inflated variables can reduce accuracy and use-fulness of a cluster analysis, as well as the reliability of the prediction model results. Filtering also increased the confidence of discovering significant association between sIgEs and clinical outcomes of interest. However, we cannot rule out that, despite their rarity, some of the ‘inac-tive’ components might be associated with asthma and that the inclusion of inactive compo-nents might have resulted in different clusters and classification results. We also acknowledge that our findings do not take into account potentially important factors, such as gender and ethnicity, and that they are derived and validated in the same birth cohort (although among different study participants). Therefore, further validations in external populations are needed to ascertain the generalisability of our findings and to evaluate the presence of population-spe-cific characteristics.
Interpretation
In our previous study using machine learning techniques, we identified three patterns of IgE responses to multiple allergens in the same study population, and each of these patterns was
associated with different risk for having asthma [13]. In the current study, we identified seven
component clusters that mapped closely to the structural homology of proteins and their bio-logical source (PR-10 proteins, profilins, lipocalins, peanut, grass, trees, and mite clusters). These patterns can be explained by the structural relationships of the allergen components within protein families. The current analysis provided considerably finer granularity com-pared with our previous analysis, which used Expectation Propagation algorithm implemented inInfer.NET[13]. One possible explanation may be that current methodologies were able to uncover nonlinear relations between the components. Our findings of component clusters are consistent with previous observations that sensitised individual may have detectable IgE to
multiple members of the same protein family [36]. For example, one previous study has shown
a direct relationship between different representative molecules within three ’panallergen’ groups (tropomyosins, profilins, and PR-10s) but little evidence of sensitisation to more than
one panallergen [36]. In contrast, our study using a machine learning approach has shown
that the PR-10 proteins cluster was central to the network of connectivities and mediated con-nections between components from other clusters.
Using CRD, several studies have shown that sensitisation to component-specific IgEs is an
important risk factor for asthma [37–39]. However, most current guidelines do not
recom-mend assessment of allergic sensitisation as an objective test for asthma diagnosis. This is not surprising, given that in respiratory allergy, the interpretation of SPTs and blood tests that measure specific serum IgE to whole allergen extracts traditionally relies on arbitrary cutoffs (e.g., SPTs > 3 mm, sIgE > 0.35 kUA/L), which have a relatively poor ability to distinguish
between benign sensitisations and clinically relevant (‘pathologic’) sensitisation [1,2]. For
example, UK National Institute of Health and Care Excellence (NICE) guidance on the diag-nosis of childhood asthma proposes a diagnostic algorithm that incorporates the sequential use of four measures of lung function and inflammation (spirometry, bronchodilator
revers-ibility, fractional exhaled nitric oxide, and peak flow variability,https://www.nice.org.uk/
guidance/ng80). We have recently tested the NICE algorithm in a cross-sectional analysis amongst children in our birth cohort aged 13–16 years and found poor agreement between the algorithm and asthma diagnosis; adherence to the algorithm resulted in a substantial number of false positive diagnoses, and the majority of children with asthma were not identified as
diagnosis of asthma in children, and using any objective test for diagnosing childhood asthma
remains challenging [41]. One important question is whether incorporation of better tests or
interpretation algorithms for the assessment of allergic sensitisation would improve diagnostic algorithms for asthma, both in terms of confirming asthma diagnosis and for the assessment of future risk (e.g., of asthma exacerbations or disease persistence). The results of our current
study support our notion that ‘allergic sensitisation’ is heterogeneous [4], and provide further
evidence that there are several distinct subgroups of sensitisation that differ in their association with asthma. In our previous studies, which used machine learning to investigate patterns of skin test and IgE data to whole extracts of eight major allergens collected at multiple time points throughout childhood, we have shown that some, but not all, classes of sensitisation are
associated with asthma presence, progression, and severity [4,5]. However, these subtypes
(clusters/classes) of allergic sensitisation have been identified using statistical inference on
large amounts of data collected over long periods [4,5], and their differentiation at any single
cross-sectional point was not possible [42,43]. Therefore, these observations could not be
translated into clinical practice, in which a physician sees a patient at a single time point. It is clear that disaggregation of sensitisation, and knowing which subtype a patient belongs to, may help clinicians predict whether a sensitised patient is likely to have asthma. Our current analysis provides evidence that by using machine learning–based methodologies on CRD data, we can develop better diagnostic algorithms to help practicing physicians differentiate between
benign and clinically important allergic sensitisation to help asthma diagnosis [44]. It is of
note that our previous studies, which used machine learning but incorporated measures of sensitisation using whole allergen extracts (rather than CRD), were markedly inferior in
pre-dicting asthma [12,45]. Furthermore, compared with our previous studies, in which
predic-tion models correctly classified only one state [12,45], JDINAC correctly distinguished
between children who have asthma and children who do not have asthma.
Another important question is whether similar approaches on CRD data can be used for the assessment of future risk (e.g., of asthma exacerbations) and the prediction of asthma persistence and later-life lung function and chronic obstructive pulmonary disease
(COPD) outcomes [6,7]. In two population-based birth cohorts from the UK and Sweden,
we have recently shown IgE reactivity to a limited number of components in preschool
identified children at high risk of asthma in adolescence [46]. Persistent asthma at age 16
years in Sweden was predicted by IgE reactivity in early life to four risk molecules (peanut Ara h 1, birch Bet v 1, cat Fel d 1, and grass Phl p 1), whilst in the UK, similar association
was observed for five allergenic components (dust miteDer p 1 and Der f 2, timothy grass
Phl p 1 and Phl p 5, and cat Fel d 1) [46]. We have also shown that different longitudinal trajectories of sensitisation to allergenic molecules from timothy grass and HDM during
childhood had different associations with subsequent asthma [14]. These data suggest that
understanding developmental pathways of IgE responses to multiple allergenic compo-nents may help development of prognostic algorithms for asthma. To address this, we recently applied novel machine learning techniques to CRD sensitisation data throughout childhood to describe the architecture of the evolution of IgE responses to >100 allergen
components from infancy to adolescence [19]. This analysis has shown that the timing of
onset of specific patterns of sensitisation may be a key indicator of the subsequent risk. The above studies show that better resolution of longitudinal patterns of sensitisation to multiple allergenic components may facilitate the development of prognostic algorithms that can be used for the prediction of future risk of asthma. Based on the current results, we propose that the pattern of interactions between component-specific IgEs may provide additional valuable information.
Conclusion
Our findings suggest that sIgE responses to multiple allergenic proteins are functionally coor-dinated and co-regulated, and that the patterns of interactions within this complex network may predict clinical phenotypes. In this study, we found that interactions between a limited set of component-specific sIgEs, rather than individual ‘informative’ components, are associated with increased risk of asthma and may provide the basis for designing diagnostic tools. We need to fundamentally rethink the way we interpret data obtained using CRD and move away from the focus on individual component-specific IgEs to a more holistic approach that takes into account the patterns of connectivity between IgEs.
Supporting information
S1 Appendix. Further details on data sources/measurement and definition of outcomes. (DOCX)
S1 Table. Characteristics of children IgE data at age 11 years. IgE, immunoglobulin E. (DOCX)
S2 Table. Allergen components to which fewer than 5% of children reacted (inactive com-ponents).
(DOCX)
S3 Table. IgE responses to 44 active components, and differences in the proportion of sen-sitised children between children who have asthma and children who do not have asthma. IgE, immunoglobulin E.
(DOCX)
S4 Table.χ2test to evaluate the association between clinical outcomes and cluster member-ship.
(DOCX)
S5 Table. Relative risk for association between clinical outcomes and cluster membership. (DOCX)
S6 Table. Kruskal–Wallis test to evaluate the association between lung function measures and cluster membership.
(DOCX)
S1 Fig. Flowchart of the analysis steps involved in the study. (TIF)
S2 Fig. Distribution of the total number of positive IgE responses to 112 components strat-ified by asthma status. IgE, immunoglobulin E.
(TIF)
S3 Fig. Statistical grouping of allergen components: cluster stability. (TIF)
S4 Fig. Patterns of sensitisation among study participants: Cluster stability. (TIF)
S5 Fig. Bipartite subnetworks of a subset of sIgE clusters. sIgE, specific immunoglobulin E. (TIF)
S6 Fig. Flowchart of participants in both primary analysis and validation. (TIF)
Author Contributions
Conceptualization: Sara Fontanella, Angela Simpson, Adnan Custovic. Data curation: Sara Fontanella, Clare S. Murray.
Formal analysis: Sara Fontanella, Cle´ment Frainay. Funding acquisition: Angela Simpson, Adnan Custovic. Investigation: Angela Simpson, Adnan Custovic. Visualization: Sara Fontanella, Cle´ment Frainay.
Writing – original draft: Sara Fontanella, Angela Simpson, Adnan Custovic.
Writing – review & editing: Sara Fontanella, Cle´ment Frainay, Clare S. Murray, Angela Simp-son, Adnan Custovic.
References
1. Custovic A, Lazic N, Simpson A. Pediatric asthma and development of atopy. Current opinion in allergy and clinical immunology. 2013; 13(2):173–80.https://doi.org/10.1097/ACI.0b013e32835e82b6PMID: 23385287
2. Oksel C, Custovic A. Development of allergic sensitization and its relevance to paediatric asthma. Cur-rent Opinion in Allergy and Clinical Immunology. 2018; 18(2):109–116.https://doi.org/10.1097/ACI. 0000000000000430PMID:29389732
3. Pearce N, Pekkanen J, Beasley R. How much asthma is really attributable to atopy? Thorax. 1999; 54 (3):268–272.https://doi.org/10.1136/thx.54.3.268PMID:10325905
4. Simpson A, Tan V, Winn J, Svense´n M, Bishop C, Heckerman D, et al. Beyond Atopy, Multiple Patterns of Sensitization in Relation to Asthma in a Birth Cohort Study. American Journal of Respiratory and Criti-cal Care Medicine. 2010; 181(11):1200–1206.https://doi.org/10.1164/rccm.200907-1101OCPMID: 20167852
5. Lazic N, Roberts G, Custovic A, Belgrave D, Bishop C, Winn J, et al. Multiple atopy phenotypes and their associations with asthma: similar findings from two birth cohorts. Allergy. 2013; 68(6):764–770. https://doi.org/10.1111/all.12134PMID:23621120
6. Belgrave D, Buchan I, Bishop C, Lowe L, Simpson A, Custovic A. Trajectories of Lung Function during Childhood. American Journal of Respiratory and Critical Care Medicine. 2014; 189(9):1101–1109. https://doi.org/10.1164/rccm.201309-1700OCPMID:24606581
7. Belgrave D, Granell R, Turner S, Curtin J, Buchan I, le Soue¨f P, et al. Lung function trajectories from pre-school age to adulthood and their associations with early life factors: a retrospective analysis of three population-based birth cohort studies. The Lancet Respiratory medicine. 2018; 6(7):526–534. https://doi.org/10.1016/S2213-2600(18)30099-7PMID:29628377
8. Nicolaou N, Custovic A. Molecular diagnosis of peanut and legume allergy. Current Opinion in Allergy and Clinical Immunology. 2011; 71(11):222–228.https://doi.org/10.1097/ACI.0b013e32834656c2
9. Nicolaou N, Poorafshar M, Murray C, Simpson A, Winell H, Kerry G, et al. Allergy or tolerance in children sensitized to peanut: Prevalence and differentiation using component-resolved diagnostics. Journal of Allergy and Clinical Immunology. 2010; 125(1):191–197.e13.https://doi.org/10.1016/j.jaci.2009.10.008 PMID:20109746
10. Nicolaou N, Murray C, Belgrave DCM, Poorafshar M, Simpson A, Custovic A. Quantification of specific IgE to whole peanut extract and peanut components in prediction of peanut allergy. Journal of Allergy and Clinical Immunology. 2011; 127(3):684–685.https://doi.org/10.1016/j.jaci.2010.12.012PMID: 21272928
11. Melioli G, Bonifazi F, Bonini S, Maggi E, Mussap M, Passalacqua G, et al. The ImmunoCAP ISAC molecular allergology approach in adult multi-sensitized Italian patients with respiratory symptoms. Clin-ical Biochemistry. 2011; 44(12):1005–1011.https://doi.org/10.1016/j.clinbiochem.2011.05.007PMID: 21627961
12. Prosperi M, Belgrave D, Buchan I, Simpson A, Custovic A. Challenges in interpreting allergen microar-rays in relation to clinical symptoms: A machine learning approach. Pediatric Allergy and Immunology. 2013; 25(1):71–79.https://doi.org/10.1111/pai.12139PMID:24131308
13. Simpson A, Lazic N, Belgrave D, Johnson P, Bishop C, Mills C, et al. Patterns of IgE responses to multi-ple allergen components and clinical symptoms at age 11 years. Journal of Allergy and Clinical Immu-nology. 2015; 136(5):1224–1231.https://doi.org/10.1016/j.jaci.2015.03.027PMID:25935108
14. Custovic A, Sonntag HJ, Buchan I, Belgrave D, Simpson A, Prosperi M. Evolution pathways of IgE responses to grass and mite allergens throughout childhood. Journal of Allergy and Clinical Immunol-ogy. 2015; 136(6):1645–1652.https://doi.org/10.1016/j.jaci.2015.03.041PMID:25962900
15. Custovic A, Simpson B, Murray C, Lowe L, Woodcock A. The National Asthma Campaign Manchester Asthma and Allergy Study. Pediatric Allergy and Immunology. 2002; 13(15):32–37.https://doi.org/10. 1034/j.1399-3038.13.s.15.3.x
16. Semic-Jusufagic A, Belgrave D, Pickles A, Telcian AG, Bakhsoliani E, Sykes A, et al. Assessing the association of early life antibiotic prescription with asthma exacerbations, impaired antiviral immunity, and genetic variants in 17q21: a population-based birth cohort study. The Lancet Respiratory Medicine. 2014; 2(8):621–630.https://doi.org/10.1016/S2213-2600(14)70096-7PMID:24835835
17. Asher M, Keil U, Anderson H, Beasley R, Crane J, Martinez F, et al. International Study of Asthma and Allergies in Childhood (ISAAC): rationale and methods. European Respiratory Journal. 1995; 8(3):483– 491.https://doi.org/10.1183/09031936.95.08030483PMID:7789502
18. Lødrup Carlsen K, Roll S, Carlsen KH, Mowinckel P, Wijga A, Brunekreef B, et al. Does Pet Ownership in Infancy Lead to Asthma or Allergy at School Age? Pooled Analysis of Individual Participant Data from 11 European Birth Cohorts. PLoS ONE. 2012; 7(8):1–12.https://doi.org/10.1371/journal.pone.0043214 PMID:22952649
19. Howard R, Belgrave D, Papastamoulis P, Simpson A, Rattray M, Custovic A. Evolution of IgE
responses to multiple allergen components throughout childhood. Journal of Allergy and Clinical Immu-nology. 2018; 142(4).https://doi.org/10.1016/j.jaci.2017.11.064PMID:29428391
20. Hastie T, Tibshirani R, Friedman J. The Elements of Statistical Learning. Springer Series in Statistics. New York, NY, USA: Springer New York Inc.; 2001.
21. Sze´kely G, Rizzo M, Bakirov N. Measuring and testing dependence by correlation of distances. The Annals of Statistics. 2007; 35(6):2769–2794.https://doi.org/10.1214/009053607000000505
22. Rand WM. Objective criteria for the evaluation of clustering methods. Journal of the American Statistical Association. 1971; 66(336):846–850.https://doi.org/10.1080/01621459.1971.10482356
23. Ward JH. Hierarchical Grouping to Optimize an Objective Function. Journal of the American Statistical Association. 1963; 58(301):236–244.https://doi.org/10.1080/01621459.1963.10500845
24. Hands S, Everitt B. A Monte Carlo Study of the Recovery of Cluster Structure in Binary Data by Hierar-chical Clustering Techniques. Multivariate Behavioral Research. 1987; 22(2):235–243.https://doi.org/ 10.1207/s15327906mbr2202_6PMID:26782067
25. Blashfield RK. Mixture model tests of cluster analysis: Accuracy of four agglomerative hierarchical methods. Psychological Bulletin. 1976; 3(83):377–388.https://doi.org/10.1037/0033-2909.83.3.377
26. Ji J, He D, Feng Y, He Y, Xue F, Xie L. JDINAC: joint density-based non-parametric differential interac-tion network analysis and classificainterac-tion using high-dimensional sparse omics data. Bioinformatics. 2017; 33(19):3080–3087.https://doi.org/10.1093/bioinformatics/btx360PMID:28582486
27. Collins GS, Reitsma JB, Altman DG, Moons KM. Transparent reporting of a multivariable prediction model for individual prognosis or diagnosis (tripod): The tripod statement. Annals of Internal Medicine. 2015; 162(1):55–63.https://doi.org/10.7326/M14-0697PMID:25560714
28. R Core Team. R: A Language and Environment for Statistical Computing; 2013.
29. Rizzo M, Sze´kely G. energy: E-Statistics: Multivariate Inference via the Energy of Data. R package ver-sion 1.7–2. Published 2017 Sep 15. Available from:https://CRAN.R-project.org/package=energy.
30. Csardi G, Nepusz T. The igraph software package for complex network research. InterJournal. 2006; Complex Systems.
31. Aragon TJ. epitools: Epidemiology Tools. R package version 0.5–10. Published 2017 Oct 26. Available from:https://CRAN.R-project.org/package=epitools.
32. Brock G, Pihur V, Datta S, Datta S. clValid: An R Package for Cluster Validation. Journal of Statistical Software, Articles. 2008; 25(4):1–22.https://doi.org/10.18637/jss.v025.i04
33. Kuhn M. caret: Classification and Regression Training. R package version 6.0–78. Published 2017 Dec 10. Available from:https://CRAN.R-project.org/package=caret.
34. Kaufman L, Rousseeuw PJ. Finding Groups in Data: an introduction to cluster analysis. John Wiley & Sons; 1990.
35. Caliński T, Harabasz J. A dendrite method for cluster analysis. Communications in Statistics. 1974; 3 (1):1–27.https://doi.org/10.1080/03610927408827101
36. Scala E, Alessandri C, Palazzo P, Pomponi D, Liso M, Bernardi M, et al. IgE Recognition Patterns of Profilin, PR-10, and Tropomyosin Panallergens Tested in 3,113 Allergic Patients by Allergen Microar-ray-Based Technology. PLoS ONE. 2011; 6(9):1–8.https://doi.org/10.1371/journal.pone.0024912 PMID:21949785
37. Bjerg A, Winberg A, Berthold M, Mattsson L, Borres M, Ro¨nmark E. A population-based study of animal component sensitization, asthma, and rhinitis in schoolchildren. Pediatric Allergy and Immunology. 2015; 26(6):557–563.https://doi.org/10.1111/pai.12422PMID:26059105
38. Patelis A, Gunnbjo¨ rnsdottir M, Malinovschi A, Matsson P, O¨ nell A, Ho¨gman M, et al. Population-based study of multiplexed IgE sensitization in relation to asthma, exhaled nitric oxide, and bronchial respon-siveness. Journal of Allergy and Clinical Immunology. 2012; 130(2):397–402.https://doi.org/10.1016/j. jaci.2012.03.046PMID:22633327
39. Schoos A, Kattan J, Gimenez G, Sampson H. Predicting phenotypes of asthma and eczema with machine learning. Journal of Allergy and Clinical Immunology. 2016; 137(4):1277–1280.https://doi.org/ 10.1016/j.jaci.2015.09.035PMID:26581917
40. Murray C, Foden P, Lowe L, Durrington H, Custovic A, Simpson A. Diagnosis of asthma in symptomatic children based on measures of lung function: an analysis of data from a population-based birth cohort study. The Lancet Child & Adolescent Health. 2017; 1(2):114–123.https://doi.org/10.1016/S2352-4642 (17)30008-1PMID:29034296
41. Latzin P, Fuchs O. Asthma diagnosis in children: more evidence needed. The Lancet Child & Adoles-cent Health. 2017; 1(2):83–85.https://doi.org/10.1016/S2352-4642(17)30019-6
42. Del Giacco S, Bakirtas A, Bel E, Custovic A, Diamant Z, Hamelmann E, et al. Allergy in severe asthma. Allergy. 2016; 72(2):207–220.https://doi.org/10.1111/all.13072PMID:27775836
43. Roberts G, Ollert M, Aalberse R, Austin M, Custovic A, DunnGalvin A, et al. A new framework for the interpretation of IgE sensitization tests. Allergy. 2016; 71(11):1540–1551.https://doi.org/10.1111/all. 12939PMID:27224838
44. Holt P, Strickland D, Bosco A, Belgrave A, Hales B, Simpson A, et al. Distinguishing benign from patho-logic TH2 immunity in atopic children. Journal of Allergy and Clinical Immunology. 2016; 137(2):379– 387.https://doi.org/10.1016/j.jaci.2015.08.044PMID:26518094
45. Prosperi M, Marinho S, Simpson A, Custovic A, Buchan I. Predicting phenotypes of asthma and eczema with machine learning. BMC Medical Genomics. 2014; 7(1). https://doi.org/10.1186/1755-8794-7-S1-S7PMID:25077568
46. Wickman M, Lupinek C, Andersson N, Belgrave D, Asarnoj A, Benet M, et al. Detection of IgE Reactivity to a Handful of Allergen Molecules in Early Childhood Predicts Respiratory Allergy in Adolescence. EBioMedicine. 2017; 26:91–99.https://doi.org/10.1016/j.ebiom.2017.11.009PMID:29221963