Combustion of Synthetic Jet Fuel: Chemical
Kinetic Modeling and Uncertainty Analysis
The MIT Faculty has made this article openly available. Please share
how this access benefits you. Your story matters.
Citation
Wagner, Andrew L., Paul E. Yelvington, Jianghuai Cai, and William
H. Green. “Combustion of Synthetic Jet Fuel: Chemical Kinetic
Modeling and Uncertainty Analysis.” Journal of Propulsion and
Power (August 26, 2016), pp. 1-10.
As Published
http://dx.doi.org/10.2514/1.B36217
Publisher
American Institute of Aeronautics and Astronautics (AIAA)
Version
Author's final manuscript
Citable link
http://hdl.handle.net/1721.1/105331
Terms of Use
Creative Commons Attribution-Noncommercial-Share Alike
Combustion of Synthetic Jet Fuel:
Chemical Kinetic Modeling and Uncertainty Analysis
Andrew L. Wagner* and Paul E. Yelvington†
Mainstream Engineering Corporation, Rockledge, Florida, 32955
Jianghuai Cai‡ and William H. Green§
Department of Chemical Engineering, Massachusetts Institute of Technology, Cambridge, Massachusetts, 02139
Reaction mechanisms for jet fuel combustion were built with the aim of providing a better description of the chemistry to reacting flow simulations used to design future aircraft engines. This research effort focused on combustion of Fischer-Tropsch synthetic jet fuel (S-8) in vitiated air at conditions relevant to jet engines, augmentors, and interturbine burners (T = 650–1700 K, P = 1–20 atm, and Φ = 0.5–2 in air). The complex S-8 fuel mixture was approximated with a two-component surrogate mixture of n-decane and iso-octane. A wholly new, elementary-step reaction mechanism for the surrogate consisting of 291 species and 6,900 reactions was constructed using automatic mechanism generation software. Statistical analyses were conducted to determine reaction rate-constant sensitivity, model prediction uncertainty, and consistency of the model with published ignition delay time data. As a test application, the S-8 reaction model was used to estimate augmentor static stability using a simple Damköhler number analysis that showed increased stability with temperature from 800 to 1400 K and NO concentration from 0 to 1000 ppm (v/v). The ability to quickly generate accurate mechanisms for simple surrogates allows for new synthetic fuels to be quickly modeled and their behavior predicted for an array of experimental conditions and practical applications.
*
Chemical Engineer.
†
Energy Conversion Technology Leader, pyelvington@mainstream-engr.com (corresponding author).
‡ Post-doctoral Research Assosciate, Department of Chemical Engineering. § Professor, Department of Chemical Engineering.
Nomenclature
i2 = chi squared consistency test of variable iDi = measured data for variable i
f = uncertainty factor
k = reaction rate
Mi = solution variable i
Φ = fuel-air equivalence ratio
Sij = sensitivity coefficient of solution variable i to reaction j
𝑆̅ij = normalized sensitivity coefficient of solution variable i to reaction j i = Error in solution variable i
tchem = chemical time scale
tflow = flow time scale
tig = ignition delay time
ui = relative uncertainty of solution variable i
I. Introduction
odern design of augmentors and interturbine burners relies on the accurate modeling of petroleum-derived and synthetic jet fuels in computational fluid dynamic (CFD) simulations involving reacting flows. As new synthetic fuels and more stringent regulations are introduced, improved mechanisms are needed to simulate device performance, pollutant formation, and combustion stability. However, jet fuels are complex mixtures of hundreds of components including linear alkanes, branched alkanes, cyclo-alkanes, and aromatic species, with the exact composition not known. Even if the composition were known, creating mechanisms for all the species would be impractical and yield a model too large to be useful. Simulations therefore require computationally tractable, predictive jet fuel surrogates of known composition that can be accurately modeled, rigorously tested, and experimentally validated. A practical surrogate mixture is composed of a few components that mimic the physical and chemical behavior of the real fuel. Many surrogates have been proposed for jet fuels (e.g., Dooley et al. [1],
Seshadri et al. [2, 3]) and have been tested both experimentally and in CFD simulations; however, much less data exists for synthetic jet fuels.
The requirements for a suitable jet fuel surrogate were explored by the American Institute of Aeronautics and Astronautics (AIAA) jet fuel surrogate working group and reported on by Colket et al. [4, 5]. The working group identified target combustion characteristics that the surrogate should attempt to replicate including laminar flame speeds, heat release rates, flame stability (e.g., extinction strain rates), particulate formation, and (pre)ignition behavior. A good amount of experimental data for jet-fuel surrogate combustion has been collected recently in the U.S. and Europe. The available data for JP-8 and Jet-A includes rapid compression machine (RCM) data, [6] doped counterflow diffusion flame data, [7-9] jet stirred reactor (JSR) data, [10-12] flow reactor data, [1, 13] spherical droplet combustion data, [14] counterflow flame data, [3, 15] and shock tube data [16, 17]. Regarding synthetic jet fuels, RCM data is available for hydrotreated renewable jet (HRJ) fuel [6]. For synthetic paraffinic kerosene (SPK), there is JSR data, [18] shock tube data, [19] and flow reactor data [13, 20]. Kinetic modeling studies of jet fuel surrogate combustion have been performed by several groups including Dooley et al., [21] Bufferand et al., [7] and Honnet et al. [15]. Chemical kinetic modeling of synthetic jet fuel surrogates has been performed by Dooley et al., [20] Allen et al., [6] and Naik et al. [22]. The recent work by Fuller et al. [23, 24] explores the effect of vitiated air on jet fuel combustion. These efforts indicate that most synthetic fuel experimental data is for S-8, a synthetic Fischer-Tropsch replacement for JP-8 jet fuel.
Preliminary analysis of n-decane, iso-octane (i.e., 2,2,4-trimethylpentane), and methylcyclohexane indicated that the effort should focus on branched and straight chain alkanes as constituents of an S-8 surrogate to explore synthetic fuel effects in augmentors. Ultimately, a mixture of n-decane and iso-octane was chosen for the S-8 surrogate. Using the selected surrogate composition, a detailed mechanism was generated using reaction mechanism generation software. The process of exploring a new chemistry, such as the chemistry of jet fuel surrogate combustion in vitiated air, was performed by constructing a predictive chemical kinetic model, comparing to experimental validation data, and then testing whether the model and data were consistent. Using this knowledge, species were added, rate parameters refined, and the chemistry expanded. Reaction mechanism generation software automates this process using a predefined scheme. If necessary, the reaction model can be reduced, eliminating excess reaction and species parameters, and used in reacting flow CFD simulations. Other simpler models, such as zero-dimensional (0-D) or 1-D models that were used to study combustion stability and laminar flame speed, do not
require model reduction. As an example, improved reaction models were used to provide a better estimate of the chemical reaction time scale, which was used to make better predictions of augmentor stability. This is a simple example of how these models can be used outside of a multi-dimensional CFD simulation. The improved reaction models can be used to explore the fuel effects related to synthetic jet fuel and the effect of vitiation on the chemical timescale through NOX-hydrocarbon coupling chemistry.
II. Surrogate Formulation
Dooley et al. [20] proposed using a mixture of n-dodecane and iso-octane as an S-8 surrogate to match the derived cetane number (DCN) of POSF 4734, a representative S-8 fuel with a DCN of 58.7. Other targets such as threshold sooting index (TSI) were not considered because jet engines burning S-8 emit little soot. We followed the Dooley et al. [20] surrogate for S-8 but matched the DCN using n-decane rather than n-dodecane to reduce the number of species and reactions in the model. The composition matching the DCN of POSF 4734 was identified as 27.9 mol%
iso-octane and 72.1 mol% n-decane using data from Dooley et al. [20, 25]. The H/C ratio of the surrogate was 2.212
and the molecular weight was 134.5 g/mol. The S-8 surrogate used here has a higher n-alkane concentration compared to the Dooley surrogate because n-decane has a lower DCN than n-dodecane. There is a recognized molecular weight mismatch between the S-8 surrogates and real S-8 fuel; to minimize errors due to the mismatch, initial and boundary conditions should match the mass fraction of the real fuel [26].
III. Reaction Mechanism Generation
Constructing an accurate chemical kinetic model is a challenging task, both because chemistry knowledge is very large and somewhat amorphous, and because hundreds of differential equations and thousands of numerical parameters (rate constants, molecular thermochemistry, etc.) are often required to accurately describe the details of the processes occurring in a reacting mixture. Constructing these models by hand is a time-consuming and error-prone process, so over the past three decades, several research groups have developed software to automate the process of constructing chemical kinetic simulations.
Model-construction software works by applying reaction operators to a set of molecules to generate new product molecules. The reaction operators break and make bonds following some pre-defined motif. Each time a new chemical reaction is constructed by this process, the corresponding rate parameters are estimated, drawing on some
thermochemistry of each species is also estimated, drawing on another library of estimation parameters (e.g., Benson group values). Often some experimental data can be used instead of estimates, and this data can be drawn from another library. The reaction operators are then applied to the product species to generate byproducts and so on iteratively.
The RMG software developed at MIT performs the aforementioned procedure [27]. The inputs to the chemistry model construction process are the conditions of interest (T, P, concentrations), databases of reaction rate constant rules and thermochemistry group values, and tolerances for terminating the model building process. The output is a reaction mechanism (i.e., a collection of reactions important under the specified conditions). The procedure performed by the software is as follows:
1.) Start with a small initial pool of chemical species.
2.) Evaluate fluxes (i.e., net rates of production) for reactions between the species in the pool, which lead to new products not included in the pool.
3.) Add the product species to the model that has the highest flux.
4.) Keep adding species until the highest flux is less than some specified tolerance.
This procedure is called the rate-based algorithm for mechanism generation. The RMG software distinguishes itself from other automatic mechanism generation software in the following ways:
1.) RMG uses a new data model that organizes rate rules and group additivity thermochemistry values in hierarchical tree structures. This data model makes RMG extensible and allows new chemistry knowledge to be quickly added as it becomes available. Other mechanism-generation software has used hardcoded rate rules, which were difficult to modify and as a result quickly became obsolete.
2.) RMG treats pressure-dependent reactions (i.e., reactions that proceed via an activated complex and hence have rate coefficients that depend on both temperature and pressure) on par with ordinary Arrhenius-type reactions, and it automatically computes the P-dependence of both the rate coefficients and the product branching ratios. This aspect of RMG could be particularly important in low-pressure augmentors where about half of the reactions are expected to be pressure dependent. The hierarchical trees in RMG are very detailed, including over 700 thermochemical functional groups and over 30 classes of reactions. This
means that for C/H/O/N, chemistry models generated with RMG tend to be fairly complete (at least based on the current understanding).
A. n-Decane Component Mechanism
To create a model for an S-8 surrogate, n-decane and iso-octane submodels were first created. n-Decane is the main component and was modeled first in RMG. RMG was run at 10 atm from 650−1800 K with an error tolerance of 0.02. The reaction mechanism added species and reactions until the flux to unused species was below the error tolerance. Pressure-dependent reaction-rate constants were generated with the high-pressure limit rates estimated using RMG reaction family templates. The fall-off effects were computed using the Modified Strong Collision (MSC) approach of Chang et al. [28] as implemented by Allen et al. [29].
The n-decane model was compared with fundamental experiments of pyrolysis and oxidation in a shock tube to identify errors in the combustion chemistry with only modest computational effort. Because of the limited availability of data in the desired temperature and pressure ranges for augmentors and diesel engines, it was necessary to compare at different conditions. The n-decane model was validated with experimental studies by Malewicki and Brezinsky [30] over the temperature range of 867 to 1739 K, pressure range of 50 to 70 atm, and equivalence ratios of 0.57, 1.03, and 1.96 in air. The stable products were measured and quantified using gas chromatography. The simulation was performed using the constant-pressure, adiabatic, perfectly stirred reactor (PSR) in the Chemkin-Pro program (Reaction Design) [31]. Figure 1 shows strong agreement in the concentrations of n-decane and alkenes between the experiment and model. The model was especially good at predicting the behavior of C2H4, C3H6 and 1-C4H8 at different equivalence ratios, which are important species for many sensitive
Figure 1. Experimental mole fraction profiles (symbols) [30] and modeling results (lines) from n-decane pyrolysis and oxidation in a shock tube at approximately 50 atm
Ignition delay time is a result of the complex pre-ignition chemistry, making it harder to predict. Many experiments [32-36] have been performed to measure the ignition delay times of n-decane over the temperature range of 800 to 1700 K, pressure range of 10 to 50 atm, and equivalence ratio range of 0.25 to 1.0 in air. Figure 2 shows a comparison in the high temperature region (1100 K and higher) at about 10 atm with varying equivalence ratio. The validation indicates that the model can predict the ignition delay times accurately above 1100 K, but the model is not consistent with the experiments below 1100 K. In this low-temperature region, peroxy species play an important part in the ignition of decane. The sub-mechanism of the peroxy species needs further development in the model.
The underlying chemistry of the model was examined by analyzing the reaction path flux of a simulated experiment. For n-decane, path flux analysis was conducted for a shock tube simulation at an initial temperature of 1094 K, pressure of 12.9 atm, and equivalence ratio of 1 in air, which showed that the initial decane (nC10H22)
radicals. The C10H21 isomers interchanged with each other and mainly underwent β-C-C scission reactions to
produce C2-C9 alkenes and 1-alkyl radicals. Further consumption of 1-alkyl radicals was dominated by β-scission to produce C2H4 and shorter 1-alkyl radicals. The H attack and unimolecular decomposition reactions were the main
comsumption channel of long alkenes (C4-C9). For example, 1-C6H12 was mainly comsumed by H attack, producing
C3H6 and nC3H7, as well as unimolecular decomposition, producing aC3H5 and nC3H7. For the comsumption of
small alkenes, C2H4 and C3H6, OH attack became the dominant pathway, producing C2H3 and aC3H5, respectively.
Figure 2. Ignition delay times of n-decane in air measured by Haylett et al. [32], Dean et al. [33], Zhukov et al. [34], Shen et al. [35], and Pfahl et al. [38], (symbols) and simulated results (lines) by the present model
B. iso-Octane Component Mechanism
iso-Octane was modeled with the same scheme used to create the n-decane mechanism. In RMG, the iso-octane
mechanism was created by adding new reactions to the pre-existing structure of the n-decane mechanism, preventing the creation of duplicate reactions and taking into account all species and reactions that would be in the final, combined S-8 surrogate model.
The iso-octane model was validated with experiments conducted by Malewicki et al. [37] over the temperature range of 800 to 1750 K, pressure range of 21 to 65 atm, and equivalence ratios of 0.52 to 1.68 in air. Figure 3 presents the comparison of the measured and simulated results of important intermediate species at different equivalence ratios. These species are accurately predicted by the model at pyrolysis conditions but are
under-predicted at lean oxidation conditions, especially at temperatures above 1100 K. The present model might over-estimate the reactivity of the oxidation pathways of these species.
The ignition delay times of iso-octane were modeled over a wide range of conditions and compared to experimental results. The model predicted ignition delay times to within a factor of 2 for data from Davidson et al. [38] at temperatures from 855 to 1269 K, pressures from 14 to 59 atm, and equivalence ratios of 0.5 and 1.0 in air. To validate the model close to the augmentor range, ignition delay results were compared with experimental data from a rapid compression facility (RCF). Figure 4 also shows model comparisons to data from 5 to 21 atm, 900 to 1050 K, and equivalence ratios from 0.3 to 0.5 for an iso-octane/oxygen/nitrogen/argon mixture. The model predicted these sets of data, except for those at 5.2 atm, which were under predicted by a factor of 2. The uncertainty of many reactions may lead to the underprediction. The sensitivity analyisis showed that, according to the present model, the iso-octane ignition delay times were sensitive to the sub-mechanism of propargyl (C3H3) radical.
However, in the LLNL model, ignition delay was much less sensitive to C3H3 reactions. . Path flux analysis showed
that about 98% of C3H3 was consumed by C3H3 + O2 = C3H3O + O in our present model. This reaction is not included at all in LLNL model. Without this reaction the ignition delay times will slow down by a factor of 2, giving values closer to He et al.’s measurement. However, we do not think this is conclusive proof that C3H3 + O2 = C3H3O + O is negligible as assumed in the LLNL model. Further investigation on this reaction would be helpful to resolve this discrepancy..
Figure 3. Experimental mole fraction profiles (symbols) [37] and modeling results (lines) from iso-octane pyrolysis and oxidation in a shock tube at approximately 50 atm in air
Figure 4. Ignition delay times of iso-octane in air measured by He et al. [39] and Davidson et al. [38] (symbols) at different pressures and simulated results (lines) by the present model
The reaction pathways were analyzed for a shock tube ignition simulation at an initial temperature of 950 K, pressure of 10.5 atm, and equivalence ratio of 0.4. The distinct carbon atoms in iso-octane (CH3)3CCH2CH(CH3)2
were labeled C1-C5 from left to right. The initial decomposition of iso-octane was from H abstraction reactions by OH, H, CH3 and O producing C8H17 isomers. Among the H abstraction reactions, OH attack was the dominant
pathway, which contributed 70% to the iso-octane decomposition. C7H14 isomers were mainly produced by the
β-scission of 1-C8H17, 3-C8H17 and 5-C8H17. The main decomposition pathways of C7H14 were either C-C scission
producing conjugated radicals via unimolecular reaction or H attack producing smaller molecules. The decomposition pathway of 3-C8H17 and 1-C8H17 were both controlled by the reaction sequence C8H17 → C7H14 →
iC4H7→aC3H4. The main decomposition of 5-C8H17 was different, which followed the reaction sequences 5-C8H17
→ neoC5H11→ iC4H8→ iC4H7→aC3H4 and 5-C8H17 → C7H14 → tC4H9 → iC4H8→ iC4H7→aC3H4.
C. S-8 Combined Mechanism
The S-8 model combined the n-decane and iso-octane component models and had 291 species and 6,900 elementary reactions. Little data has been collected on synthetic jet fuels, limiting the comparison to shock tube experiments with an equivalence ratio of 1 in air at 20 atm over a range of 650 to 1250 K. Figure 5 shows the model comparison with data from Dooley et al. [20]. The general trends are captured, including the behavior in the negative temperature coefficient (NTC) region. However, the actual alignment is not consistent with the data. This model is weak in the low-temperature region for the same reason as the n-decane model. Similarly, the model is weak in the NTC region for the same reason as the iso-octane model.
The S-8 model was compared to flame speed measurements by Singh and Kumar [40, 41] for S-8/air mixtures at 1 atm and an inlet temperature of 500 K. Figure 5 shows that the model predicts the S-8 flame speed well within experimental reproducibility. Note that the model predicts the S-8 flame speed to be roughly halfway between the
iso-octane and n-decane results, consistent with the experimental data.
This model is distinct from previous literature models in that it has a more complete reaction set. Having a more complete reaction set means the model is better suited to predict multiple experiments without regenerating the model for each set of conditions. A drawback to a large mechanism is increased computation time, but a large reaction number has much less impact on the simulation time than a large species number. The increased number of relevant reactions allows for a more comprehensive treatment of reaction parameter uncertainty, as described later.
Figure 5. Ignition delay times of S-8 in air measured by Dooley et al. [20] (symbols) and simulated results (lines) by the present model (left) along with flame speeds of S-8/air mixtures measured by Singh et al. [40]
and Kumar et al. [42] (symbols) and simulated results (lines) by the present model (right)
D. S-8 Model Extensions—Impact of Electronically Excited OH* and NOx Coupling on Ignition Delay Time
Ignition delay time is routinely defined and experimentally based on the OH* emission intensity. Researchers typically assume that the OH* concentration has the same temporal behavior as the ground-state OH included in many combustion models. However, a recent paper by Mevel et al. [43] suggests that this might not always be the case. To explore this potential bias, an OH* sub-mechanism was added to the reaction model that added two species and three reactions. The reaction set, taken from Hall and coworkers, [44, 45] was also used by Mevel et al. [43]. A comparison of predicted OH and OH* concentrations for a shock tube simulation for a stoichiometric n-decane/air mixture at 1094 K and 8.9 atm showed the OH* peak occurred before the OH peak, and the OH* concentration decayed faster. In this case, the difference between the ignition delay derived from OH* and OH was only a few microseconds, negligible compared to other uncertainties. However, Hall, Rickard, and Petersen [45] report that the difference can be as large as 30%, especially at more dilute test conditions.
NOx chemistry has been found to be important to combustion, especially at lower temperatures. NOx
-hydrocarbon coupling chemistry was added to the S-8 model based on a model developed by Glarborg et al. [46]. This sub-mechanism added 31 species and 239 reactions to the S-8 model. Little data exists for ignition delay time with NOx addition to S-8 or pure component fuels. The n-decane model was in good agreement with JP-8 data from
Fuller et al. [47] at 850 K and 900 K in a flow reactor with a vitiated 0.12/0.88 O2/N2 (molar basis) oxidizer stream
and an equivalence ratio of 1. Both of these added chemistries improve predictive capabilities and model accuracy.
IV. Statistical Model Validation
A. Ignition Delay Sensitivity Analysis
To improve the models and better understand their shortcomings, the qualitative comparisons between model results and experimental data should be made quantitative. Sensitivity analysis was conducted to determine how the model could be improved, as well as determine the influence of different reactions under various experimental conditions.
Most computer codes (e.g., Chemkin) only allow the calculation of the raw first-order sensitivity (Sij) of the
solution variables (usually temperature and species mass fractions).
reactions s prediction j i ij i N j N A M S , 1 1 (1)
where Mi is the solution variable (T or xm), Aj is the corresponding pre-exponential factor in the rate constants, and Sij
is the sensitivity coefficients. The sensitivity with respect to the heats of formation can also be considered; however, we decided to focus on the less well known reaction constants in this study. These sensitivity coefficients are calculated quickly and efficiently in a single run. However, often the combustion engineer is more interested in some observable feature of the calculation (e.g., ignition delay or flame speed) rather than profiles of temperature and species concentration. The feature of interest in the shock tube experiments is the ignition delay time. Experimentalists routinely define the ignition delay in their experiment as the time (since the passing of the incident shock) for the maximum value of the OH* emission intensity as measured by a photodetector behind a UV filter. The maximum OH* emission intensity was assumed to occur at the instant when the electronically excited OH* radical was at its maximum concentration. The ignition delay criterion used in the shock tube experiments can be expressed mathematically as
, 0 * A t t x ig OH (2)where xOH* is the OH* radical mole fraction, tig is the ignition delay, and A is a vector of pre-exponential constants.
As shown by Rabitz, Kramer and Dacol, [48] differentiating this equation with respect to Aj gives the following
equation for the sensitivity of the ignition delay to pre-exponential constants:
ig OH ig j OH j ig j ig t t t t x t t A x t A t S 2 * * , 2 (3)
The quantities on the right side of this equation can all be calculated from the results of a Chemkin simulation. The numerator is simply the time derivative of the OH* sensitivity (SOH*,j) profile, and the denominator is the second
derivative of the OH* solution profile. The derivatives in the above equation were calculated by finite difference formulas. We observed that fine spacing of the solution profile in time was required around the ignition delay to minimize the discretization error in the finite difference approximations to the derivatives. The sensitivity of the ignition delay time can be normalized by taking the derivative of the ln of tig with respect to the ln of Aj as calculated
by: ig j ig t ig j j ig ig j j ig j ig t t t S t A A t t A A t S , , ln ln (4)
B. Uncertainty Analysis Methods
To judge the actual performance of the model relative to experimental data, first an uncertainty analysis was performed to determine the error that is expected based on the inaccuracies in the rate constants. Three methods of uncertainty analysis were tested and compared including a linear approximation, polynomial chaos expansion (PCE), and a Monte-Carlo (MC) method. Both PCE and MC are global methods. The Monte Carlo method is a brute-force method that randomly samples a parameter distribution many times to determine the probable outcome of a simulation. The MC method is computationally intensive, requiring days of analysis for a single shock-tube data point with the S-8 model. As the number of uncertain parameters, N, increases (i.e., number of rate constants considered increases), the number of runs needed for a full simulation of the interactions increases as SN where S is the number of levels considered for each parameter. The advantage of the MC method is that no complex math or linear approximations are required. Therefore the MC method to verify the accuracy of the other two methods. PCE
is a method that reduces the number of runs needed for uncertainty determination by reducing the dimensionality of the data. It is reduced by approximating random parameters as a vector of standard distributions that are independent and can therefore be solved in the one-dimension subspace [49]. This powerful tool allowed for the uncertainty to be solved in 4N runs. Using this method treated the model as a black box, which did not use any information from the model itself except the inputs and outputs. Finally, linear uncertainty analysis was used, which made first-order approximations that allowed the uncertainty to be determined with a single run. This method is the least accurate and requires a direct parameter-to-target relationship (i.e., ignition delay to OH*). For the tests conducted, these three methods agreed to within 10% error, so the linear uncertainty analysis was used due to the drastically reduced computation time for this method.
The linear uncertainty analysis was performed to determine the predicted uncertainty in the calculated ignition delay. Assuming uncertainties in the pre-exponential factors are relatively small and not highly correlated, the uncertainty in the model predictions, ui, can be expressed as
j j ij i S A u ln 2 (5)where ui could be the uncertainty in a solution variable (like T or xm) or a feature like tig. This calculation determines
the relative uncertainty because it uses the normalized sensitivity coefficients calculated in Eq. (4) for ignition delay time. The sensitivity coefficient 𝑆̅tig,j was used to calculate the uncertainty in the predicted ignition delay utig = tig
= lntig. The relative uncertainty in the pre-exponential factor lnAj was assumed to be equal to that of the rate
constant, lnkj, and was estimated based on the evaluated database of chemical kinetic rate parameters published by
Baulch et al. [50] where possible. The uncertainty factors, f, published by Baulch et al. are defined such that the uncertain range in k is encompassed by multiplication or division of the recommended k value by 10f. Baulch et al. reported f values for several small molecule reactions of interest but not the larger molecule decomposition reactions. To determine the f value of all the reactions a simple scheme was used as described in Table 1. The reactions had increasing f values based on the source, which included reactions included in the Baulch compendium, well-studied reactions seeded in RMG, reactions matching exactly a reaction motif in RMG, or an estimated reaction with no exact match in RMG. As suggested by Zador et al. [51], it was assumed that the Baulch uncertain range corresponded to a 3 deviation from the recommended values on a logarithmic scale:
ln
10
3
ln
k
j
f
jTable 1. Scheme for Determination of Rate Constant Uncertainty Factor, f
Condition f Description
Reaction included in Baulch compilation 0.2 to 1, generally Reaction critically reviewed and f value tabulated in Baulch et al. Reaction in seed mechanism 0.5 Common, widely studied reaction RMG has an exact match for the rate rule 1 Usually from a quantum calculation
or limited measurements No exact match; RMG calculates an
estimated rate rule
2 Most uncertain reaction rates
C. Contribution of Critical Reactions to Ignition Delay Uncertainty
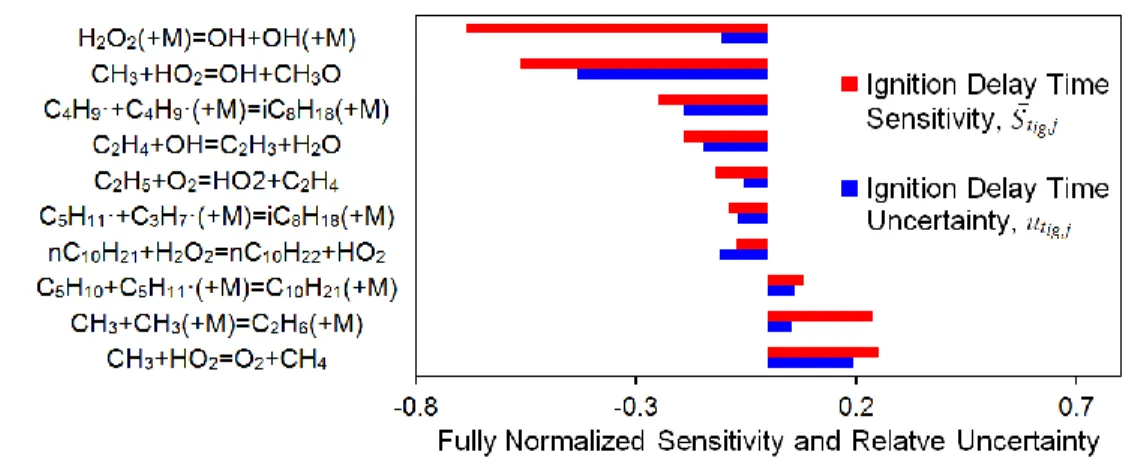
One of the main goals of determining the most sensitive reactions for a particular experiment is to identify where the rate constants in the model can be improved with better experimental data or quantum calculations. However, some reaction rate rules are known quite well (small uncertainty), so experiments involving those reactions would offer only a modest reduction in the overall uncertainty of the model predictions. The OH* sensitivity was further analyzed in terms of an overall contribution to the uncertainty because of the connection of OH* to ignition delay. This reaction uncertainty contribution is the OH* sensitivity coefficient multiplied by f for the corresponding reaction using the scheme described in Table 1. When the S-8 model data at = 1 in air, 1116 K, and 20 atm was
examined in this manner, the most sensitive reaction ranked fifth in its contribution to the ignition delay uncertainty. Similarly, the second and third most sensitive were the first and second largest contributors to the uncertainty. This result, shown in Figure 6, demonstrates that the reaction that has the highest sensitivity does not necessarily contribute the most to the model uncertainty. The most uncertain reactions are ideal targets for future experiments or quantum calculations to maximize the benefit to the overall reaction model.
Figure 6. Most sensitive reactions based on ignition delay time modeled with the S-8 surrogate model in a
shock tube at 20 atm, 1116 K, and = 1 in air
With the most uncertain reactions known, the effect of reducing the error can be estimated. At high temperatures, the reactions contributing the most to the ignition delay uncertainty in the S-8 model are CH3+HO2↔O2+CH4 and
CH3+HO2↔OH+CH3O. These reactions currently have an f of 1, indicating a “factor-of-10”uncertainty. If the
uncertainty could be reduced to a factor of 3, the uncertainty would be reduced on average 35% from 1000 to 1300 K.
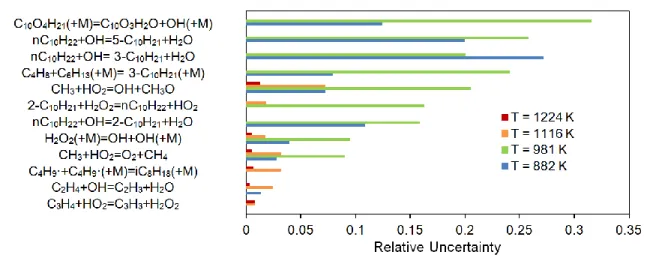
D. Effect of Temperature on Ignition Delay Uncertainty
To get a full view of the scope of uncertainty, the full range of temperatures used in the experiment was examined. A few select temperatures from the S-8 data comparison were taken and analyzed as shown in Figure 7. The magnitudes of uncertainty for the top-5 reactions, which account for at least 50% of the overall uncertainty at that temperature, are shown. Where no bars are shown, that reaction contributed less than 1% at that temperature. Figure 7 shows that the uncertainty is much larger at lower temperatures. A few reactions are significant at all temperatures, which could be studied to improve the model, such as CH3+HO2↔OH+CH3O. However, to
significantly improve the low-temperature chemistry, low-temperature specific reactions need to be improved. Notable reactions contributing strongly to ignition delay uncertainty at low temperatures include H abstractions from
temperatures mentioned previously lose significance in the NTC region and low-temperature region. This region is dominated by the following reactions:
nC10H22+OH↔C10H21+H2O (forming multiple C10H21 isomers)
C10O4H21(+M)↔C10O3H2O+OH (+M)
If these reactions had their error reduced to a factor-of-3, the uncertainty would be reduced by about 20% from 800 to 1000 K.
Figure 7. Reactions contributing the most to the ignition delay uncertainty for the S-8 surrogate model over a
range of temperatures at 20 atm and = 1 in air
E. Chi-Squared Analysis of Experimental and Model Data
A statistical comparison between the model predictions and experimental data was performed to eliminate subjectivity in assessing whether the two were consistent. Using the uncertainty tools above, a quantitative comparison between the model predictions, Mi,n (uncertainty range ui,n), and the corresponding data, Di,n (uncertainty
range i,n), was used to test for ignition delay model consistency. Here the subscript i is tig, which indicates the
natural log of the ignition delay because tig = lntig. The extent of deviation between the model and the data
scaled by the uncertainties was measured by the chi-squared statistic, i2.
(D M ) ( u )
2 n 1N2
The probability that the model and data are consistent, P(χ2), can be determined by comparing the χ2 to the chi-squared distribution at a certain degree of freedom and the desired significance level. If P(χ2) < 0.1, that means that there is less than 10% chance that the model and the data agree. Because of the large sources of error, the P(χ2) was categorized into three criteria: inconsistent with data when P(χ2) < 0.3, ambiguous with data when 0.3 < P(χ2) < 0.7, and consistent with data when P(χ2) > 0.7.
This approach was applied to a representative data set from the n-decane, iso-octane, and S-8 experimental shock tube results, where the experimental uncertainty was 20% (defined as two standard deviations) as reported by Shen and Oehlschlaeger [52]. Therefore n, which is the relative error in the experimental data, was taken as 0.1. This
error was extrapolated to data from similar experiments but was too small to account for the variability in those data sources. To account for this discrepancy, P(χ2) was calculated for n = 0.1 and 0.3 as summarized in Table 2. The
n-decane model shown in The data doesn’t seem to be from the sources/conditions cited, need a careful double check by Andrew to be sure this is correct. Figure 8, which appeared to match well with the experimental data from 750 to 1700 K, exhibited a 1% probability at n = 0.1 and 61% at n = 0.3, or ambiguous consistency with the experiment.
This is primarily because of the behavior around 1000 K. The iso-octane model, shown in The data doesn’t seem to be from the sources/conditions cited, need a careful double check by Andrew to be sure this is correct. Figure 8, matches well visually around 1000 K with a 15% probability at n = 0.1 and 43% at n = 0.3, making it ambiguous
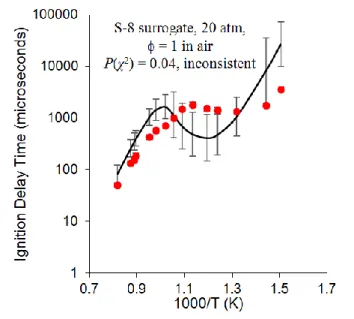
that it is consistent with the data. The combined S-8 surrogate model demonstrated a 4% probability at n = 0.1 and
42% at n = 0.3, or ambiguous consistency with the experiment across the temperature from 650 to 1300 K as
shown in Figure 9. This statistical analysis shows that even models that appear to be in good agreement with the data might not be statistically consistent. This analysis helps explain the previous analysis of the reactions contributing most to the model uncertainty, which showed a large error for low-temperature reactions. The S-8 surrogate, being a combination of n-decane and iso-octane, includes errors from each submodel. These results show where and how the model can be improved.
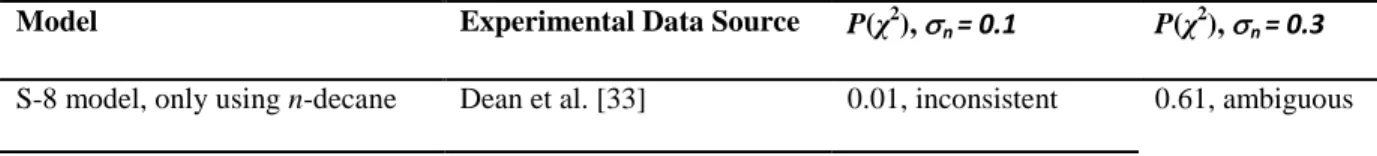
Table 2. Probability of Model-data Consistency for an S-8 Surrogate and its Constituents
Model Experimental Data Source P(χ2), n = 0.1 P(χ2), n = 0.3
S-8 model, only using iso-octane Li et al. [53] 0.15, inconsistent 0.43, ambiguous S-8 model Dooley et al. [20] 0.04, inconsistent 0.42, ambiguous
The data doesn’t seem to be from the sources/conditions cited, need a careful double check by Andrew to be sure this is correct. Figure 8. Full uncertainty analysis for representative shock tube data (symbols) for
n-decane data from Dean et al. [33] with n = 0.1 compared to the n-decane model (lines) (left) and iso-octane
Figure 9. Full uncertainty analysis for representative shock tube data (symbols) for S-8 data from Dooley et
al. [20] with n = 0.1 compared to the S-8 model (lines)
V. Augmentor Stability Analysis
The S-8 surrogate reaction model augmented with Glarborg’s HC-NOx coupling chemistry was used to perform
a simple augmentor static stability calculation. Fuller et al. [24] showed that the factors most affecting ignition delay in vitiated combustion systems are T, NOx, O2, and T-NOx interactions (other factors considered, but shown to be
unimportant, included and concentrations of CO, CO2, and H2O). The effect of T and NOx was explored, which
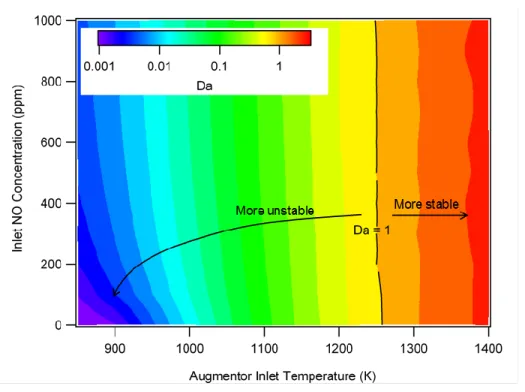
Fuller observed had the greatest influence on ignition delay and Damköhler number, Da = tflow/tchem. A
constant-pressure, adiabatic, perfectly stirred reactor (PSR) model was emplyed for this calculation. The NO concentration was swept from 0 to 1000 ppm (v/v) and temperature was swept from 850 to 1400 K, which is typical for augmentors [54]. The inlet (i.e., initial condition) was assumed to have P = 1 atm, = 0.3, and the air was assumed to be vitiated with O2/N2 = 0.12/0.88 (molar basis). The ignition delay was calculated for each run, and the value
was assigned to tchem. The flow timescale, tflow, was assumed to be 1 ms, in the middle of the range (0.2 to 2 ms)
suggested by Knaus et al. [55].
Figure 10 shows Da calculated using these assumptions. The contours are plotted logarithmically so that the large dynamic range in Da can be visualized. We observed that the stability criterion, Da = 1, occurred at a temperature of 1250 K for these initial conditions, which were fairly fuel lean. At low temperatures (<900 K), the
presence of NO reduced the ignition delay and therefore increased Da. At higher temperatures, closer to the stable region, the effect of NO concentration was small. At these higher temperatures, the ignition delay (and hence Da) was controlled by the usual initial pyrolysis and chain branching pathways. Interestingly, the S-8 model predicted NTC behavior at high pressures common in shock tube experiments (ca. 20 bar) but not at atmospheric pressure.
Figure 10. Damköhler number indicating a region of static stability over the range of augmentor inlet
temperatures for NO concentrations of 0 to 1,000 ppm, P = 1 atm, = 0.3, and vitiated air (O2/N2 = 0.12/0.88)
VI. Conclusions
A wholly new S-8 surrogate reaction mechanism was constructed using rate-based, automated mechanism-generation tools. The mechanism contained 291 species and 6,900 reactions. The surrogate was defined as a mixture of n-decane (27.9 mol %) and iso-octane (72.1 mol %) that matches the derived cetane number of real S-8 fuel. A comparison of the model and experimental data for laminar flames, pyrolysis, and oxidation showed good qualitative agreement. As temperature decreased, uncertainty increased with the largest values occurring around 900 K. Low-temperature oxidation chemistry and the propargyl oxidation mechanism needs to be improved in future models. Models were compared statistically using the chi-squared statistic; the model was ambiguous with the data
on n-decane above 750 K, iso-octane around 1100 K, and S-8 from 650 K to 1300 K when experimental data was taken with uncertainty n = 0.3.
NOx-hydrocarbon coupling chemistry was incorporated into the S-8 reaction mechanism and augmentor stability
predicted through a Damköhler number approach. The stability increased with temperature from 900 to 1400 K and inlet NO concentration from 0 to 1000 ppm. OH* chemistry was added to the reaction model to better match the diagnostic used in shock tube experiments to determine the ignition delay. This modification was found to be unimportant at the tested shock tube conditions, but the modification was shown to have an impact of up to 30% on ignition delay time under diluted conditions used in some experiments. The OH* sub-model is small and should be taken into consideration in future comparisons with experimental data.
The S-8 surrogate model constructed in a short period of time using n-decane and iso-octane was able to achieve visual consistency and ambiguous statistically consistency with experimental data from both the individual components and surrogate. The ability to quickly generate accurate mechanisms of these simple surrogates allows for a wide range of synthetic fuels to be quickly modeled and their behavior predicted for an array of experimental conditions and applications. These simulations will help spur the development and adoption of clean and alternative fuels in challenging combustion situations.
Acknowledgments
We would like to thank the U.S. Air Force for supporting this work under Contract No. FA8650-13-M-2401. We are grateful to Barry Kiel (U.S. Air Force Research Laboratory) for helpful discussions.
References
[1] Dooley, S., Won, S. H., Chaos, M., Heyne, J., Ju, Y., Dryer, F. L., Kumar, K., Sung, C.-J., Wang, H., Oehlschlaeger, M. A., Santoro, R. J., and Litzinger, T. A. "A jet fuel surrogate formulated by real fuel properties," Combustion and Flame Vol. 157, No. 12, 2010, pp. 2333-2339.
[2] Humer, S., Frassoldati, A., Granata, S., Faravelli, T., Ranzi, E., Seiser, R., and Seshadri, K. "Experimental and kinetic modeling study of combustion of JP-8, its surrogates and reference components in laminar nonpremixed flows," Proceedings of the Combustion Institute Vol. 31, 2007, pp. 393-400.
[3] Seshadri, K., Frassoldati, A., Cuoci, A., Faravelli, T., Niemann, U., Weydert, P., and Ranzi, E. "Experimental and kinetic modeling study of combustion of jp-8, its surrogates and components in laminar premixed flows," Combustion Theory and Modelling Vol. 15, No. 4, 2011, pp. 569-583.
[4] Colket, M., Edwards, T., Williams, S., Cernansky, N. P., Miller, D. L., Egolfopoulos, F., Lindstedt, P., Seshadri, K., Dryer, F. L., Law, C. K., Friend, D., Lenhert, D. B., Pitsch, H., Sarofim, A., Smooke, M., and Tsang, W. "Development of an experimental database and kinetic models for surrogate jet fuels," 45th AIAA
Aerospace Sciences Meeting. Vol. 14, American Institute of Aeronautics and Astronautics Inc., Reston, VA
20191-4344, United States, 2007, pp. 9446-9466.
[5] Colket, M., Edwards, T., Williams, S., Cernansky, N. P., Miller, D. L., Egolfopoulos, F., Dryer, F. L., Bellan, J., Lindstedt, P., Seshadri, K., Pitsch, H., Sarofim, A., Smooke, M., and Tsang, W. "Identification of target validation data for development of surrogate jet fuels," 46th AIAA Aerospace Sciences Meeting and Exhibit. American Institute of Aeronautics and Astronautics Inc., Reno, NV, United states, 2008.
[6] Allen, C., Valco, D., Toulson, E., Edwards, T., and Lee, T. "Ignition behavior and surrogate modeling of JP-8 and of camelina and tallow hydrotreated renewable jet fuels at low temperatures," Combustion and Flame Vol. 160, No. 2, 2012, pp. 232-239.
[7] Bufferand, H., Tosatto, L., La Mantia, B., Smooke, M. D., and Gomez, A. "Experimental and computational study of methane counterflow diffusion flames perturbed by trace amounts of either jet fuel or a 6-component surrogate under non-sooting conditions," Combustion and Flame Vol. 156, No. 8, 2009, pp. 1594-1603.
[8] Jahangirian, S., McEnally, C. S., and Gomez, A. "Experimental study of ethylene counterflow diffusion flames perturbed by trace amounts of jet fuel and jet fuel surrogates under incipiently sooting conditions,"
Combustion and Flame Vol. 156, No. 9, 2009, pp. 1799-1809.
[9] Tosatto, L., La Mantia, B., Bufferand, H., Duchaine, P., and Gomez, A. "Chemical structure of a methane counterflow diffusion flame perturbed with the addition of either JP-8 or a jet fuel surrogate." Vol. 32 I, Elsevier Ltd, Montreal, QC, Canada, 2009, pp. 1319-1326.
[10] Dagaut, P. "Kinetics of jet fuel combustion over extended conditions: Experimental and modeling," Journal of
[11] Dagaut, P., and Cathonnet, M. "The ignition, oxidation, and combustion of kerosene: A review of experimental and kinetic modeling," Progress in Energy and Combustion Science Vol. 32, No. 1, 2006, pp. 48-92. [12] Dagaut, P., El Bakali, A., and Ristori, A. "The combustion of kerosene: Experimental results and kinetic
modelling using 1- to 3-component surrogate model fuels," Fuel Vol. 85, No. 7-8, 2006, pp. 944-956. [13] Gokulakrishnan, P., Klassen, M. S., and Roby, R. J. "Ignition characteristics of a fischer-tropsch synthetic jet
fuel." PART B ed. Vol. 3, American Society of Mechanical Engineers, Berlin, Germany, 2008, pp. 921-929.
[14] Liu, Y. C., Savas, A. J., and Avedisian, C. T. "Surrogate fuel development based on droplet combustion: Comparison of multi-component mixtures with an aviation fuel." American Institute of Aeronautics and Astronautics Inc., Nashville, TN, United states, 2012.
[15] Honnet, S., Seshadri, K., Niemann, U., and Peters, N. "A surrogate fuel for kerosene." Vol. 32 I, Elsevier Ltd, Montreal, QC, Canada, 2009, pp. 485-492.
[16] Vasu, S. S., Davidson, D. F., and Hanson, R. K. "Jet fuel ignition delay times: Shock tube experiments over wide conditions and surrogate model predictions," Combustion and Flame Vol. 152, No. 1-2, 2008, pp. 125-143.
[17] Malewicki, T., Gudiyella, S., and Brezinsky, K. "Experimental and modeling study on the oxidation of Jet A and the n-dodecane/iso-octane/n-propylbenzene/1,3,5-trimethylbenzene surrogate fuel," Combustion and
Flame Vol. 160, No. 1, 2013, pp. 17-30.
[18] Dagaut, P., Mze-Ahmed, A., Hadj-Ali, K., and Dievart, P. "Synthetic jet fuel combustion: Experimental and kinetic modeling study." PARTS A AND B ed. Vol. 2, American Society of Mechanical Engineers, Vancouver, BC, Canada, 2011, pp. 227-235.
[19] Kahandawala, M. S. P., DeWitt, M. J., Corporan, E., and Sidhu, S. S. "Ignition and emission characteristics of surrogate and practical jet fuels," Energy and Fuels Vol. 22, No. 6, 2008, pp. 3673-3679.
[20] Dooley, S., Won, S. H., Jahangirian, S., Ju, Y., Dryer, F. L., Wang, H., and Oehlschlaeger, M. A. "The combustion kinetics of a synthetic paraffinic jet aviation fuel and a fundamentally formulated, experimentally validated surrogate fuel," Combustion and Flame Vol. 159, No. 10, 2012, pp. 3014-3020. [21] Dooley, S., Won, S. H., Heyne, J., Farouk, T. I., Ju, Y., Dryer, F. L., Kumar, K., Hui, X., Sung, C.-J., Wang,
K. "The experimental evaluation of a methodology for surrogate fuel formulation to emulate gas phase combustion kinetic phenomena," Combustion and Flame Vol. 159, No. 4, 2012, pp. 1444-1466.
[22] Naik, C. V., Puduppakkam, K. V., Modak, A., Wang, C., and Meeks, E. "Validated F-T fuel surrogate model for simulation of jet-engine combustion." PARTS A AND B ed. Vol. 2, American Society of Mechanical Engineers, Glasgow, United kingdom, 2010, pp. 1301-1308.
[23] Fuller, C. C., Gokulakrishnan, P., Klassen, M. S., Roby, R. J., and Kiel, B. V. "Investigation of the effects of vitiated conditions on the autoignition of JP-8." American Institute of Aeronautics and Astronautics Inc., Denver, CO, USA, 2009.
[24] Fuller, C. C., Gokulakrishnan, P., Klassen, M. S., Roby, R. J., and Kiel, B. V. "Investigation of the effect of nitric oxide on the autoignition of JP-8 at low pressure vitiated conditions," 49th AIAA Aerospace Sciences
Meeting Including the New Horizons Forum and Aerospace Exposition. American Institute of Aeronautics
and Astronautics Inc., Orlando, FL, USA, 2011.
[25] Dooley, S., Won, S. H., Chaos, M., Heyne, J., Ju, Y. G., Dryer, F. L., Kumar, K., Sung, C. J., Wang, H. W., Oehlschlaeger, M. A., Santoro, R. J., and Litzinger, T. A. "A jet fuel surrogate formulated by real fuel properties," Combustion and Flame Vol. 157, No. 12, 2010, pp. 2333-2339.
[26] Colket, M. "Challenges and Uncertainties in Use of Surrogate Fuels for Emulating Combustor Performance,"
52nd AIAA Aerospace Sciences Meeting. National Harbor, MD, 2014.
[27] Green Jr, W., Allen, J., Buesser, B., Ashcraft, R., Beran, G., Class, C., Gao, C., Goldsmith, C., Harper, M., and Jalan, A. "RMG-Reaction Mechanism Generator. 2013. URL h ttp," greengroup. github. io/RMG-Py. [28] Chang, A. Y., Bozzelli, J. W., and Dean, A. M. "Kinetic analysis of complex chemical activation and
unimolecular dissociation reactions using QRRK theory and the modified strong collision approximation,"
Zeitschrift Fur Physikalische Chemie-International Journal Of Research In Physical Chemistry & Chemical Physics Vol. 214, 2000, pp. 1533-1568.
[29] Allen, J. W., Goldsmith, F. C., and Green, W. H. "Automatic Estimation of Pressure-dependent Rate Coefficients," Physical Chemistry Chemical Physics, Vol.14, 2012, pp. 1131-1155.
[30] Malewicki, T., and Brezinsky, K. "Experimental and modeling study on the pyrolysis and oxidation of n-decane and n-dodecane," Proceedings of the Combustion Institute Vol. 34, 2013, pp. 361-368.
[31] Gschwender, L. J., Nelson, L., Snyder Jr, C. E., Fultz, G. W., and Saba, C. S. "Advanced high-temperature air force turbine engine oil program." 1407 ed., American Society for Testing and Materials, West Conshohocken, PA 19428-2959, United States, Seattle, WA, United States, 2001, pp. 17-24.
[32] Haylett, D. R., Davidson, D. F., and Hanson, R. K. "Ignition delay times of low-vapor-pressure fuels measured using an aerosol shock tube," Combustion and Flame Vol. 159, No. 2, 2012, pp. 552-561.
[33] Dean, A. J., Penyazkov, O. G., Sevruk, K. L., and Varatharajan, B. "Autoignition of surrogate fuels at elevated temperatures and pressures," Proceedings of the Combustion Institute Vol. 31, 2007, pp. 2481-2488. [34] Zhukov, V. P., Sechenov, V. A., and Starikovskii, A. Y. "Autoignition of n-decane at high pressure,"
Combustion and Flame Vol. 153, No. 1-2, 2008, pp. 130-136.
[35] Shen, H.-P. S., Steinberg, J., Vanderover, J., and Oehlschlaeger, M. A. "A Shock Tube Study of the Ignition of n-Heptane, n-Decane, n-Dodecane, and n-Tetradecane at Elevated Pressures," Energy & Fuels Vol. 23, 2009, pp. 2482-2489.
[36] Pfahl, U., Fieweger, K., and Adomeit, G. Self-ignition of diesel-relevant hydrocarbon-air mixtures under
engine conditions, 1996.
[37] Malewicki, T., Comandini, A., and Brezinsky, K. "Experimental and modeling study on the pyrolysis and oxidation of iso-octane," Proceedings of the Combustion Institute Vol. 34, 2013, pp. 353-360.
[38] Davidson, D. F., Gauthier, B. M., and Hanson, R. K. "Shock tube ignition measurements of iso-octane/air and toluene/air at high pressures," Proceedings of the Combustion Institute Vol. 30, 2005, pp. 1175-1182. [39] He, X., Donovan, M. T., Zigler, B. T., Palmer, T. R., Walton, S. M., Wooldridge, M. S., and Atreya, A. "An
experimental and modeling study of iso-octane ignition delay times under homogeneous charge compression ignition conditions," Combustion and Flame Vol. 142, No. 3, 2005, pp. 266-275.
[40] Singh, D., Nishiie, T., and Qiao, L. "Experimental and kinetic modeling study of the combustion of n-decane, Jet-A, and S-8 in laminar premixed flames," Combustion Science and Technology Vol. 183, No. 10, pp. 1002-1026.
[41] Kumar, K., Mittal, G., and Sung, C.-J. "Autoignition of n-decane under elevated pressure and low-to-intermediate temperature conditions," Combustion and Flame Vol. 156, No. 6, 2009, pp. 1278-1288. [42] Kumar, K., and Sung, C.-J. "Laminar flame speeds and extinction limits of preheated decane/O2/N2 and
[43] Mevel, R., Pichon, S., Catoire, L., Chaumeix, N., Paillard, C. E., and Shepherd, J. E. "Dynamics of excited hydroxyl radicals in hydrogen-based mixtures behind reflected shock waves," Proceedings of the
Combustion Institute Vol. 34, No. 1, 2013, pp. 677-684.
[44] Hall, J. M., and Petersen, E. L. "An optimized kinetics model for OH chemiluminescence at high temperatures and atmospheric pressures," International Journal of Chemical Kinetics Vol. 38, No. 12, 2006, pp. 714-724.
[45] Hall, J. M., Rickard, M. J. A., and Petersen, E. L. "Comparison of characteristic time diagnostics for ignition and oxidation of fuel/oxidizer mixtures behind reflected shock waves," Combustion Science and
Technology Vol. 177, No. 3, 2005, pp. 455-483.
[46] Bendtsen, A. B., Glarborg, P., and Dam-Johansen, K. "Low temperature oxidation of methane: the influence of nitrogen oxides," Combustion Science and Technology Vol. 151, No. 1, 2000, pp. 31-71.
[47] Fuller, C. C., Gokulakrishnan, P., Klassen, M. S., Roby, R. J., and Kiel, B. V. "Investigation of the effect of nitric oxide on the autoignition of JP-8 at low pressure vitiated conditions." American Institute of Aeronautics and Astronautics Inc., Orlando, FL, United States, 2011.
[48] Rabitz, H., Kramer, M., and Dacol, D. "Sensitivity Analysis in Chemical Kinetics," Annual Review of Physical
Chemistry Vol. 34.1, 1983, p. 446.
[49] CHEMKIN-PRO. "CHEMKIN 10131," Reaction Design: San Diego, 2013. This software is distributed by ANSYS.
[50] Baulch, D. L., Bowman, C. T., Cobos, C. J., Cox, R. A., Just, T., Kerr, J. A., Pilling, M. J., Stocker, D., Troe, J., Tsang, W., Walker, R. W., and Warnatz, J. "Evaluated Kinetic Data for Combustion Modeling: Supplement II," Journal of Physical and Chemical Reference Data Vol. 34, No. 3, 2005, pp. 757-1397.
[51] Zador, J., Zsely, I. G., Turanyi, T., Ratto, M., Tarantola, S., and Saltelli, A. "Local and global uncertainty analyses of a methane flame model," Journal of Physical Chemistry A Vol. 109, No. 43, 2005, pp. 9795-9807.
[52] Shen, H.-P. S., and Oehlschlaeger, M. A. "The autoignition of C8H10 aromatics at moderate temperatures and elevated pressures," Combustion and Flame Vol. 156, No. 5, 2009, pp. 1053-1062.
[53] Li, S., Campos, A., Davidson, D. F., and Hanson, R. K. "Shock tube measurements of branched alkane ignition delay times," Fuel Vol. 118, 2014, pp. 398-405.
[54] Ebrahimi, H. B. "Overview of gas turbine augmenter design, operation, and combustion oscillation,"
AIAA/ASME/SAE/ASEE 42nd Joint Propulsion Conference. Vol. 7, American Institute of Aeronautics and
Astronautics Inc., Sacramento, CA, USA, 2006, pp. 5658-5673.
[55] Knaus, D. A., Magari, P. J., Hill, R. W., Phillips, S. D., and Kiel, B. V. "Predicting augmentor static stability using local Damkohler number," 46th AIAA Aerospace Sciences Meeting and Exhibit. American Institute of Aeronautics and Astronautics Inc., Reno, NV, USA, 2008.
![Figure 1. Experimental mole fraction profiles (symbols) [30] and modeling results (lines) from n-decane pyrolysis and oxidation in a shock tube at approximately 50 atm](https://thumb-eu.123doks.com/thumbv2/123doknet/14380553.505962/8.918.184.741.106.534/figure-experimental-fraction-profiles-modeling-pyrolysis-oxidation-approximately.webp)
![Figure 2. Ignition delay times of n-decane in air measured by Haylett et al. [32], Dean et al](https://thumb-eu.123doks.com/thumbv2/123doknet/14380553.505962/9.918.112.815.387.639/figure-ignition-delay-times-decane-measured-haylett-dean.webp)
![Figure 3. Experimental mole fraction profiles (symbols) [37] and modeling results (lines) from iso-octane pyrolysis and oxidation in a shock tube at approximately 50 atm in air](https://thumb-eu.123doks.com/thumbv2/123doknet/14380553.505962/11.918.182.742.106.535/figure-experimental-fraction-profiles-modeling-pyrolysis-oxidation-approximately.webp)
![Figure 5. Ignition delay times of S-8 in air measured by Dooley et al. [20] (symbols) and simulated results (lines) by the present model (left) along with flame speeds of S-8/air mixtures measured by Singh et al](https://thumb-eu.123doks.com/thumbv2/123doknet/14380553.505962/13.918.148.771.112.380/figure-ignition-measured-dooley-symbols-simulated-mixtures-measured.webp)