HAL Id: hal-02938617
https://hal.archives-ouvertes.fr/hal-02938617
Submitted on 15 Sep 2020
HAL is a multi-disciplinary open access
archive for the deposit and dissemination of
sci-entific research documents, whether they are
pub-lished or not. The documents may come from
teaching and research institutions in France or
abroad, or from public or private research centers.
L’archive ouverte pluridisciplinaire HAL, est
destinée au dépôt et à la diffusion de documents
scientifiques de niveau recherche, publiés ou non,
émanant des établissements d’enseignement et de
recherche français ou étrangers, des laboratoires
publics ou privés.
LandCover2RDF: an API for computing the land cover
of a geographical area and generating the RDF graph
Jordane Dorne, Nathalie Aussenac-Gilles, Catherine Comparot, Romain
Hugues, Cassia Trojahn dos Santos
To cite this version:
Jordane Dorne, Nathalie Aussenac-Gilles, Catherine Comparot, Romain Hugues, Cassia Trojahn dos
Santos. LandCover2RDF: an API for computing the land cover of a geographical area and generating
the RDF graph. Extended Semantic Web Conference (ESWC 2020), Jun 2020, Heraklion, Greece.
pp.73-78, �10.1007/978-3-030-62327-2_13�. �hal-02938617�
OATAO is an open access repository that collects the work of Toulouse
researchers and makes it freely available over the web where possible
Any correspondence concerning this service should be sent
to the repository administrator:
[email protected]
This is an author’s version published in: http://oatao.univ-toulouse.fr/26422
To cite this version: Dorne, Jordane and Aussenac-Gilles,
Nathalie and Comparot, Catherine and Hugues, Romain and
Trojahn dos Santos, Cassia LandCover2RDF: an API for
computing the land cover of a geographical area and
generating the RDF graph. (2020) In: Extended Semantic
Web Conference (ESWC), 2 June 2020 - 4 June 2020 (online,
France)
LandCover2RDF: an API for computing the
land cover of a geographical area and generating
the RDF graph
Jordane Dorne1,2, Nathalie Aussenac-Gilles1, Catherine Comparot1, Romain Hugues2, Cassia Trojahn1
1
Institut de Recherche en Informatique de Toulouse, France [email protected]
2 Thales Alenia Space, France [email protected]
Abstract. Land cover classifications are recognised to be a fundamen-tal source of data to characterise Earth surface and to support change detection analyses. Land cover maps have been produced from different sources as a result of massive time-series image processing. This paper proposes a REST API (and a web user interface) that allows for comput-ing the percentage of land cover classes of a geographic area accordcomput-ing to a given map. The computed data is then represented as an RDF graph based on an ontology dedicated to this kind of data focusing on their temporal and spatial dimensions. We illustrate the use of the API to study the evolution of Land Cover on a French geographical area. Keywords: satellite images, computed data, land cover, RDF
1
Introduction
Earth Observation (EO) is a domain that has rapidly evolved in the past few years. Since 2015, the European Space Agency has launched the Sentinel satel-lites, which deliver between 8 and 10 TB of data per day, promoting emerging applications, from agriculture to forestry, environmental monitoring to urban planning and climate domains. One fundamental type of data required for these applications and available thanks to EO images is the Earth surface coverage (e.g., water, croplands, urban) or ”land cover”. Land cover is available as maps produced by different services as a result of massive time-series image processing under different resolutions [4]. Examples of such classifications are the Global Land Cover Share (GLC-SHARE), the European Corine Land Cover (CLC), and the French CESBIO Land Cover. A further step to make use of land cover is to compute the percentage of each type of land cover on a given area (i.e., agricul-tural parcel), so as to identify the main land cover on this area. Land cover data can then be useful to study crop evolution, the progress of urban areas or the impact of natural hazards. Moreover the semantic representation of land cover datahas been exploited for image annotation improving semantic search [3,2].
In this paper, we propose a REST API (together with a web user interface) that allows for computing on-demand the percentage of land cover classes of a geographic area, according to a given classification. These percentages are represented as RDF triples according to an ontology representing this kind of data together with its temporal and spatial dimensions. While previous works concentrated on using specific land cover classifications (e.g., CLC in [3] or GLC-SHARE in [1]), we propose a modular ontology to accommodate different land cover classifications. Close to our study, the CLC has been pre-calculated and exposed in RDF in different projects, such as the Greece Land Cover3 and the H2020 Copernicus App Lab4. However, to the best of our knowledge, a REST API able to generate an RDF graph describing the land cover from a give polygon of a specific area does not exist. This API can be further exploited in a range of EO semantic-oriented data integration applications. We illustratethe use of the API in a case-study on the evolution of land cover (CESBIO) on a French geographical area. The RDF graph generated thanks to this service is then stored into a local RDF triple store.
2
Land cover ontology
In order to represent land cover classes, together with spatial and temporal dimensions, we propose a two-layers ontology. The first layer (top in Fig. 1) forms a core ontology and the second one (bottom in Fig. 1) extends this core in order to represent any EO computed data (e.g. land cover data).
Core ontology. Spatio-temporal dimensions of data are represented using the GeoSPARQL and OWL-Time standards, respectively. The class EOFeature rep-resents geographic areas (i.e. entities associated to a geometry, a closed polygon defined by GPS coordinates) linked to an EO computed dataset (property hasE-OFeature). This dataset brings together all the EO data computed on the same geographic area from the same source at the same time. The temporal property of the data set (i.e. the period corresponding to the validity time of the data) is also associated to the dataset (property hasTime from OWL-Time).EO datasets are associated to their respective computed data (property hasData).
Land cover representation. Several proposals addressed the semantic repre-sentation of land cover categories using dedicated ontologies, as in [3] where CLC classes are represented with concepts (e.g., ConiferousForest) within a taxonomy, or in the SmOD INSPIRE vocabulary5that represents the CLC Nomenclature in SKOS6. Here, we selected two land covers with different resolutions: a global one,
3 http://linkedopendata.gr/dataset/corine-land-cover-of-greece 4 https://www.app-lab.eu/linked-data/ 5 https://www.w3.org/2015/03/inspire/ 6 https://www.w3.org/2015/03/corine
Fig. 1. The proposed ontology: the core reuses standard vocabularies (upper boxes) extended with a specialisation to represent the land cover data.
GLC-SHARE7, and a local (French) one, CESBIO8. GLC-SHARE is produced by FAO and the last version is dated 2014. It has 11 aggregated land cover classes (e.g., cropland, snow and glaciers, and water bodies). CESBIO nomenclature contains 17 classes (such as artificial, agricultural and semi-natural surfaces). Our API associates the percentage of the different classes of a given classifica-tion to a specific area. To do so, each land cover classificaclassifica-tion specialises the LandCover class with a hierarchy of classes. All the calculated values (linked to a LandCover using a hasLandCoverPercentage relation) for the same geographic area (an EOFeature with a Geometry, i.e. a polygon) from the same source (i.e a given Land Cover) are grouped in a LandCoverDataset.
3
Proposed API
Land cover classifications are provided as raster images (maps) linked to a text file containing the naming convention of classes associated to pixel values in the image. Each category in the text is given a value that allows for linking the number of pixel contained in this category for a given area. These raster files may come in different formats. GLC-SHARE uses GeoTiff format and WGS84
7 http://www.fao.org/land-water/land/land-governance/
land-resources-planning-toolbox/category/details/en/c/1036355 8
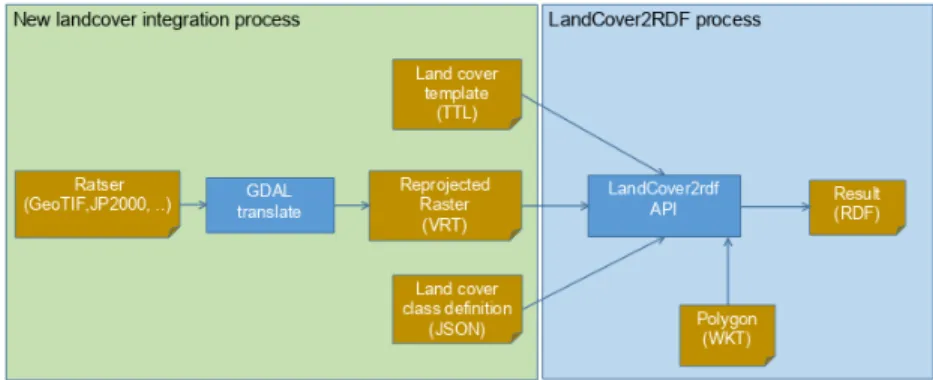
coordinates system whereas CESBIO uses JPEG200 format with a Lambert 93 coordinates system. Here, we chose the WGS84 system as it is the most widely used one. The overall process is depicted in Fig. 2. First, in order to change the raster projection, we used the GDAL9 library. It translates and reprojects the rasters in the chosen coordinate system. The output format is a virtual raster (VRT). The second step is to define a template file in Turtle format which contains all the land cover class names and links them to the corresponding classes of the proposed ontology. The last step is to define a parameter file in JSON format which contains all the values of the pixels associated to each class, the period validity and the resolution of the land cover.
Moreover the resolution of the two classifications differ as they were not com-puted from the same source. CESBIO is provided annually, and is mainly based on Sentinel-2 images acquired all year long, whereas GLC-SHARE combines var-ious EO sources. While the GLC-SHARE has a global coverage, with a spatial resolution of 1000m2 per pixel, CESBIO covers France only with a spatial reso-lution of 10m2. The resolution is important in order to determine the area of the polygon to be studied. If a polygon contains too few pixels, the result will not be accurate. That is why the land cover resolution has to be selected according to the size of the studied area. For instance, the area of the French city of Blagnac (used in our use case) is about 17km2; with GLC-SHARE land cover this corre-sponds to 17 pixels, which are not enough to determine an accurate value of the land cover in percent of this area. CESBIO resolution fits better.
Fig. 2. Process pipeline for land cover integration and RDF generation. The proposed REST API exposes a service implemented as a Django module in Python10. The service has a REST interface, it accepts as a parameter a WKT polygon. The service crops the original land cover image with the given polygon and then it computes the percentage of each class with the number of pixels. The response of the server is a JSON document containing the percentage of each land cover class for the area. This JSON document is then used as input
9
https://gdal.org/ 10
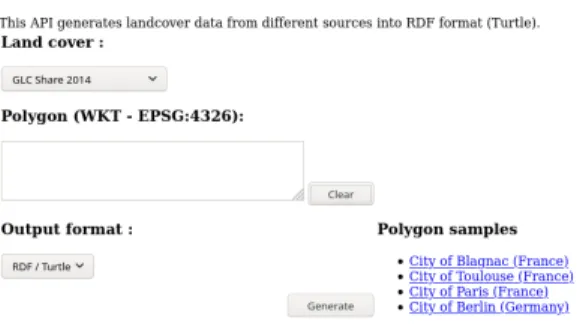
of a JSON to RDF transformation process that relies on the ontology above. A web interface11 can be used for accessing the API (Fig. 3).
Fig. 3. Web user interface for generating the RDF graph from a polygon.
4
Use case
We used the proposed API to compute the percent of CESBIO classes of the city of Blagnac (FR)12:
curl --data "datasetId=land_cover_cesbio_2017" --data "wkt=POLYGON((1.3473654876713013 43.63352225951501, ...))" http://melodi.irit.fr/rasterStats
An extract of the RDF graph with specific prefixes is as follows: @prefix lci: <http://melodi.irit.fr/ontologies/lci.owl#> .
@prefix g-lci: <http://melodi.irit.fr/lod/lci/> .
g-lci:landcover_cesbio_2017_area_dataset a lci:LandCoverDataset .
g-lci:landcover_cesbio_2017_area_dataset lci:hasEOFeature g-lci:landcover_cesbio_2017_area . g-lci:landcover_cesbio_2017_area_dataset time:hasTime g-lci:interval_1514764799.
g-lci:landcover_cesbio_2017_area_dataset lci:hasData g-lci:landcover_cesbio_2017_area_cultureEte. g-lci:landcover_cesbio_2017_area a lci:EOFeature .
g-lci:lc_cesbio_2017_area geo:hasGeometry g-lci:lc_cesbio_2017_area_geo .
g-lci:lc_cesbio_2017_area_geo geo:asWKT "POLYGON((1.3473654876713013 43.63352225951501, ...))" . g-lci:interval_1514764799 time:hasBeginning g-lci:instant_1483228801 .
g-lci:interval_1514764799 time:hasEnd g-lci:instant_1483228802 .
g-lci:instant_1483228801 time:inXSDDateTime "2017-01-01T00:00:01"^^xsd:dateTime . g-lci:instant_1483228802 time:inXSDDateTime "2017-12-31T23:59:59.999000"^^xsd:dateTime . g-lci:landcover_cesbio_2017_area_cultureEte a lci:CESBIO-CultureEte .
g-lci:landcover_cesbio_2017_area_cultureEte lci:hasLandCoverPercentage "3.9903"^^xsd:decimal .
We use the API for retrieving the RDF graph for the specific entity (geometry of the city of Blagnac in our use case) and store it into an RDF triplestore. Then, thanks to its geometry, we linked the corresponding entity to the one in INSEE dataset and generate an OWL sameAs relation).
To study the land cover evolution in terms of vegetation and urban cover we chose some classes for vegetation such as Culture Ete, Culture Hiver, Foret 11
http://melodi.irit.fr/share/demo_landcover2rdf.webm 12
Conifere, Foret Feuillus, and for urban such as Urbain Dense, Urbain Diffus. By grouping these classes and by integrating the land cover maps from 2016 and 2017 we query the computed data with SPARQL and show the evolution of the vegetation and urbanisation over one year for Blagnac (Fig. 4). We can observe a decrease in vegetation coverage while the urban cover percentages have increased, which can be corroborated by the urban expansion in this area.
Fig. 4. Result of the SPARQL query for the CESBIO over the geometry of Blagnac.
5
Conclusions
Computing land cover percentages on selected areas is of interest in a large range of semantic applications exploiting EO observations. We designed an API that implements such a service using the land cover classification selected by the user according to the country under study and to the size of the areas of interest. This flexibility is obtained thanks to an ontology that represents land cover classes, their location and dates. The calculated land cover values are represented as RDF triples using this ontology.For future work, we plan to other classifications such as CLC and to align the various classifications versions. A new feature of the API will allow the user to add a new land cover of his choice. The user shall provide a template file that contains the different land cover classes and the associate values in order to integrate it in the API.
References
1. H. Arenas, N. Aussenac-Gilles, C. Comparot, and C. Trojahn. Relations topologiques pour l’int´egration s´emantique de donn´ees et images d’observation de la terre. In Actes du XXXVI`eme Congr`es INFORSID, pages 63–78, 2018.
2. C. Dumitru, G. Schwarz, and M. Datcu. Land cover semantic annotation derived from high-resolution sar images. IEEE Journal of Selected Topics in Applied Earth Observations and Remote Sensing, 9(6):2215–2232, June 2016.
3. D. Espinoza-Molina, C. Nikolaou, O. Dumitru, K. Bereta, M. Koubarakis, G. Schwarz, and M. Datcu. Very-High-Resolution SAR Images and Linked Open Data Analytics Based on Ontologies. IEEE Journal of Selected Topics in Applied Earth Observations and Remote Sensing, 8(4):1696 – 1708, 2015.
4. E. Lambin and H. Geist. Land-Use and Land-Cover Change. Springer, Berlin, Heidelberg, 2006.