HAL Id: inserm-03090746
https://www.hal.inserm.fr/inserm-03090746
Submitted on 30 Dec 2020
HAL is a multi-disciplinary open access
archive for the deposit and dissemination of
sci-entific research documents, whether they are
pub-lished or not. The documents may come from
teaching and research institutions in France or
abroad, or from public or private research centers.
L’archive ouverte pluridisciplinaire HAL, est
destinée au dépôt et à la diffusion de documents
scientifiques de niveau recherche, publiés ou non,
émanant des établissements d’enseignement et de
recherche français ou étrangers, des laboratoires
publics ou privés.
José Wojnacki, Sébastien Nola, Philippe Bun, Béatrice Cholley, Francesca
Filippini, Mary Pressé, Joanna Lipecka, Sin Man Lam, Julie N’guyen, Axelle
Simon, et al.
To cite this version:
José Wojnacki, Sébastien Nola, Philippe Bun, Béatrice Cholley, Francesca Filippini, et al.. Role of
VAMP7-Dependent Secretion of Reticulon 3 in Neurite Growth. Cell Reports, Elsevier Inc, 2020, 33
(12), pp.108536. �10.1016/j.celrep.2020.108536�. �inserm-03090746�
Role of VAMP7-Dependent Secretion of Reticulon 3
in Neurite Growth
Graphical Abstract
Highlights
d
Nutrient restriction and autophagy regulate axonal growth
and neuronal polarity
d
VAMP7 mediates nutrient restriction/autophagy-dependent
neurite growth
d
VAMP7 mediates the secretion of ER-phagy factor Reticulon
3
Authors
Jose´ Wojnacki, Se´bastien Nola,
Philippe Bun, ..., Maria Isabel Colombo,
Ida Chiara Guerrera, Thierry Galli
Correspondence
thierry.galli@inserm.fr
In Brief
VAMP7 is involved in
exocytosis-mediated neurite growth and degradative
autophagy. Using secretomics, Wojnacki
et al. show that VAMP7 mediates the
release of tubular ER-phagy receptor
Reticulon 3, a secretory pathway greatly
enhanced in autophagy-null neuronal
cells. ER-phagy and unconventional
secretion regulate neurite growth and
polarization during nutrient deprivation.
Late Endosome / Amphisome
RTN3 Degradation LC3 P62 RTN3 GABARAP CALCOCO Degradative ER-phagy ER Autophagosome Lysosome Autophagolysosome Secretory ER-phagy ER VAMP7-Dependent Secretion PM Neurite Extension RTN3 RTN3 Extracellular Space
Wojnacki et al., 2020, Cell Reports33, 108536 December 22, 2020ª 2020 The Author(s).
Article
Role of VAMP7-Dependent Secretion
of Reticulon 3 in Neurite Growth
Jose´ Wojnacki,1,7Se´bastien Nola,1Philippe Bun,2Be´atrice Cholley,1Francesca Filippini,1Mary T. Presse´,1
Joanna Lipecka,3Sin Man Lam,4Julie N’guyen,2Axelle Simon,1Amine Ouslimani,1Guanghou Shui,4
Claudio Marcelo Fader,5Maria Isabel Colombo,5Ida Chiara Guerrera,3and Thierry Galli1,6,8,*
1Universite´ de Paris, Institute of Psychiatry and Neuroscience of Paris, INSERM U1266, Membrane Traffic in Healthy & Diseased Brain, 75014 Paris, France
2Universite´ de Paris, NeurImag Imaging Facility, Institute of Psychiatry and Neuroscience of Paris, INSERM U1266, 75014 Paris, France 3University of Paris, Proteomics Platform Necker, Structure Fe´de´rative de Recherche Necker, INSERM US24/CNRS UMS3633, 75015 Paris, France
4State Key Laboratory of Molecular Developmental Biology, Institute of Genetics and Developmental Biology, Chinese Academy of Sciences, 100101 Beijing, China
5Laboratorio de Biologı´a Celular y Molecular, Instituto de Histologı´a y Embriologı´a, Universidad Nacional de Cuyo, CONICET, 5500 Mendoza, Argentina
6GHU PARIS Psychiatrie & Neurosciences, 75014 Paris, France
7Present address: Centre for Genomic Regulation, The Barcelona Institute of Science and Technology, 08003 Barcelona, Spain 8Lead Contact
*Correspondence:thierry.galli@inserm.fr https://doi.org/10.1016/j.celrep.2020.108536 SUMMARY
VAMP7 is involved in autophagy and in exocytosis-mediated neurite growth, two yet unconnected cellular
pathways. Here, we find that nutrient restriction and activation of autophagy stimulate axonal growth, while
autophagy inhibition leads to loss of neuronal polarity. VAMP7 knockout (KO) neuronal cells show impaired
neurite growth, whereas this process is increased in autophagy-null ATG5 KO cells. We find that endoplasmic
reticulum (ER)-phagy-related LC3-interacting-region-containing proteins Atlastin 3 and Reticulon 3 (RTN3)
are more abundant in autophagy-related protein ATG5 KO and less abundant in VAMP7 KO secretomes.
Treatment of neuronal cells with ATG5 or VAMP7 KO conditioned medium does not recapitulate the effect
of these KOs on neurite growth. A nanobody directed against VAMP7 inhibits axonal overgrowth induced
by nutrient restriction. Furthermore, expression of the inhibitory Longin domain of VAMP7 impairs the
sub-cellular localization of RTN3 in neurons. We propose that VAMP7-dependent secretion of RTN3 regulates
neurite growth.
INTRODUCTION
Macroautophagy (henceforth referred to as autophagy) is an adaptive mechanism for the elimination of superfluous intra-cellular components and is upregulated in conditions of nutrient restriction. Autophagy is under the regulation of mammalian target of rapamycin complex 1 (mTORC1) and a signaling cascade of autophagy-related proteins (ATGs)
(Boya et al., 2013;Mizushima et al., 2011). Nutrients and/or
growth factor deprivation inhibits mTORC1 kinase activity on ULK1 (Ser757), a central kinase regulating the autophagic response. Non-phosphorylated ULK1 triggers the formation of the phagophore with membrane contributions from different donor compartments, effectively isolating cytoplasmic mate-rial for degradation. Upon autophagy stimulation, LC3 is cleaved and lipidated to form LC3-II, which binds to the phag-ophore, marking the biogenesis of the autophagosome, a dou-ble-membrane-limited organelle (Kim et al., 2011). This essen-tial step depends on the multiprotein complex ATG5/12/16L1
(Matsushita et al., 2007). LC3-II recruits LC3-interacting-region
(LIR)-containing proteins into the phagophore (Birgisdottir
et al., 2013). The autophagosome can then fuse with (1)
endo-somes to form a so-called amphisome, (2) lysoendo-somes to form an autolysosome, or even (3) the plasma membrane to deliver its content to the extracellular space (Klionsky et al., 2014;
Ponpuak et al., 2015). These different routes require
mem-brane fusion events; thus, they rely on vesicular (v)- and target (t)-SNARE proteins (Wang et al., 2016).
Interestingly, the v-SNARE VAMP7 with the t-SNAREs Syn-taxin17 and SNAP29 or SNAP47 can mediate the fusion of membranes during the initial formation of the phagophore and also the fusion of mitochondrial-derived vesicles (MDVs) with endosomes (Aoyagi et al., 2018; Moreau et al., 2011;
McLelland et al., 2016). VAMP7 mutants in the fly show
auto-phagy defects in neurons (Taka´ts et al., 2013), and the VAMP7 knockout (KO) mouse shows mitophagy impairment in insulin-secreting pancreatic b cells (Aoyagi et al., 2018). Nevertheless, the role of v-SNAREs in autophagy is complex
30μm Control Media DAPI B ß-Tubulin Tau1 0.0 0.5 1.0 1.5 ● ● ● ● ● ● ● ● p=0.012 ULK1 E 100 100 C 0 250 500 750 1000 p<0.001 p=0.995 STS 0.0 0.5 1.0 1.5 2.0 ● ●● ●●● ● ● ● p<0.001 p=0.781 Cas3 GAPDH Diluted media 15 35 D 1X 0X 0.20X
Cell seeding Dilution of theculture media
Fixation and staining
0 2 3 DIVs
A
Spautin Rapamycin + Spautin Rapamycin DMSO DAPI ß-Tubulin Tau1 K L 250 500 750 1000 p<0.001 p=0.165 0.0 0.5 1.0 1.5 2.0 2.5 3.0 ● ● ● ● ● ● ● ● ● ● ● ● p=0.160 p=0.002 p=0.200 LC 3 − II / G A P D H LC3-I GADPH DMSO Spau LC3-II Rapa Rapa+ Spau H 0.0 0.5 1.0 1.5 2.0 ● ● ● ●● ● p=0.049 pU LK 1 / U LK 1 pULK1 ULK1 DMSO (S757) I 0.0 0.1 0.2 0.3 0.4 0.5 0.6 ●● ● ● ● ● p=0.004 pS6RP S6RP J pS6K / S6K (S235/236) 35 15 100 100 0.00 0.25 0.50 0.75 1.00 F G 200 400 600 p<0.001 Longest T
au+ neurite length (μm)
kDa: kDa: kDa: 0 10μM 30μm kDa: DMSO Spau Rapa Longest T
au+ neurite length (μm)
Rapa DMSO Rapa
DMSO Rapa DMSO Rapa
DMSO Spau Rapa Rapa+
Spau STS Diluted media pULK1 (S757) Multipolar Unipolar Polarity Proportion Diluted media DMSO Rapa Spau: To tal T
au+ neurite length (μm)
DMSO Spau DMSO Spau Normal media Normal media Normal
media Normal mediaDilutedmedia
Diluted media Normal
media Component/
Characteristic Completemedia salt solutionHanks Bal. Diluted media
Base media osmolarity Amino acids Vitamins N2 supplement Glucose 280 - 320
mOsm/kg mOsm/kg266 - 294 mOsm/kg268 - 300
0.871 g/l g/l0 0.174g/l 0.0081 g/l g/l0 0.0016g/l 1 g/l g/l1 g/l1 DMSO Diluted Media Spautin
Caspase 3 / GAPDH pULK1 / ULK1
as evidenced by the overlapping functions of VAMP7, VAMP8, and Ykt6 in the fusion of autophagosomes with lysosomes (
Ita-kura et al., 2012;Taka´ts et al., 2018). The potential function of
VAMP7 in autophagic secretion has been suggested (Fader
et al., 2012), but it has not yet been directly demonstrated.
VAMP7 mediates lysosomal secretion as shown by the effect of its inhibitory Longin domain in epithelial cells (
Proux-Gillar-deaux et al., 2007) and silencing of its expression in astrocytes
(Verderio et al., 2012). We and others have shown that VAMP7
plays an important role in the elongation of neurites during neuronal development, a cellular process that requires plasma membrane expansion. VAMP7 drives secretion during axonal growth by mediating membrane fusion with the t-SNAREs Syntaxin1 and SNAP25. It also regulates the transport and dis-tribution of several cargo proteins including L1-CAM and the netrin receptor Deleted in Colorectal Cancer (DCC) (Alberts
et al., 2003;Cotrufo et al., 2011;Winkle et al., 2014;Wojnacki
and Galli, 2016). However, whether or how the roles of VAMP7
in autophagy and neurite growth are related has not been investigated.
To investigate whether the roles of VAMP7 in neurite growth and autophagy might be linked, we searched for the effect of nutrient restriction on axonal growth and hypothesized that VAMP7-dependent secretion could be involved. We found that beyond inducing autophagy, nutrient restriction stimulated axonal growth. Moreover, autophagy inhibition induced multi-polar neurons. To precisely dissect the role of VAMP7 in this un-expected phenomenon, we took advantage of CRISPR-Cas9 genome editing to knock out VAMP7 in neuronal-like PC12 cells. To have autophagy-null cells to compare with, we also gener-ated ATG5 KO PC12 cells. Using these cellular models, lipido-mics, and proteomics of the secretome, we found that VAMP7 mediated the release of autophagy-related molecules LC3-II and LIR-containing endoplasmic reticulum (ER) proteins Reticu-lon 3 (RTN3). RTN3 has been shown to be involved in ER-phagy of tubular ER. This evidence thus supports the hypothesis that, during the course of neurite growth, VAMP7 mediates the secre-tion of molecules involved in ER-phagy.
RESULTS
Autophagy Modulates Axonal Growth
We tested the effect of several starvation conditions on axonal growth in neuronal cultures. Our aim was to mimic nutrient re-striction while avoiding the extreme conditions that might result in rapid neuronal cell death as observed with complete glucose deprivation (Ramı´rez-Peinado et al., 2013). At 2 days in vitro (DIV), we diluted the N2 media five times with Hank’s balanced salt solution (Figure 1A) to generate a condition where nutrients such as amino acids, vitamins, growth factors, and supplements were diluted, while salts and Glc remained unchanged. We found that this condition induced longer axons after 24 h, while it did not induce apoptosis as determined by the amount of cleaved caspase-3 (Figures 1B–1D). N2 culture media dilution induced autophagy in neurons as determined by detection of phosphor-ylated (p)Ser757-ULK1 levels (Figure 1E). A 48-h nutrient depri-vation also induced longer axons (Figures S1A and S1B) but had an impact on neuronal viability as less neurons could be quantified. The effect of nutrient deprivation on axonal maximal length was attenuated by the specific autophagy inhibitor Spau-tin-1, which prevents the deubiquitinating activity of USP10 and USP13 (Liu et al., 2011) (Figures 1A and 1B), further demon-strating that axonal growth was dependent on functional auto-phagy. Moreover, autophagy inhibition with Spautin-1 affected neuronal polarity. Indeed, neurons treated with Spautin-1 still ex-hibited one axon longer than all other processes, but more neu-rons had multiple Tau1-positive neurites, with the presence of Tau1 being a mark of axonal specification (Bradke and Dotti,
2000) (Figures 1B, 1F, and 1K). The sum of the length of all
Tau1-positive neurites was greatly increased upon Spautin-1 treatment (Figure 1G), suggesting that pre-existing minor pro-cesses turned into supernumerary axons as has been shown when GSK3b signaling is impaired (Witte et al., 2008;Yoshimura
et al., 2005). The effect of nutrient deprivation on axonal length
could not be reproduced by diluting only insulin (Figures S1C and S1D), unlike what was previously shown in the case of neuronal cell death (Young et al., 2009). To further establish
Figure 1. Effects of Nutrient Restriction and Autophagy Drugs on Growing Axons
(A) Scheme of the experimental design and table showing the concentration of the principal components of the normal and diluted culture media. (B) Confocal images of hippocampal neurons (3 DIV) either unstarved or starved and treated with or without Spautin-1 (10mM) for 24 h. (C) Boxplot of the quantification of the length of longest Tau1-positive neurite in control and starved hippocampal neurons (Student’s t test).
(D) Western blot of cleaved caspase-3 from neurons starved for 24 h. As a positive control of apoptosis, neurons were treated with staurosporine (100 nM) for 24 h.
Bar plot showing the mean± SEM amount of cleaved caspase-3 using glyceraldehyde 3-phosphate dehydrogenase (GAPDH) as a loading control. Each p value
corresponds to the statistical ANOVA orthogonal contrast with the control condition.
(E) Western blot of the total and phosphorylated amount of ULK1 of 3 DIV cortical neurons either unstarved or starved for 24 h. Bar plot showing the mean± SEM amount of pULK1 using total ULK1 as a loading control (Student’s t test).
(F) Proportion of neurons with one (unipolar) or several (multipolar) Tau1-positive neurites in control neurons (DMSO treated), following treatment with rapamycin (Rapa; 50 nM) or Spautin-1 (10mM).
(G) Boxplot of the quantification of the total length of all Tau1-positive neurites in control and Spautin-1-treated (10mM) hippocampal neurons (Student’s t test). (H) LC3 and GAPDH blot of 3 DIV cortical neurons treated with Spautin-1 (10mM), Rapa (50 nM), and a combination of both drugs for 24 h. Bar plot showing the
mean± SEM amount of LC3-II using GAPDH as a loading control (ANOVA orthogonal contrast).
(I and J) Blots of total and phosphorylated ULK1 and S6 ribosomal protein, respectively, of cortical neurons (3 DIV) treated with Rapa (50 nM) or without Rapa for
24 h. Bar plots show the mean± SEM amount of pULK1 and pS6 ribosomal protein, respectively, using the non-phosphorylated proteins as loading controls
(Student’s t test).
(K) Images of cultured hippocampal neurons treated with or without Rapa (50 nM) and Spautin-1 (10mM). Arrows indicate quantified Tau1-positive axons. (L) Quantification of the total length of the longest Tau1-positive neurite in hippocampal neurons treated with Rapa (50 nM) and Spautin-1 (10mM) (ANOVA orthogonal contrast).
the role of autophagy in axonal growth, we treated hippocampal neurons with the autophagy inducer rapamycin (50 nM) for 24 h
(Figures 1H–1L and S1E). The detection of LC3-II,
pSer757-ULK1 and pSer235/236-S6 ribosomal protein levels by western blotting confirmed autophagy activation in neurons upon rapa-mycin treatment (Figures 1H–1J), and this was coincident with enhanced axonal growth (Figures 1K, 1L, andS1E). In addition, 200 nM resveratrol and 75 nM Torin1 showed similar effects (
Fig-ures S1F–S1I). The effects of rapamycin and Torin1 in axonal
extension were reversed by Spautin-1 (Figures 1K, 1L,S1H, and S1I), further demonstrating that the increased maximal axonal growth was triggered by an autophagy-dependent process.
Polarization of Autophagy-Related Proteins and VAMP7 in Developing Neurons
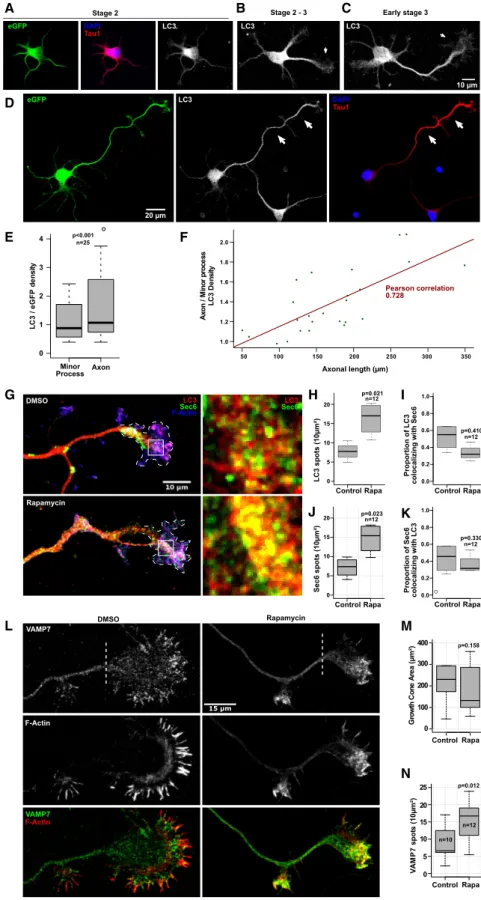
We then hypothesized that neuronal polarization might be asso-ciated with the recruitment of ATG proteins in the growing axon. To test this hypothesis, we cultured rat hippocampal neurons and characterized the distribution of LC3 during stages 2–3 when axonal growth is at its peak (Dotti et al., 1988). We ex-pressed GFP to obtain a measurement of the cell volume and stained neurons for endogenous LC3. We quantified the density of LC3 staining as the ratio of LC3 and GFP signals. We found a striking concentration of LC3 in the axon when neurons transition from stage 2 to stage 3 and during late stage 3, indicating the as-sociation of axon specification with the autophagic machinery
(Figures 2A–2E). In addition, there was a positive correlation
be-tween the length of the axon and the density of LC3 (Figure 2F). If LC3 polarizing to the axon corresponds at least in part to VAMP7-positive secretory vesicles then we would expect that autophagy should increase the amount of VAMP7, LC3, and the secretory vesicle tether exocyst in axonal tips (EauClaire
and Guo, 2003). Indeed, the exocyst subunit Sec6 marks
secre-tory vesicles involved in neurite growth (Vega and Hsu, 2001). We thus treated neurons with rapamycin for 4 h to effectively induce autophagy as detected by the appearance of LC3-II by western blotting (Figures S2A and S2B). This treatment doubled the amount of VAMP7-, LC3-, and Sec6-positive spots in axonal growth cones compared with untreated neurons (Figures 2G, 2H, 2J, 2L, and 2N), while growth cone area remained unaffected
(Figure 2M). Co-localization between LC3 and Sec6 was
unaf-fected by rapamycin (Figures 2I and 2K), suggesting that auto-phagy induced a general increase in the amount of these vesicles in growth cones. Interestingly, growth cone concentration of SNAP29, a t-SNARE that pairs with VAMP7 and inhibits its secre-tory activity (Kuster et al., 2015) as well as mediates autophago-some-lysosome fusion (Guo et al., 2014), was not significantly affected by rapamycin as determined by immunostaining in the axonal growth cone (Figures S2E and S2F) or the total amount of protein detected by western blotting (Figure S2G). Addition-ally, we also tested O-linkedb-N-acetylglucosamine (O-GlcNAc) modification of SNAP29 as this is associated with fusion be-tween autophagosomes and lysosomes and with autophagic flux (Guo et al., 2014). No significant O-GlcNAcylation of SNAP29, VAMP7, or Sec6 was observed under our experimental conditions (Figures S2H–S2K). These results strongly suggest that a pool of Sec6/LC3/VAMP7-positive vesicles can
concen-trate in growing axons, particularly in growth cones, but these vesicles appear unrelated to autophagosome-lysosome fusion. We then studied the in vivo dynamics of VAMP7 in neurons. We imaged both ATG9a, which is an autophagy-related mem-brane protein involved in autophagosome biogenesis, and VAMP7 because previous study found that these proteins co-localized (Aoyagi et al., 2018). ATG9a is localized in part to late endosomes in neurons (Tamura et al., 2010). We found the occurrence of ATG9a-red fluorescent protein (RFP)/GFP-VAMP7-positive punctae moving both anterogradely and retro-gradely in the axons of 3 DIV hippocampal neurons (Figure S3A;
Video S1). We also found that mCherry-LC3B and GFP-VAMP7
co-localized in anterogradely and retrogradely moving particles in growing axons (Figure S3B; Video S2). Co-localization be-tween LC3 and VAMP7 was high and not modified by rapamycin
(Figures S3B–S3D). However, net vesicular displacement and
particle size were significantly increased upon rapamycin addi-tion (Figures S3B, S3E, and S3F). The average speed of both retrogradely and anterogradely moving punctae was equally increased after rapamycin treatment (Figure S3G). These results led us to hypothesize a potential involvement of VAMP7 in a secretory mechanism that would be recruited upon autophagy induction in neurites.
VAMP7 Mediates NGF- and Autophagy-Induced Neurite Growth
To decipher the molecular mechanism linking autophagy, secre-tion, and neurite growth in greater detail, we generated VAMP7 and ATG5 KO PC12 cells by using CRISPR-Cas9 genome edit-ing (Figures S4A–S4D) and compared the behavior of wild-type (WT), VAMP7 KO, and ATG5 KO PC12 cells in several assays. We chose PC12 cells because neurite growth induced by nerve growth factor (NGF) was previously shown to depend on VAMP7
(Martinez-Arca et al., 2000;Racchetti et al., 2010). First, we
treated WT, VAMP7, and ATG5 KO cells with NGF to trigger neu-rite growth (Greene and Tischler, 1976). VAMP7 KO cells showed a strong decrease in neurite growth (as measured by the longest process), while it was increased in ATG5 KO cells compared with
WT (Figures 3A and 3B). We then treated the cells with
rapamy-cin and observed that the length of the single longest neurite was increased in WT and ATG5 KO, but not in VAMP7 KO, cells (
Fig-ures 3A and 3B). When we included the longest process and its
branches, neurite growth in ATG5 KO cells was increased and showed more ramifications compared with WT (Figures 3A and 3C). Rapamycin had no additional effect on total neurite length (primary neurites plus branches) in any of the three cell types
(Figures 3A and 3C). These results suggest that ATG5 KO cells
resulted in longer and more branched neurites, a result in agree-ment with the effect on Spautin-1 inducing multipolar neurons described above (Figure 1). VAMP7 KO cells were strongly impaired for neurite growth and insensitive to rapamycin (Figures 3A–3C). Re-expression of GFP-VAMP7 fully rescued both NGF-dependent and rapamycin-induced neurite growth (Figures 3D and 3E).
Lipidomics and Secretomics of VAMP7 and ATG5 KO To gain insight into how ATG5 and VAMP7 might regulate neu-rite growth, we carried out lipidomics and proteomics in our
15 μm F-Actin VAMP7 F-Actin Gr ow th C on e A rea (μ m ²) 0 100 200 300 400 M V A M P 7 spot s (1 0μ m ²) 0 5 10 15 20 25 N DMSO VAMP7 L Rapamycin G H DAPI Tau1 ● ● ● ● ● ● ● ● ● ● ● ● ● ● ● ● ● ● ● ● ● ● ● ● ● Axon / M inor proce ss LC 3 D ensity 50 100 150 200 250 300 350 1.0 1.2 1.4 1.6 1.8 2.0 Pearson correlation 0.728 F eGFP DAPI LC3 Tau1 LC3 LC3 10 μm eGFP D L C 3 / eG FP d en si ty 0 1 2 3 4 Minor Process Axon E
Stage 2 Stage 2 - 3 Early stage 3
A B C C F-ActinSec6 LC3 DMSO Rapamycin Sec6LC3 J n=25 p<0.001 I n=12 p=0.410 K Control Rapa n=12 p=0.330 n=12 p=0.023 p=0.158 n=12 p=0.012 n=10 n=12 p=0.021 LC3 Axonal length (μm) 20 μm Control Rapa
Control Rapa Control Rapa
LC3 spots (10μm²) Proportion of LC3 colocalizing with Sec6
Sec6 spots (10μm²) Proportion of Sec6 colocalizing with LC3 0.0 0.2 0.4 0.6 0.8 1.0 0.0 0.2 0.4 0.6 0.8 1.0 0 5 10 15 20 0 5 10 15 20 Control Rapa Control Rapa
Figure 2. LC3 Is Polarized to the Fast-Growing Axon in Developing Neurons and Co-localizes with the Exocyst in Growth Cones
(A–D) Images showing the distribution of endoge-nous LC3 in GFP-expressing developing hippo-campal neurons. Non-polarized neuron (A), stage 2–3 transition (B), early stage 3 (C), and late stage 3 (D). For (A)–(C), images share the same scale bar as in (C).
(E) Boxplot showing the amount of LC3 in minor processes and axons. GFP was used as a control for the differential volume of the neuronal pro-cesses (paired Student’s t test).
(F) Plot showing the correlation between axonal length and LC3 density compared with the minor processes. Green dots are the individual obser-vations.
(G) Images showing endogenous Sec6 and LC3 in the axonal growth cones of polarized (3 DIV) hip-pocampal neurons treated with or without Rapa (50 nM) for 4 h. High-magnification images of selected areas of the axonal growth cones (white boxes) are displayed in right panels.
(H and J) Boxplots showing the quantification of the number of Sec6- and LC3-positive spots in the axonal growth cone (the growth cone is delimited by the white dashed lines in G) (Student’s t test). (I and K) Boxplots showing the quantification of the proportion of LC3 spots that co-localize with Sec6 and the proportion of Sec6 spots that co-localize with LC3, respectively, and treated with Rapa (50 nM) or without Rapa for 4 h (Student’s t test). (L) Images of polarized hippocampal neurons (3 DIV) stained for endogenous VAMP7 and treated with Rapa (50 nM) or without Rapa for 4 h. The F-actin staining was used to define the growth cone, and the dashed line marks the beginning point for what we considered the growth cone during quantification.
(M and N) Boxplots showing the quantification of the growth cone area and the number of VAMP7 spots, respectively (Student’s t test).
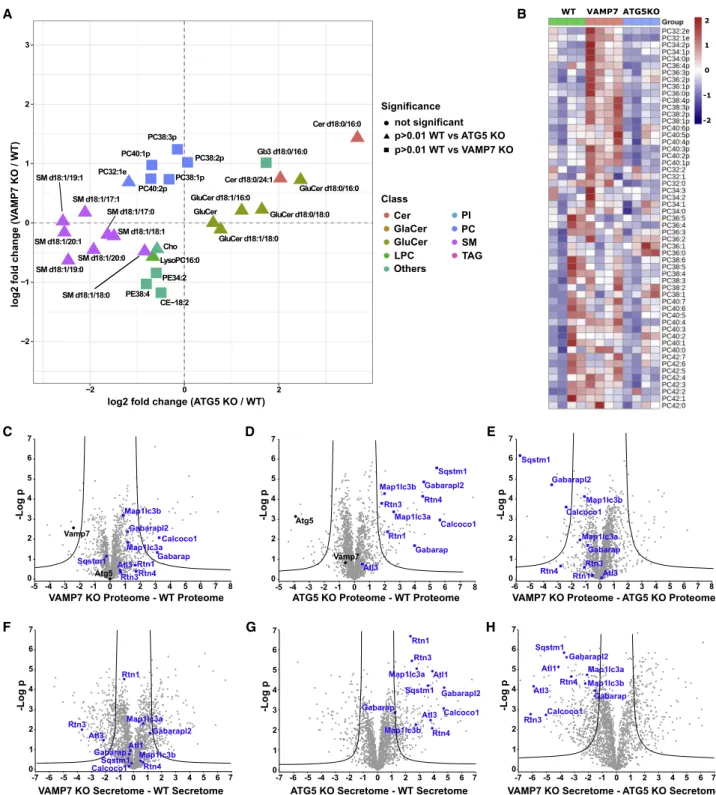
PC12 cell lines following NGF differentiation. Lipidomic analysis of WT, VAMP7 KO, and ATG5 KO PC12 cells showed that spe-cific lipids involved in neurite extension were altered in each of the mutants relative to WT (Figures 4A and 4B). In ATG5 KO cells, enhanced levels of several glucosylceramides (GluCers) including GluCer d18:0/16:0 and GluCer d18:1/18:0 were observed. The increased levels of GluCers and enhanced neu-rite growth in ATG5 KO compared with WT PC12 cells in our study were in accordance with a previous report on the inhibi-tory effects of GluCer synthase inhibitor on neurite outgrowth in PC12 cells (Mutoh et al., 1998). In particular, impeding GluCer biosynthesis was found to inhibit neuronal sprouting, which was attributed to the depletion of downstream complex glycosphin-golipids such as gangliosides in PC12 cells (Mutoh et al., 1998). Several sphingomyelins (SMs) were reduced in ATG5 KO cells
(Figure 4A), suggesting that the enhanced levels of GluCers
may be partly attributed to elevated breakdown of SMs. Impor-tantly, accumulation of ceramides has been previously found in
Arabidopsis upon ATG5 inactivation (Have´ et al., 2019);
there-fore, it is likely a conserved mechanism. On the other hand, VAMP7 KO cells exhibited reduced levels of phosphatidyletha-nolamines (PEs) such as PE 38:4 and PE 34:2 and elevated plasmalogen phosphatidylcholines compared with WT (
Fig-ure 4B). Previous work had shown that the ethanolamine moiety
of PE derived from phosphatidylserine is actively re-acylated only in PC12 cells undergoing NGF-induced neuritogenesis (
Ike-moto and Okuyama, 2000). This result is particularly interesting
because LC3 and other ATG8 molecules bind PE (Kabeya et al.,
2004;Thukral et al., 2015). This further suggests that
maintain-ing the intracellular pools of PEs may be important for both LC3 recruitment to membranes and NGF-induced neuritogenesis in PC12 cells.
We then conducted a proteomic analysis of the cell lysate and secretome of WT, ATG5, and VAMP7 KO PC12 cells. To avoid false positive results and remove extracellular vesicles (EVs) present in the cell culture media, we cultured cells without serum for 20 h before collecting the culture medium. Indepen-dent biological and technical triplicate experiments were
VAMP7 KO + GFP-VAMP7 VAMP7 KO + GFP WT DAPI ß-Tubulin D E A 0 250 500 750 B 0 100 200 300 400 500 p=0.022 p=0.383 p=0.021 p=0.128 p=0.002 p<0.001 p=0.941 p<0.001 p<0.001 p<0.001 p<0.001 100 μm C WT VAMP7 KO ATG5 KO DMSO Rapa 20μm Neurite length (μm) 0 250 500 750 Neurite length (μm)
Longest neurite Longest neurite +Branches
WT VAMP7 KO ATG5 KO WT VAMP7 KO ATG5 KO
WT VAMP7 KO
+GFP +GFP-VAMP7VAMP7 KO
Longest neurite length (μm)
DMSO Rapa DMSO Rapa DMSO Rapa Rapa DMSO VAMP7 KO + GFP-VAMP7 VAMP7 KO + GFP WT
Longest neurite Branches
p=0.834 p=0.943 p=0.991 p<0.001
p<0.001 p<0.001
Figure 3. Effect of VAMP7 and ATG5 KO on Neurite Growth in NGF-Differentiated PC12 Cells
(A) Widefield images (negative display) of tubulin-labeled WT, VAMP7 KO, and ATG5 KO PC12 cells differentiated with NGF (50 ng/mL) for 1 week and then left untreated or treated with Rapa (100 nM) overnight. Pink and green line indicates the single longest process and the connected branches, respectively. (B) Boxplot of the length of the longest neurite (pink line in A) for each condition shown in (A).
(C) Boxplot of the length of the longest process and branches (pink and green lines in A) for each condition shown in A. The p values correspond to the statistical ANOVA test for each genotype and Tukey statistical test for each experimental condition.
(D) Images of non-transfected WT, VAMP7 KO cells transfected with GFP, and VAMP KO PC12 cells transfected with GFP-VAMP7, treated with NGF (50 ng/mL) for 1 week and then treated with Rapa (100 nM) or without Rapa for 24 h.
(E) Boxplot showing the length of the single longest neurite in PC12 cells shown in (D). Each p value corresponds to an ANOVA test between the two conditions. The p values on top of the plot show the differences among the genotypes after an ANOVA test.
Sqstm1 Gabarapl2 Atl3 Map1lc3b Rtn1 Calcoco1 Atl1 Rtn3 Map1lc3a Rtn4 Gabarap
ATG5 KO Secretome - WT Secretome
Sqstm1 Gabarap Gabarapl2 Atl3 Map1lc3b Rtn1 Calcoco1 Map1lc3a Rtn3 Rtn4 -6 -5 -4 -3 -2 -1 0 1 2 3 4 5 6 7 8 VAMP7 KO Proteome - ATG5 KO Proteome Sqstm1 Gabarap Gabarapl2 Atl3 Atg5 Map1lc3b Rtn1 Calcoco1 Map1lc3a Vamp7 Rtn3 Rtn4
ATG5 KO Proteome - WT Proteome 0 1 2 3 4 5 6 7 -Log p Sqstm1 Gabarap Gabarapl2 Atl3 Atg5 Map1lc3b Rtn1 Calcoco1 Map1lc3a Vamp7 Rtn3Rtn4 -5 -4 -3 -2 -1 0 1 2 3 4 5 6 7 8 VAMP7 KO Proteome - WT Proteome
Sqstm1 Gabarapl2 Atl3 Map1lc3b Calcoco1 Atl1 Rtn3 Map1lc3a Rtn4
VAMP7 KO Secretome - ATG5 KO Secretome Gabarap
-7 -6 -5 -4 -3 -2 -1 0 1 2 3 4 5 6 7 VAMP7 KO Secretome - WT Secretome
VAMP7 ATG5KO WT -2 -1 0 2 1 -5 -4 -3 -2 -1 0 1 2 3 4 5 6 7 8 0 1 2 3 4 5 6 7 -Log p 0 1 2 3 4 5 6 7 -Log p 0 1 2 3 4 5 6 7 -Log p 0 1 2 3 4 5 6 7 -Log p 0 1 2 3 4 5 6 7 -Log p -7 -6 -5 -4 -3 -2 -1 0 1 2 3 4 5 6 7 -7 -6 -5 -4 -3 -2 -1 0 1 2 3 4 5 6 7 C D E G A F H B PE34:2 PE38:4 LysoPC16:0 PC32:1e PC38:3p PC38:2p PC38:1p PC40:2p PC40:1p SM d18:1/17:1 SM d18:1/17:0 SM d18:1/18:1 SM d18:1/18:0 SM d18:1/19:1 SM d18:1/19:0 SM d18:1/20:1 SM d18:1/20:0 Cer d18:0/16:0 Cer d18:0/24:1 GluCer d18:1/16:0 GluCer d18:0/16:0 GluCer d18:1/18:0 GluCer d18:0/18:0 Gb3 d18:0/16:0 CE−18:2 Cho GluCer −2 −1 0 1 2 3 −2 0 2
log2 fold change (ATG5 KO / WT)
log2 fold change (V
AMP7 KO / WT) Significance Class not significant p>0.01 WT vs ATG5 KO p>0.01 WT vs VAMP7 KO Cer GlaCer GluCer LPC Others PI PC SM TAG Sqstm1 Gabarapl2 Atl3 Map1lc3b Rtn1 Calcoco1 Atl1 Rtn3 Map1lc3a Rtn4 Gabarap
Figure 4. Lipidomic and Secretomic Analysis of WT, VAMP7 KO, and ATG5 KO PC12 Cells
(A) Scatterplot of the changes in cellular lipid profiles in VAMP7 KO (vertical axis) and ATG5 KO (horizontal axis) relative to WT PC12 cells. Lipids that were significantly altered (p < 0.05 from Student’s t test) were enlarged and are represented by rectangles (VAMP7 KO versus WT) and triangles (ATG5 KO versus WT). (B) Heatmap plot showing the difference in abundance of plasmalogen (PCs) lipid species in WT, VAMP7 KO, and ATG5 KO PC12 cells.
(C–E) Volcano plots showing the proteome of the extracted proteins significantly enriched in WT versus VAMP7 KO (C), WT versus ATG5 KO (D), and ATG5 KO versus VAMP7 KO (E). Black lines denote the statistical significance boundary. Proteins of interest are highlighted in blue.
(F–H) Volcano plots showing the secretome proteins significantly enriched in WT versus VAMP7 KO (F), WT versus ATG5 KO (G), and ATG5 KO versus VAMP7 KO (H). Black lines denote the statistical significance boundary. Proteins of interest are highlighted in blue.
A
E
DMSO Rapa Baf DMSO Rapa Baf DMSO Rapa Baf
WT VAMP7 KO ATG5 KO
Input
DMSO Rapa Baf DMSO Rapa Baf DMSO Rapa Baf
WT VAMP7 KO ATG5 KO
Secreted medium (EVs, 15K pellet)
RTN3 p62 GAPDH VAMP7 LC3 I> II> - 25 - 25 - 25 - 50 - 15 +NGF
DMSO Rapa Baf DMSO Rapa Baf DMSO Rapa Baf
WT VAMP7 KO ATG5 KO
Input
DMSO Rapa Baf DMSO Rapa Baf DMSO Rapa Baf
WT VAMP7 KO ATG5 KO
Secreted medium (acetone precipitation)
RTN3 p62 GAPDH LC3I> II> - 25 - 15 - 50 - 25 B J p=0.158 p=0.001 F WT PC12 +
WT Conditioned media VAMP7 KO Conditioned mediaWT PC12 + ATG5 KO Conditioned mediaWT PC12 +
20 μm
WT VAMP7
KO ATG5KO
Longest neurite length (μm)
no NGF Conditioned media: D H I
Normalized fractional release
RTN3 (a.u) Rapa: Baf: WT VAMP7 KO ATG5 KO + - -+ -- + - -+ -- + - -+ -100 200 300 400 Rapa: Baf: WT VAMP7 KO ATG5 KO + - -+ -- + - -+ -- + - -+
-Normalized fractional release
p62 (a.u)
Normalized fractional release
RTN3 (a.u) Rapa: Baf: WT VAMP7 KO ATG5 KO + - -+ -- -- +- +- -- +- -+ Rapa: Baf: WT VAMP7 KO ATG5 KO + - -+ -- -- +- -+ -- +- +
-Normalized fractional release
p62 (a.u) 0 1 2 3 4 0 1 2 3 4 0 1 2 3 4 0 1 2 3 4 p<0.01 p<0.05 p<0.05 p<0.01 p<0.05 p<0.001 p<0.001 p<0.05 p<0.01 p<0.001 p<0.05 p>0.05 G Rapa: Baf: WT VAMP7 KO + - -+ -- + - -+
-Normalized fractional release
LC3-II (a.u) 0 1 2 3 4 p<0.001 C Rapa: Baf: WT VAMP7 KO + - -+ -- -- +- +
-Normalized fractional release
LC3-II (a.u) 0 1 2 3 4 p>0.05
analyzed by mass spectrometry so that a quantitative analysis could be performed both in cell lysates and secretomes. Compared with WT samples, ATG5 and VAMP7 were undetect-able in their respective KO PC12 cell line (Table S2). These data confirmed the genotypes of our cell lines and the sensitivity and reliability of our approach. We then analyzed the secretome of WT, VAMP7 KO, and ATG5 KO PC12 cells. We found that WT cells released proteins that were significantly less abundant in the VAMP7 KO secretome (Figures 4F;Table S2, secretome: fil-ter ‘‘DOWN V7’’). In the secretome of ATG5 KO cells, we found several autophagy-related proteins that were significantly increased (RTN1, CALCOCO1, Atlastin/ATL1, SQSTM1/p62, MAP1LC3B/LC3b, RTN4, MAP1LC3A/LC3a, GABARAP, GA-BARAPL2, RTN3, ATL3;Figure 4G;Table S2, secretome: filter ‘‘UP ATG5’’). Interestingly, ER-phagy adaptor proteins RTN3 and ATL3 were significantly more abundant in ATG5 KO and less abundant in VAMP7 KO secretomes (Figures 4F and 4G;
Table S2, secretome: filter ‘‘DOWN V7’’ and ‘‘UP ATG5’’;
RTN3 and ATL3 are the two top proteins following this criterion). In addition, we found 483 secreted proteins classified as ‘‘extra-cellular vesicular exosome’’ (Table S2, secretome: filter ‘‘extra-cellular vesicular exosome’’ from column ‘‘GOCC name’’). Of these 483 proteins, 68 are significantly ‘‘UP’’ or ‘‘DOWN’’ in VAMP7 KO and 73 in ATG5 KO, indicating effect of both KOs on the secretion of exosomal proteins. When we compared ATG5 and VAMP7 KO secretomes, RTN1, CALCOCO1, ATL1, SQSTM1/p62, MAP1LC3B/LC3b, RTN4, MAP1LC3A/LC3a, GABARAPL2, RTN3, and ATL3 appeared significantly more abundant in ATG5 KO (Figure 4H;Table S2). According to pub-lished reports, a block in macroautophagy can lead to the acti-vation of chaperone-mediated autophagy (CMA) (Kaushik et al., 2008). We specifically searched for KFERQ-containing proteins as markers of the CMA pathway (Kirchner et al., 2019;Sahu
et al., 2011), but we did not find any that would be significantly
enriched in ATG5 KO and decreased in VAMP7 KO secretome
(Table S2, secretome: filter ‘‘DOWN V7’’ and ‘‘UP ATG5’’ and
sort KFERQ using filter in CMA column). In conclusion, we found that VAMP7 KO and ATG5 KO, which have opposite effects on neurite growth, had clear opposite effects only in the secretion of RTN3 and ATL3, which are related to ER-phagy.
VAMP7 Mediates Autophagy-Stimulated Unconventional Secretion of RTN3
Next, we confirmed our prior results by performing western blot-ting of the cell lysates and the secretomic fractions. WT, VAMP7 KO, and ATG5 KO PC12 cells were either differentiated using NGF or left undifferentiated; thereafter, they either remained un-treated or were un-treated with rapamycin or bafilomycin A1. ATG5 KO cells showed a very strong p62 accumulation and a virtual absence of LC3-II (Figures 5A and 5E, left, andS5A, S5B, S5D, and S5E); thus, they were fully autophagy impaired as expected. The accumulation of p62 in ATG5 KO cells indicated that p62 degradation in autophagolysosomes, which requires ATG5 for their biogenesis (Rubinsztein et al., 2012), is the main mecha-nism of p62 catabolism. The level of p62 was not significantly affected by rapamycin and slightly increased by bafilomycin A1 in WT and VAMP7 KO cells (Figures 5A and 5E, left, andS5A and S5D). Rapamycin did not have a robust effect on LC3-II in both WT and VAMP7 KO cells. Only bafilomycin A1, an autopha-gic flux inhibitor (Mauvezin and Neufeld, 2015), significantly increased LC3-II in both genotypes, suggesting that autophagic flux was high in both (Figures 5A and 5E, left, andS5B and S5E). Furthermore, the persistence of the effect of bafilomycin A1 in VAMP7 KO cells indicated that autophagosome formation and autophagosome-lysosome fusion could still proceed in the absence of VAMP7. The main band that we could detect of RTN3 in PC12 cells had an apparent molecular weight (MW) slightly below 25 kDa (Figures 5A and 5E, left) and thus corre-sponds to RTN3A1, one of the short isoforms (Di Scala et al., 2005). We did not observe significant effects of the tested drugs on RTN3 expression levels in either KO cell lines (Figures 5A and 5E, left, andS5C and S5F).
For western blot analysis of the secretome, which includes both soluble secreted proteins and proteins associated with secreted EVs, we first precipitated the conditioned medium us-ing acetone to get the total protein content, an approach similar to the secretome analysis by proteomics described above. By analyzing the acetone-precipitated secreted amount as a frac-tion of the total content (so-called fracfrac-tional release), we confirmed the proteomic analysis carried out in NGF-treated cells and found that loss of VAMP7 decreased secretion of
Figure 5. Western Blot Analysis of VAMP7 KO and ATG5 KO PC12 Cell Lysates and Secretomes
(A–D) WT, VAMP7 KO, and ATG5 KO PC12 were differentiated with NGF for 1 week and then treated with DMSO as control, Rapa (100 nM), or bafilomycin A1 (Baf; 100 nM) overnight. (A) Left: equal amounts of cell lysate proteins were processed for SDS-PAGE/western blot analysis and loaded in a gel. Right: the corre-sponding secretomes were precipitated with acetone, resuspended with equal volumes of lysis buffer, and equal amounts relative to input were processed for SDS-PAGE and western blot analysis. (B–D) Fractional release (secreted fraction/cell lysate) of p62 (B), LC3-II (C), and RTN3 (D) was estimated by densitometry analysis of the corresponding bands from three independent experiments. The p values show the differences among the genotypes and drug treatments after a one-way ANOVA test.
(E–H) Undifferentiated WT, VAMP7 KO, and ATG5 KO PC12 were treated with DMSO as control, Rapa (100 nM), or Baf (100 nM) overnight. (E) Left: equal amounts of cell lysate proteins were loaded, processed for SDS-PAGE, and western blot analysis. Right: the corresponding secretomes were centrifuged at 15,0003 g to recover larges EVs, the pellets were resuspended with equal volumes of lysis buffer, and equal volumes relative to input were processed for SDS-PAGE and western blot analysis. (F–H) Fractional release (secreted fraction/cell lysate) of p62 (B), LC3-II (C), and RTN3 (D) was estimated by densitometry analysis. The p values show the differences among the genotypes and drug treatments after a one-way ANOVA test. In all cases, the membranes were probed to detect the indicated proteins p62, GAPDH, RTN3, LC3 (A and E) and VAMP7 (E). The position of MW markers is indicated. (A and E) Western blot representative from four independent experiments are displayed.
(I) WT PC12 were differentiated for 7 days with the conditioned medium obtained from serum-free differentiation media WT, ATG5 KO, or VAMP7 KO PC12 cells. After the treatment, cells were fixed and processed for immunocytochemistry. Neurites were visualized by tubulin staining.
RTN3, while ATG5 KO increased it (Figures 5A, right, and 5D). The effects of VAMP7 KO and ATG5 KO on p62 secretion were not significant (Figures 5A, right, and 5B). The secreted fraction only increased proportionally to the cellular content in the case of ATG5 KO. LC3-II was barely detectable in the secretome of VAMP7 KO cells (Figure 5A, right), and we could not observe any significant difference (Figure 5C), likely because the signal was too low for proper quantification. In agreement with input levels (Figures S5B and S5E), LC3-II was virtually absent in ATG5 KO secretomes, which enables quantification of fraction release for this genotype.
In order to gain precision in the quantification of secretion of RTN3, a membrane-associated protein, we then precipitated the conditioned medium at 15,0003 g (15K) to recover large EVs content. We used untreated PC12 cells in order to obtain large amounts. Based on Ponceau staining, we estimated that proteins secreted in large EVs corresponded to ~15%–20% of the total secreted proteins, both in NGF-treated and untreated cells (Figure S5G). The secretion of p62 was greatly enhanced in bafilomycin-A1-treated WT but much less in VAMP7 KO cells
(Figures 5E, right, and 5F), indicating that VAMP7 is required for
the secretion of p62 when its degradation is impaired. Interest-ingly, ATG5 KO did not affect the release of p62, in agreement with the notion that ATG5 is required to capture p62 in mem-brane structures (Romanov et al., 2012). We were able to identify LC3-II in the 15K fraction secreted by WT cells, particularly following bafilomycin A1 treatment, and the amount was greatly decreased in the same condition in VAMP7 KO cells (Figures 5E, right, and 5G). Secreted LC3-II was impossible to detect in ATG5 KO cells, as previously mentioned (data not shown inFigure 5G). The secretion of LC3-II in the 15K fractions was strongly affected by VAMP7 KO in bafilomycin-A1-treated cells. We confirmed the presence of RTN3 in the 15K fractions and the effect of VAMP7 and ATG5 KO, which decreased and increased, respectively, the amounts of RTN3 (Figures 5E, right, and 5H). In the secretome of both WT and ATG5 KO cells, we detected the full-length VAMP7 and a 15-kDa fragment likely corresponding to the cytoplasmic domain of VAMP7 as our antibody was generated against this domain (Figures 5A and 5E, right) (Verraes et al., 2018), a domain that was shown to contain a LIR (Gu et al., 2019).
Altogether, biochemical analysis of the secretome of PC12 cells clearly indicated that VAMP7 was required for the release of RTN3, p62, and LC3-II in large EVs and that ATG5 KO released more RTN3 than WT cells.
We next characterized the subcellular localization of endoge-nous RTN3 using immunocytochemistry in NGF-differentiated WT, VAMP7 KO, and ATG5 KO PC12 cells. We carried out dou-ble RTN3 and CD63 staining because CD63 is a marker of secre-tory late endosomes (Kowal et al., 2014) previously shown to co-localize with VAMP7 in PC12 cells (Coco et al., 1999). We found a rare but still distinguishable pool of membrane structures posi-tive for both RTN3 and CD63 in WT cells (less than 5% CD63 in RTN3, less than 2% RTN3 in CD63 staining, as estimated following 3D particle detection;Figures S6A–S6C). The occur-rence of CD63 in RTN3 staining was affected both by VAMP7 and ATG5 KO (Figures S6A–S6C). We think that this is a strong indication that RTN3/CD63 co-localization depends on both degradative and secretory ER-phagy.
Next, we asked whether VAMP7- and ATG5-dependent secre-tomes could participate in a signaling mechanism involved in neurite growth. To answer this question, we first collected me-dium conditioned by NGF-treated WT, VAMP7 KO, and ATG5 KO PC12 cells. We then treated naive WT PC12 cells with these different conditioned media and measured maximal neurite length. VAMP7 KO conditioned medium showed no significant effect, whereas ATG5 KO conditioned medium had slight but significant inhibitory effect (Figures 5I and 5J). Therefore, the role of VAMP7-dependent secretion did not appear to depend on a paracrine mechanism but to be rather cell autonomous. The increased secretion of ATG-related proteins in ATG5 KO might have inhibitory effects on neurite growth in addition to the cell autonomous overgrowth observed in ATG5 KO PC12 cells.
Role of VAMP7 in Nutrient-Deprived Neurons and RTN3 Subcellular Localization
We then asked whether acute inactivation of VAMP7 in neu-rons could prevent the effect of autophagy modulation on axonal growth. In order to acutely inhibit VAMP7-dependent functions without altering VAMP7 expression, we generated a VHH antibody, corresponding to the variable region of a heavy chain of a camelid antibody directed against the cyto-plasmic domain of VAMP7 by phage display (see STAR
Methods). We characterized the clone F1.1, one of the positive
clones, by yeast two-hybrid assay and immunocytochemistry, showing that this nanobody specifically bound to and co-local-ized with VAMP7, but not VAMP2, VAMP4, Sec22, or GFP (
Fig-ures S7A–S7G). When we expressed mCherry-F1.1 as an
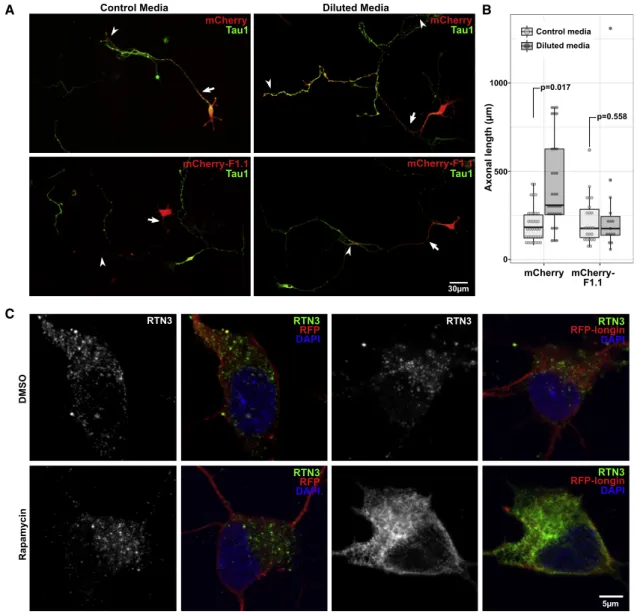
in-trabody in 2 DIV hippocampal neurons, we found a complete inhibition of the effect of nutrient restriction in axonal length compared with neurons expressing mCherry alone (Figures 6A and 6B). In previous work, we and others showed that acute expression of the auto-inhibitory Longin domain of VAMP7 had a profound effect on axonal growth (
Martinez-Arca et al., 2001) and inhibited VAMP7-dependent secretion
(Gupton and Gertler, 2010). Here, we expressed RFP or
RFP-Longin in 2 DIV cultured neurons either left untreated or treated with rapamycin. We found that rapamycin treatment induced large punctae of RTN3 in control RFP-expressing neu-rons, but not in RFP-Longin-expressing neurons. Instead, we found a reticular staining of RTN3, reminiscent of ER sheets in rapamycin-treated RFP-Longin-expressing neurons (
Fig-ure 6C). Altogether, these results suggest that axonal
over-growth induced by nutrient restriction required VAMP7 and that inhibiting VAMP7-dependent secretion impaired the sub-cellular localization of RTN3, further strengthening the relation-ship between VAMP7 and RTN3.
DISCUSSION
Here, we found that nutrient restriction and autophagy modula-tion impacted axonal growth via a VAMP7- and autophagy-dependent secretion of ER LIR-containing proteins Reticulons and Atlastins. By showing the role of VAMP7 in both ER-phagy and exocytosis-mediated neurite growth, we have bridged two yet unconnected cellular pathways.
Role of Autophagy in Neurite Growth
Here, we found that autophagy activation by nutrient restriction, rapamycin, Torin1, or resveratrol and autophagy inhibition by Spautin-1 or by knocking out ATG5 trigger different modalities of neurite overgrowth. The fact that nutrient restriction and several drugs that induce autophagy by direct (rapamycin, Torin1) or indirect (resveratrol) inhibition of mTOR (Zhou et al., 2010) showed similar effects on neurite growth clearly indicates that the effect was related to autophagy. The effect of nutrient re-striction and autophagy induction was limited to overgrowth of the axon in neurons and the longest process in NGF-differenti-ated PC12 cells. The positive effect on axonal growth of nutrient restriction was not due to a change in Glc concentration as this
was maintained constant and was not due to insulin limitation because we specifically tested the effect of diluting only insulin. Future studies should address the specific components of the diluted nutrients that trigger this response in neurons. Amino acids such as Leu and Arg are certainly potential candidates for their roles in autophagy (Mordier et al., 2000;Savaraj et al.,
2010).
It is intriguing that both activation and inhibition of autophagy would enhance neurite growth, but what may here appear as a paradox could be explained in the context of neuronal polarity and neurite branching. Indeed, Spautin-1 induced multipolar axons, and ATG5 KO in PC12 cells led to longer, highly branched neurites. It is conceivable that the molecular mechanisms
Control Media Diluted Media
p=0.017 p=0.558 Tau1 Tau1 mCherry-F1.1 30μm Tau1 mCherry Tau1 mCherry 5μm C RTN3 RTN3 RFP DAPI RTN3 RFP-longin DAPI RTN3 DMSO RTN3 RFP DAPI RTN3 RFP-longin DAPI Rapamycin B mCherry mCherry-F1.1 Axonal length (μm) 0 500 1000 A mCherry-F1.1 Control media Diluted media
Figure 6. Role of VAMP7 in Nutrient Restriction-Induced Axonal Overgrowth and RTN3 Subcellular Localization in Hippocampal Neurons
(A) Images of hippocampal neurons transfected with a mCherry-tagged nanobody directed against VAMP7 (clone F1.1) or mCherry as a control and either left unstarved or starved for 24 h. Arrows indicate the beginning of an axon, and arrowheads point to the ends.
(B) Boxplot of the quantification of the total axonal length of transfected and starved hippocampal neurons (Student’s t test).
(C) Images of hippocampal neurons transfected with RFP as a control or RFP-Longin and treated with Rapa (100 nM) or without Rapa for 4 h. Grayscale displays of RTN3 staining are shown in left panels.
underlying the increased axonal extension after autophagy acti-vation and the emergence of multiple axons (or ramified pro-cesses in PC12) after autophagy inhibition partially overlap. Both modalities of neurite growth could be due to VAMP7-dependent secretion because the overgrowth effect of rapamy-cin and neurite ramification were both abolished in VAMP7 KO cells. Autophagy activation increases axonal length, but it does not produce supernumerary axons, suggesting that this mecha-nism is at least partially independent of axonal specification. Accordingly, we found that LC3 polarized into the axon and that rapamycin enhanced the motility of LC3/VAMP7 vesicles, suggesting that autophagy might participate to axonal extension by regulating the transport of endosomes in axons versus sec-ondary neurites. These observations might suggest that auto-phagy may prevent axonal overgrowth, regulate ramification, and participate to axon specification during neuronal develop-ment, in line with the notion that the molecular regulation of axonal growth and axonal specification are inter-connected (
Ca´-ceres et al., 2012). We have observed that nutrient restriction
ac-tivates autophagy downstream of mTOR, which has already been associated with the regulation of cell growth, particularly in dividing cells (Jewell and Guan, 2013). Our results are in good agreement with the notion that both reduced mTOR signaling and excess activation of mTOR signaling cause abnormal development of neurons (Takei and Nawa, 2014). Role of VAMP7-Dependent Secretory ER-Phagy in Neurite Growth
Our previous work and that of others suggested an important role of VAMP7-dependent secretion in neuronal development (
Al-berts et al., 2003; Burgo et al., 2012,2013; Colombo et al.,
2014;Fuschini et al., 2018;Gupton and Gertler, 2010;Jausoro
and Marzolo, 2021;Martinez-Arca et al., 2000,2001). These
re-sults were based on mRNA silencing approaches and expression of the auto-inhibitory Longin domain in cultured neurons and NGF-treated PC12 cells. The VAMP7 KO mouse had a smaller brain, similar to several autophagy-deficient mouse models
(Takei and Nawa, 2014), but VAMP7 / neurons were still able
to develop in vitro (Danglot et al., 2012). It is possible that other secretory pathways, particularly those involving VAMP4 or Sec22b (Colombo et al., 2014; Grassi et al., 2015;Petkovic
et al., 2014), could compensate for the lack of VAMP7 in /
neu-rons in culture. VAMP7 was already associated to secretory late endosomes and lysosomes in PC12 cells (Coco et al., 1999) and sensory neurons in which it is involved in the transport of the cold-sensing receptor TRPM8 (Ghosh et al., 2016). Here, using intra-body transfection, we were able to circumvent the potential func-tional compensation that might occur in the mouse KO neurons. Using this approach, we found an important role of VAMP7 in axonal growth when nutrient restriction conditions were applied shortly after transfection of an intrabody targeted against VAMP7. These data are in good agreement with the decreased neurite growth observed in NGF-treated VAMP7 KO PC12 cells, the lack of effect of rapamycin on neurite growth, and the rescue effect on neurite extension by re-expressing VAMP7 in VAMP7 KO PC12 cells. Part of the role of VAMP7 in neurite growth is certainly related to its involvement in the cell surface transport of L1-CAM (Alberts et al., 2003) and the Glc transporter Glut1
(Hesketh et al., 2014). Surface expression of Glut1 was shown
to be stimulated by autophagy (Roy et al., 2017). Furthermore, VAMP7 exocytosis is regulated by Netrin-1 (Winkle et al., 2014) and its receptor DCC (Cotrufo et al., 2011). Netrin-1 activates mTOR (Bai et al., 2017) and UNC-5, the netrin receptor in the nematode, is related to UNC-51, a Ser/Thr kinase homologous to yeast Atg1, which is required for autophagy (Ogura and
Gosh-ima, 2006). Altogether, data herein and in previous publications
suggest that VAMP7-mediated secretion could be strongly dependent on the metabolic state of the cell.
Here, we found that VAMP7 KO cells were defective in the secretion of p62, LC3-II, and RTN3 in large EVs. In addition, ex-pressing the Longin domain, which was previously found to inhibit axonal growth and VAMP7-dependent exocytosis (
Gup-ton and Gertler, 2010;Martinez-Arca et al., 2001), affected the
subcellular localization of RTN3, further strengthening the rela-tionship between VAMP7 and RTN3. The abnormal subcellular localization of RTN3 in neurons expressing RFP-Longin and treated with rapamycin likely reflects a dysfunctional ER (Sharoar
et al., 2016). RTN3 is particularly interesting in relation with
neu-rite growth because its overexpression was associated with dystrophic neurites (Hu et al., 2007). The main form of RTN3 that we recovered in the secretome corresponds to RTN3A1, a short form that has not been associated to degradative ER-phagy in contrast to the long form (Grumati et al., 2017), suggest-ing that degradative and non-degradative autophagy-related processes may participate in different aspects of neuronal devel-opment. It is tempting to further speculate that long forms of RTN3 could be associated with degradative ER-phagy as previ-ously shown (Grumati et al., 2017) and short forms with secretory ER-phagy (this study), providing an interesting control check-point between different autophagy-related processes. When degradation in autolysomes is inhibited by loss of ATG5 or bafi-lomycin A1 treatment, neuronal cells would ramp up a VAMP7-dependent secretory mechanism to eliminate Reticulons and Atlastins (Figure 7).
Reticulons form tubular ER membrane structures (Voeltz et al., 2006) and ER tubules, which are relatively poor in ribosomes
(Shibata et al., 2006). These might also accumulate integral
membrane proteins and be connected to lipid synthesis (West
et al., 2011). In addition, RTN3 regulates ER-to-Golgi transport
(Wakana et al., 2005), and overexpression of RTN4 was found
to enhance the secretory pathway, most likely of integrins (
Mu-kherjee and Levy, 2019). Regulating supply from the ER to the
Golgi is important for neurite outgrowth (Ruhl et al., 2019). Our data suggest that VAMP7-dependent secretion of LIR-contain-ing Reticulons and Atlastins may contribute to neurite growth in part by regulating the early secretory pathway. It is tempting to speculate that neurite growth induces a strong upregulation of the ER to sustain the increased anabolism of proteins and lipids. Eliminating some ER surplus by both VAMP7-dependent secretory and ATG5-dependent degradative ER-phagy (Figure 7) would thus appear as a fitness mechanism. Both pathways might be involved in eliminating aggregates of secretory proteins as shown in the case of misfolded proinsulin and collagen aggre-gates (Cunningham et al., 2019;Omari et al., 2018) or preventing the occurrence of RTN3-mediated dystrophic neurites (Hu et al.,
Both VAMP7 KO and ATG5 KO showed lipidome defects. ATG5 KO cells showed increased GluCers and increased neurite length in agreement with a previous report on the inhibitory ef-fects of GluCer synthase inhibitor on neurite outgrowth in PC12 cells (Mutoh et al., 1998). VAMP7 KO cells exhibited reduced levels of PE. Both ceramides (Jiang and Ogretmen, 2014) and
PE (Rockenfeller et al., 2015) participate in autophagy and in
ER-phagy related to ER stress (Ellert-Miklaszewska et al.,
2020;Viswanath et al., 2018). ATG8 proteins such as LC3 are
re-cruited and conjugated to PE on the autophagic membrane
(Thukral et al., 2015). Therefore, VAMP7’s function in
auto-phagy-dependent neurite growth could be related to transport of lipids and the recruitment of ATG8 molecules to secretory late endosomes and to the growing neurite.
We recovered large amounts of RTN3 in EVs and found the occurrence of a small subset of co-localized RTN3 and CD63 in WT cells. To be released in EVs, RTN3 would need to enter luminal vesicles of CD63+ late endosomes after the fusion of ER-derived vesicles with the limiting membrane of late somes or via the engulfment of ER-vesicles inside the late endo-somes (Figure 7). VAMP7 interacts with the ER-SNAREs SNAP47 and Syntaxin5 (Kuster et al., 2015; Siddiqi et al., 2006); thus, ER-late endosome fusion is certainly a viable hy-pothesis that will require further investigation. We found high
amounts of LC3-II, RTN3, and VAMP7 cytosolic domain in secreted membranes pelleting at 15K, particularly following ba-filomycin A1 treatment. This suggests that these membranes have a buoyancy much larger than typical exosomes that are recovered at 100,0003 g (Bobrie et al., 2012) and that these EVs contain cytosolic proteins (i.e., the cytoplasmic domain of VAMP7). Thus, engulfment of RTN3-containing ER-derived membranes in late endosomes as it was observed in the case of Sec62+membranes (Loi et al., 2019) appears as a likely mech-anism of recruitment of RTN3 into EVs. Regardless, we exclude the possibility that released RTN3 would originate from plasma membrane shedding because we found no evidence of VAMP7-dependent release of abundant plasma membrane pro-teins in the extracellular medium (Table S2). Our evidence of VAMP7-dependent secretion of LC3-II further suggests that VAMP7 mediates the secretory mechanism recently revealed in non-neuronal cells (Leidal et al., 2020). The fact that bafilomy-cin A1 increased the release of p62, LC3-II, and RTN3 in a VAMP7-dependent manner further suggests that VAMP7 might mediate the release of amphisomes, which results from auto-phagosome-late endosome fusion (Figure 7).
We did not find any significant effect of culture medium conditioned by VAMP7 KO compared with WT cells on neurite growth of naive cells. This suggests that the mechanisms Figure 7. Working Model of ATG5- and VAMP7-Dependent ER-Phagy Pathways
Fragments of the ER may be degraded by an ATG5-dependent autophagy mechanism (1. Degradative ER-phagy—top part of the model, red arrow), allowing for the catabolism of LC3, p62, GABARAP, CALCOCO, RTN3, and ATL3. Alternatively, ER fragments and associated proteins Reticulons and Atlastins (RTN3 and ATL3, red box) may be incorporated into secretory structures such as late endosomes/amphisomes (2. Secretory ER-phagy—bottom part of the model, green arrow). ER fragments could become associated with late endosomes/amphisomes via the fusion of ER-derived vesicle or engulfment (engulf.) in nascent in-traluminal vesicles of late endosomes/amphisomes. Late endosome/amphisome fuse with the plasma membrane in a VAMP7-dependent manner releasing Reticulons in membranous structures as we have shown inFigure 5. If the degradative route is inhibited by Spautin-1 or in ATG5 KO, catabolism is impaired, secretory ER-phagy (pathway 2) would still be active and generate longer and more ramified neurites as shown here. If secretory ER-phagy is impaired by VAMP7 KO, the degradative route would still be active at the same time as neurite growth is impaired. Inhibition of mTOR by Rapa would activate both 1. Degradative ER-phagy and 2. VAMP7-dependent secretory ER-ER-phagy. Degradative ER-ER-phagy would be involved in preventing overgrowth and controlling branching, while secretory ER-phagy would be positively involved in growth.
unraveled here are primarily cell autonomous, but it still does not exclude the possibility of autocrine effects or paracrine ef-fects at short distances, particularly in the context of the pres-ence of RNA-binding proteins in LC3-II-positive EVs (Leidal
et al., 2020). In fact, the inhibitory effect of the ATG5 KO
secre-tome on neurite growth may suggest that the lack of degrada-tive autophagy profoundly deregulates neurite growth with both cell-autonomous neurite overgrowth and non-cell-auton-omous inhibition of growth. Our results are in good agreement with the recent finding that a proteolytic C-terminal fragment of Reticulon 4A is released in exosomes and inhibits axon regen-eration (Sekine et al., 2020). Further characterization of the biochemical content of these secreted membranes may reveal their autocrine or paracrine effects on specific cellular functions.
In conclusion, our findings suggest that endosomes can mediate the release of ER-phagy elements such as Reticulons and Atlastins in a VAMP7-dependent manner during neurite growth and neuronal polarization. Further studies will be important not only in the context of brain development but also for brain function after development, particularly because Reticulons and Atlastins have largely been associated with neurodegenerative diseases (Yamanaka and Nukina, 2018) and VAMP7 with sex-related disease in humans (
Cha´vez-Lo´-pez et al., 2020; Tannour-Louet et al., 2014). Our findings
further add secretory ER-phagy as a route of unconventional secretion.
STAR+METHODS
Detailed methods are provided in the online version of this paper and include the following:
d KEY RESOURCES TABLE
d RESOURCE AVAILABILITY
B Lead Contact
B Materials Availability
B Data and Code Availability
d EXPERIMENTAL MODEL AND SUBJECT DETAILS
B Cell lines
B Primary cultures
d METHOD DETAILS
B Cell treatments with chemicals
B Protein electrophoresis and western blot
B Secretome fractionation
B Lipidomic analysis
B Proteomic analysis
B Immunofluorescence and microscopic imaging
B CRISPR/Cas9 genetic engineering
B Selection of the VHHs against VAMP7
d QUANTIFICATION AND STATISTICAL ANALYSIS
B Image analysis
B Statistical analysis SUPPLEMENTAL INFORMATION
Supplemental Information can be found online athttps://doi.org/10.1016/j.
celrep.2020.108536.
ACKNOWLEDGMENTS
We thank Eric Chevet, Somya Vats, Sharon Tooze, and Guillaume van Niel for critical reading of the manuscript and helpful discussion and Somya Vats for final editing. We thank all members of the laboratory for their assistance and discussions. Work in our group was funded by grants from Association Fran-c¸aise contre les Myopathies (16612), the French National Research Agency (NeuroImmunoSynapse ANR-13-BSV2-0018-02; MetDePaDi ANR-16-CE16-0012), the Institut National Du Cancer (PLBIO 2018-149), the Fondation pour la Recherche Me´dicale (FRM, Labe´lisation T Galli), Who am I? Labex (Idex ANR-11-IDEX-0005-01), and awards of the Association Robert Debre´ pour la Recherche Me´dicale and Fondation Bettencourt-Schueller to T.G. Collabo-rative grants associating T.G. and M.I.C. were from ECOS-Sud-CollaboCollabo-rative Project (A13S02 MINCyT-ECOS) and Idex USPC (ANR-11-IDEX-0005, ‘‘Con-ventional and Uncon‘‘Con-ventional Secretion in Neurite Growth’’). Imaging was car-ried out at NeurImag Imaging core facility, part of the IPNP, INSERM U1266,
Universite´ de Paris. We thank Leducq Foundation (LEDUCQ
RE-TP_2016_U894_GALLI_TANTER) for funding the Leica SP8 Confocal/STED 3DX system. We acknowledge B&B technological core facility of IPNP for tech-nical support and the ImagoSeine core facility of the Institut Jacques Monod, member of the France BioImaging (ANR-10-INBS-04), for their services.
AUTHOR CONTRIBUTIONS
Conceptualization, J.W., S.N., and T.G.; Methodology, J.W., S.N., B.C., I.C.G., and G.S.; Investigation, J.W. S.N., B.C., P.B., F.F., J.L., S.M.L., J.N., A.S., A.O., C.M.F., and T.G.; Data Analysis, J.W., S.N., M.T.P., S.M.L., G.S., I.C.G., and T.G.; Writing – Original Draft, J.W., S.N., and T.G.; Funding Acqui-sition, T.G.; Supervision, C.M.F., M.I.C., I.C.G., and T.G.
DECLARATION OF INTERESTS
The authors declare no competing interests. Received: August 24, 2019
Revised: October 28, 2020 Accepted: November 25, 2020 Published: December 22, 2020
REFERENCES
Alberts, P., Rudge, R., Hinners, I., Muzerelle, A., Martinez-Arca, S., Irinopou-lou, T., Marthiens, V., Tooze, S., Rathjen, F., Gaspar, P., and Galli, T. (2003). Cross talk between tetanus neurotoxin-insensitive vesicle-associated mem-brane protein-mediated transport and L1-mediated adhesion. Mol. Biol. Cell 14, 4207–4220.
Aoyagi, K., Itakura, M., Fukutomi, T., Nishiwaki, C., Nakamichi, Y., Torii, S., Makiyama, T., Harada, A., and Ohara-Imaizumi, M. (2018). VAMP7 Regulates Autophagosome Formation by Supporting Atg9a Functions in Pancreatic b-Cells From Male Mice. Endocrinology 159, 3674–3688.
Bai, L., Mei, X., Shen, Z., Bi, Y., Yuan, Y., Guo, Z., Wang, H., Zhao, H., Zhou, Z., Wang, C., et al. (2017). Netrin-1 Improves Functional Recovery through Auto-phagy Regulation by Activating the AMPK/mTOR Signaling Pathway in Rats with Spinal Cord Injury. Sci. Rep. 7, 42288.
Birgisdottir, A˚.B., Lamark, T., and Johansen, T. (2013). The LIR motif - crucial for selective autophagy. J. Cell Sci. 126, 3237–3247.
Bobrie, A., Colombo, M., Krumeich, S., Raposo, G., and The´ry, C. (2012). Diverse subpopulations of vesicles secreted by different intracellular mecha-nisms are present in exosome preparations obtained by differential ultracentri-fugation. J. Extracell. Vesicles 1, 10.3402/jev.v1i0.18397.
Boya, P., Reggiori, F., and Codogno, P. (2013). Emerging regulation and func-tions of autophagy. Nat. Cell Biol. 15, 713–720.
Bradke, F., and Dotti, C.G. (2000). Differentiated neurons retain the capacity to generate axons from dendrites. Curr. Biol. 10, 1467–1470.