A. MULTIPATH TRANSMISSION
Prof. L. B. Arguimbau E. E. Manna
E. J. Baghdady C. K. H. Tsao
The group has been completing work on the transatlantic receiver mentioned in pre-vious Quarterly Progress Reports. Much of the work has to do with diversity features.
In addition, several new projects have been started by part-time staff members. These include studies of the theory of ratio-detection operations, noise problems in television sound, gated beam limiters, and the influence of limiter bandwidth on receiver per-formance.
B. STATISTICAL THEORY OF COMMUNICATION Prof. J. B. Wiesner Prof. W. B. Davenport, Jr. Prof. R. M. Fano Prof. Y. W. Lee Prof. J. F. Reintjes R. W. Aboudi C. A. Desoer P. E. Green, Jr. A. J. Lephakis R. M. Lerner F. A. Muller I. Uygur
1. Amplitude Distorted Signals
Two signals f(t) and g(t), having amplitudes x and y which were assumed to be sta-tionary time series with gaussian distributions, have been considered by J. J. Bussgang (Crosscorrelation Functions of Amplitude-Distorted Gaussian Signals, Technical Report No. 216, Research Laboratory of Electronics, M.I.T. March 1952). Let one of these signals, say, g(t), be distorted by any single-valued, Lebesgue measurable amplitude mapping V(y) to give G(t). If fg(T) is the crosscorrelation function of f and g, and
fG(T) of f and G, then Bussgang's principal result is that, for the gaussian case,
tfG(T) = k(V)fg(7), where k is dependent only on V. In the following paragraphs we
shall generalize this theorem to a far wider class of amplitude distributions. Since the time series is stationary, it is well known that
00 00 (Pfg(T)
oo
o
-00 -00 00 00 fG(T) f -00 -00xyp(x, y; T) dx dy
xV(y) p(x, y; T)dx dy
where p(x, y; T) is the joint probability density of x and y for signals displaced an amount T in time. Define
00
(y, 7) = -0co
xp(x, y; T) dx
and assume that t(y, T) is measurable in y.
Theorem 1: If 1I(y, T) =
cfg(T)
0(y), where0(y)
is a function of y alone, thenfG(T) = k(V) 4fg(T), where
00 k(V) =
-00o
V(y) 0(y) dy.
As a partial converse, suppose that cfG(T) = k(V) Pfg(T) for all measurable single-valued mappings V(y), that (y, T) is continuous in y,
(y, ) = fg(T)
(y).
Proof: If q(y, T) = cfg(7) 0(y), then
00
fG(T) = V(y)
00
=fg(T) f
= k(V)
Pfg(T).
and that for all T, fg(T)
/
0, thenq(y, T) dy V(y) O(y) dy
Conversely, if
fG(T) = k(V) cfg(T) =00
f-co
V(y) q(y, T) dy
fg(T) / 0 k(V) = - 00 V(y) 0(y, T) dySince
t
k depen(y,
)on
V
(y,it follows
T)/g().Since k depends on V, it follows that for any T1, T2
00
-00
- 0(y, T2)] dy = 0.
Define S as the set of y values such that 0(y, T1) -
O(y,
T2)> 0 and S as the complement of S. Choose V(y) as the functionV'(y) = 1 if yeS
= -1 if yES
which is measurable since (y,
T)is continuous in y.
So, andthen
where
V'(y) [0(y, T1) - 0(y, T2)] dy =f [O(y, 1) - 0(y,T
S
oo S- 00dy
-I0(y,
T1) - 0(y, T2)J dy.If we suppose that for some y,
I
0(y,1
) - 0(y, T2)1(y, T) is continuous in y
00
> 0, then since
I
0(y,
1
)-
0(y,
T)I dy
>
0
which is a contradiction. Thus, O(y,
71)
=0(y,
T2), but71
and72
were arbitrary, so E(y, T) =0(y)
and'(y,
T) =4fg(T) 0(y)
as asserted.Theorem 2: If the joint probability density of x and y is given by
p(x, y;) = a(y, T)P (a(y, ) [x - p(T) P(y)]} Q(y) where a(y, T) is any finite-valued positive function of y and T, p(T) is function of T alone, p(y) is any finite-valued measurable function of y and Q(z) are arbitrary probability densities with 0 mean, then
any finite-valued
alone, and P(z)
fg(T) = cp(T)and
fG(T) = k(V) fg(T)where c is a constant
Proof: First, p(x, y; T) is a probability density since p(x, y; T)
0
and 00p(x, y; T)
dx dy
= -00a(y, T) Q(y) P(z) (y,
T
dy00
-00o
Q(y) dy f
P(z) dz
*We say a function f(x) is finite-valued if for any x, -oo
<
x < o00, -oo
<
f(x) < oo
A bounded function is finite-valued, but not conversely as, for example, f(x) = x shows.
00
-00
[0(y, T1) - 0(y, T2)] dy
00 00
where we have substituted z = a(y,
T)
[x
- p(T)P(y)],
which is legitimate since we haveassumed a,p, and p to be finite-valued.
Now,
cp(y,
7)
= xp(x, y; T) dx -00=
C(y,
7)
Q(y)
f
xP a(y, ) x -P (T) P(y)]
dx
0oo= a(y, T) Q() (yT) + P() P(y P(z) a(y, T)
-00 00 00 Q
zP(z) dz
+ P(T)p(y) Q(y)
P(z) dz
Sy, -00 00p(T) p(y) Q(y)
since P(z) is a density with 0 mean. But
00
(fg(T) =
1oo
yp(rT) P(y) Q(y) dy= p (T)
since P(y) is a measurable function.
Thus, we have shown
qJ(y, T)= fg(T) 0(y)
where
O(y) - (Y) Q(Y)
which by Theorem 1 implies
fG(T) = k(V)
fg(T).
It is immediately obvious that the second theorem is a generalization of Bussgang's
result, and a very considerable one, since P and
Q
are arbitrary probability densities.
While the particular form for p(x, y; T) assumed in Theorem 2 has been shown
to be a sufficient condition to ensure
fG(T) =k(V) 4fg(T), it seems unlikely that it will
also be a necessary condition; surely there are pathological density distributions with
this property.
mapping U(x) to give the signal F(t) and, as before, g(t) goes into G(t) under V(y). Using a proof similar to that of Theorem 1, one can show
Theorem 3: If p(x, y; T) = p(x, y), then
cFG(T)
= k(U, V) fg(T) and Pfg(T) = a constant. Conversely, suppose that FG(T) = k(U, V) fg(T) for all measurable single-valued mappings U(x) and V(y), that p(x, y; T) is continuous in x and y, and that fg(T) / 0, then p(x, y; T) = p(x, y).R. D. Luce
2. Vocoder
In making a time-dependent analysis of a speech signal, two factors are essential: (a) a means of obtaining the pitch period in order to set the time scale and (b) a means of storing speech signals so that the appropriate analysis may be made.
A means for obtaining the pitch period has been devised, but its critical tests must await the completion of the memory unit.
We are constructing an analog memory unit based on the Williams storage principle, using the charge distributions on the face of a cathode ray tube after the beam has been removed from an area in question.
A series of special effects amplifiers has been built, including clippers, integrator, differentiator, and envelope gain control, to provide for greater flexibility in testing.
R. M. Lerner
3. The Effect of Slope Quantization in Picture Transmission
Our problem is to determine the number of levels required to quantize the derivative of a signal from a facsimile-machine transmitter with the following considerations in mind: (a) The resultant picture obtained after integration of the quantized derivative should be of acceptable quality. (b) It is desired that the bandwidth required for the transmission of the slopes (that is, quantized derivative) should be as small as possible.
Amplitude quantization has been previously investigated. The work done by E. H. Gibbons and L. H. Goodal (1, 2) indicated that the jumps introduced by amplitude quantization cause appreciable picture degradation when the number of levels is smaller than approximately 32 to 64 levels or 5 to 6 digits on a binary code basis (see Fig. VIII- 1).
This degradation is attributed to the great sensitivity of the eye in detecting sudden changes in light intensity. Quantization of the slope of the signal instead of the ampli-tude appears to be advantageous. This kind of approximation to the original signal results in sudden changes in slope to which the eye does not appear to be particularly
sensitive (see Fig. VIII-2).
The eye can tolerate a considerable error in slope and also a considerable error in light intensity as long as this latter error is not introduced in the form of sudden jumps.
Fig. VIII-1 Fig. VIII-2 (a) Smooth original signal. (b) Signal quantized Slope quantization.
with distinct jumps between levels.
Hence, the number of levels necessary in slope quantization should be smaller than that required in amplitude quantization.
The problem considered here may be a step toward bandwidth reduction for picture transmission for the following reason: In addition to obtaining a smaller quantizing number of levels, one may expect to find appreciable correlation between slope levels and their duration. If this were actually the case, a coding method may be found (for transmitting the slope and its duration) which will require considerably less bandwidth than that necessary in ordinary transmission. This correlation between a slope level and its duration has not been investigated up to the present.
Construction of equipment is now in progress.
R. W. Aboudi, R. M. Fano References
1. E. H. Gibbons: The Transmission of Picture Signals by Pulse-Code, Master's Thesis, Department of Electrical Engineering, M.I.T. 1950
2. L. H. Goodal: Television by Pulse Code Modulation, Bell System Tech. J. 30, 33-49, 1951
4. Communication in the Presence of Additive Gaussian Noise
The theory of communication in the presence of additive gaussian noise with arbi-trary power spectrum has been the subject of further studies. This problem leads to the determination of a set of eigenfunctions and eigenvalues that depend on the power
spectrum of the noise and on the length of the signal. In computing the a posteriori probabilities of the possible transmitted signals, the essential step is a crosscorrelation of the received signal with a suitable function. This function can be determined from the set of eigenfunctions and eigenvalues.
This theory is of interest when additive gaussian noise is the most important dis-turbance, particularly in connection with the problem of communication through a channel whose frequency band is not sharply limited, and with the problem of performing physical measurements. This work will be presented in a forthcoming technical report.
C. HUMAN COMMUNICATION SYSTEMS
Dr. L. S. Christie J. Macy, Jr. L. M. deLeeuw
Dr. R. D. Luce S. C. Bedard L. N. Lindgren
Dr. G. O. Rogge K. Ralston
1. Experiment on Network Change
This experiment has been discussed previously (1, 2, 3). During the last quarter the reduction of message card data to a form suitable for IBM processing was concluded. The IBM processing continues.
L. S. Christie, R. D. Luce, J. Macy, Jr.
2. An Experimental Study of Semantic Confusion
In a previous report (1) we described the initial design work for an experiment on groups in which semantic confusion occurs. Work on the design continued throughout the quarter. A series of pilot studies was conducted in which it was found that, as we obtained a high level of semantic confusion using as stimuli available standard colors, we simultaneously ran into serious discrimination difficulties on the part of the sub-jects. Thus, some change in the design was required. There were two possible solu-tions: different stimuli or more stimuli. From a statistical point of view, the latter is an undesirable solution. We have elected to use as stimuli three photographs of the same person with slightly different facial expressions. Since there is a rather natural tendency for people to describe expressions in broad terms designating moods, and since there are few easily isolated differences (such as eyes open and closed) in the photographs we have tested, we expect a reasonable amount of semantic confusion.
The problem the subjects are required to complete is a series of tasks (time limited to 10 minutes) in which each subject is to discover, from messages sent him, the vari-ous orders (left, middle, right) in which the photographs are presented to each of the other subjects. At the end of each trial the experimenter feeds back to the subjects the total number of errors made on the trial. The experiment is terminated either when
two successive trials have been completed with no errors or when 13 trials have been completed.
Two sets of questionnaires are to be administered. The first one precedes the experimental run and is discussed in section 3. The second one, about the experiment itself, follows the run and is substantially the same as the one used with the network change experiment (1, 2, 3).
Arrangements have been completed with the Reception Center, Fort Devens, to conduct the experimental program at Fort Devens.
3.
Pre-Task Questionnaire
A questionnaire has been developed to measure some aspects of the attitudes
under-lying the subject' s behavior in and reactions to groups.
The extensive pilot
investi-gations reported in section 2 provided an unusual opportunity for preliminary work on
construction of the questionnaire.
Individual depth interviews inquiring into the subject' s
reactions to working in a group and into his general feelings toward groups were
con-ducted with 55 Navy subjects used in the pilot experiments. Analysis of these interviews
suggested at least three factors affecting behavior in task-oriented groups, namely:
(1) a Sociablility factor with, at the high extreme, the gregarious individual who prefers
to work and spend his leisure time with other people; (2) an Active-Passive factor
char-acterized at one extreme by the dominant individual who takes the initiative in
manipu-lating his environment; and (3) a Cooperative-Competitive factor with, at the cooperative
extreme, the individual who views the world as friendly and inclined to be helpful toward
him.
The interviews provided a fruitful source of questionnaire items to measure these
factors, and two types were constructed: (1) statements of various attitudes with which
the subject indicates his agreement or disagreement; (2) sentence completion and fill-in
items to which the subject responds by writing how he would handle specified situations.
In the first type, which is more frequently used because of greater objectivity and ease
of scoring, the subject evaluates his own attitudes. In the second type, however,
behavior elicited from the subject is evaluated by the experimenter as to its attitudinal
significance.
From a preliminary group of 45 Agree-Disagree items and 9 items of the second
type tried out on 30 pilot subjects, 33 of the former and 7 of the latter were selected for
their low ambiguity and their relative unidimensionality. This questionnaire was then
pre-tested on 100 new recruits at Fort Devens, a sample of the population from which
subjects for the experiment will be drawn.
The method of administration, the
instruc-tions, and the language level of the questionnaire proved quite satisfactory.
A factor analysis of responses to the Agree-Disagree items yielded five factors.
Factors II and III correspond respectively to the Active-Passive and
Cooperative-Competitive attitudes described above.
Factors I and IV are both involved in the
delimi-tation of Sociability, with Factor I the gregarious component and Factor IV the degree of
emotional independence of the group component.
Factor V, tentatively named General
Security-Insecurity, seemed to be a more basic personality dimension and is therefore
not of interest at the present time. All items which measured only Factor V and several
items which did not contribute appreciably to any one of the other factors have been
deleted from the final form of the questionnaire. With the factor analysis results as a
guide, several new items have been designed to measure Factors I through IV more
extensively.
Scoring categories were developed for each of the fill-in and sentence completion items, varying from 3 to 10 categories per item. Using these categories, the average level of pairwise agreement among four independent judges ranged from 92 to 99 percent. Correlations of the scores thus derived with the factor scores for each subject indicate that responses to items of the second type provide additional measures of Factors I, II, and III.
The questionnaire will be administered to all subjects in the forthcoming experiment. It is hoped that behavior in the experiment, for example, productivity in terms of number of messages as well as initiative in devising a code solution to the problem, can be more adequately understood by taking into account the attitudinal factors measured by the questionnaire.
L. S. Christie, G. O. Rogge
4. Second Whirlwind Problem
After a considerable delay, work has been resumed on a problem which has been previously described (4). The coding of the problem was completed during the quarter. The testing of the code and the actual running of Monte Carlo cases are planned for the coming months.
R. D. Luce, K. Ralston
5. Abstract Networks
Some attention has been given to the problem of disconnecting networks by the removal of nodes and links. These are of interest for the former deals with the number of terminal points which may be inoperative before a message cannot pass from one node to another, and the latter indicates how many channels or links can be destroyed before a message is blocked. In reference 4 we define the degree of a network to be the small-est number of links which may be removed from a connected network to disconnect it. Similarly, we define the index of a network to be the smallest number of nodes which may be removed from a connected network (along with the incident links) to disconnect it. A result of graph theory known as Menger' s theorem can be readily generalized to networks and is pertinent to this problem: If a connected network has index > 2, then from any node a to any other node b there are at least two chains which have no nodes in common. This suggests that it may be possible to show that if a connected network has degree >2, then from any node a to any other node b there are at least two chains which have no links in common. This is true and is shown in much the same fashion as Menger' s theorem; however, it is a special case of the following more general and more difficult result.
Theorem: If a connected network has degree k, then from any node a to any other node b there is a set of at least k chains such that no two have a link in common.
This, in turn, suggests a generalization to Menger' s theorem: If a connected net-work has index K, then from any node a to any other node b there is a set of at least
K chains such that no two have a common node. This statement has not been proved and appears to be quite difficult to show. No simple modification of the proof to the above theorem will suffice to show it, for that proof deals with a set of k chains which are chosen to have a common node.
R. D. Luce
References
1. Quarterly Progress Report, Research Laboratory of Electronics, M.I.T. Jan. 15, 1953, pp. 32-34
2. Quarterly Progress Report, Research Laboratory of Electronics, M. I. T. April 15, 1952, pp. 62-64
3. Quarterly Progress Report., Research Laboratory of Electronics, M. I. T. Jan. 15, 1952, pp. 56-58
4. Quarterly Progress Report, Research Laboratory of Electronics, M.I.T. July 15, 1952, pp. 71-77
D. REPLACEMENT OF VISUAL SENSE IN TASK OF OBSTACLE AVOIDANCE
Dr. C. M. Witcher L. Washington, Jr.
The model of the step-down detector described in the Quarterly Progress Report, January 15, 1953, was found to be satisfactory for the detection of step-downs of depths of 2 inches or more under conditions where factors giving rise to false alarms were not present. This conclusion applies both to speed and reliability of detection. The model was examined by E. J. Waterhouse, director of the Perkins Institution for the Blind, and he concurred with this conclusion. However, it very soon became equally apparent that the model as it then existed could still not be regarded as a usable instrument. The source of difficulty now lay in the fact that the number of false alarms occurring under nonideal conditions was intolerably high. As pointed out several times, a detection system operating on the principle which we have utilized must necessarily give an alarm whenever the received signal intensity drops below a certain predetermined level. This happened in the case of the present model whenever ice, wet snow, or puddles were scanned. Fortunately, the false alarms were emphasized by the winter weather condi-tions under which recent tests have been taking place. Thus it appears that any really workable solution to the step-down detection problem must be one in which these sources of false alarms are definitely eliminated.
Several schemes for doing this have been considered. Actually, there appears to be only one possibility available at our present stage of thinking. It is well known that in practically all cases the reflection from ice, water, and other smooth surfaces is not completely specular. There will, in general, be such factors as dirt, irregularities of surface, and other reflecting particles which will give rise to a small amount of scat-tering. In fact, preliminary measurements have now indicated that an improvement of 10 to 20 db in the signal-to-noise ratio of the present detection system will probably eliminate most of the false alarms due to specularity. Assuming that this improvement can be achieved, two further provisions appear necessary: (1) Some form of limiter circuit must be included in the amplifier to prevent overloading and thereby facilitate the fast operation of the grid bias circuit in the alarm unit. (2) Probably an auxiliary monitoring photo cell with its lens near the transmitting light source (hence insensitive to step-downs) should be used to further control the gain of the amplifier as a function of terrain reflectivity. This latter provision is necessary to insure a definite signal dip at a step-down.
By way of laying the ground work for the signal-to-noise ratio improvement problem, we now summarize the results of our recent measurements of the performance of the various system components. The amplifier in use at present is peaked at about 400 cps with a usable gain (without excessive noise voltage) of 100 db at that frequency. It is
down 6 db at 225 and 550 cps and down 12 db at approximately 150 and 1450 cps.
The
rectified output noise voltage at the grid of the Raytheon type CK5672 tube in the alarm
circuit for the 100-db gain setting of the amplifier is 2. 5 to 3. 0 volts, and the bias
voltage on this grid which will permit the alarm relay to operate is 6. O0
volts.
Thus,
in order for the alarm to fire, the signal-to-noise ratio has to dip below 6 db.
From an
average reflecting surface the signal-to-noise ratio is 12 to 18 db, and the amplifier is
still linear in this range.
The nearly complete extinction of the signal, caused by
step-downs of 2 inches or more, allows the alarm to function adequately in this range.
The light pulses actually "seen" by the receiver photo cell are quite complex
func-tions of time, depending partly on the distribution of the light from the transmitting
source and partly on the point-to-point variations in reflectivity of the particular region
of terrain which the device is "seeing." This function must, of course, have the same
fundamental frequency as the vibration frequency of the source (now 36 cps), and it will,
in general, be very rich in harmonics.
However, in the region of maximum sensivity
of the amplifier, recent measurements show that the harmonic energy content is
consid-erably below the original estimate.
Figure VIII-3 shows a curve,of the relative harmonic
intensities up to a frequency of 504 cps as indicated by a General Radio type 760-A sound
analyzer.
For these measurements the vibrator for the light source was operated from
an audio oscillator in order to eliminate any possible pick-up from its make-and-break
contacts, and the receiver photo cell was connected to the sound analyzer through a
high-fidelity amplifier.
It is quite apparent from these measurements that some 8- to
0 -0 CL w o
-J
o -20 Z_ 0 a g -30 -1 f II
I I I I I I I I I I I 0 60 120 180 240 300 360 420 480 FREQUENCY(GPS)Fig. VIII-3
12-db improvement in signal-to-noise ratio could be obtained either by increasing the fundamental signal frequency to the neighborhood of 400 cps or redesigning the amplifier to peak at a much lower frequency.
A flashlight bulb and small reflector which constitute the light source are not at all satisfactory from an optical standpoint. Ideally, the light spot produced on the terrain from the source should be of the same size and shape as the area "seen" by the receiving lens when the two are superimposed. This is far from the case because the light is much too divergent. Since the reflector size cannot be conveniently increased, the only way to obtain better light concentration is to obtain a bulb with smaller filament dimensions or some other smaller form of light source such as an arc. The amount of power assignable to the light source should definitely not be increased beyond its present value (about 0. 6 watt), and it would be highly desirable to decrease it. The light source problem is now receiving very careful attention.
Finally, the sensitivity and signal-to-noise ratio of the PbS photo cell used in the receiver have been re-examined. The signal-to-noise is of the order of 30 db with the amplifier bandwidth stated above, which is essentially adequate. The sensitivity of the cell with a supply voltage of 160 volts is 5000 volts per lumen. This is below that obtainable with the more recent types of germanium junction photo-diodes, such as the Bell Telephone Laboratories type 1740, but the noise voltage of these devices is far higher than that for the PbS cell. It is therefore felt that the chief efforts toward signal-to-noise ratio improvement for the system must, for the present, be exerted in the directions of better light source optics and better matching of amplifier response to
E. NEUROPHYSIOLOGY*
B. Howland W. H. Pitts
W. S. McCulloch J. Y. Lettvin
In the past few months, we have been making a survey of the physicochemical and electrical properties of microelectrodes of various kinds under the conditions of physiological recording. These conditions are rather different from the ones usually considered in chemical literature, where one uses highly purified solutions of simple electrolytes, not living tissue full of redox systems, surface-active agents, catalysts, and poisons thereof. Our results, with recommendations to the electrophysiologist, will appear soon in a technical report, but we shall summarize a few of them here.
Like many others, we have found that the surface impedance of electrodes, as a function of the frequency
0,
is asymptotic to an inverse fractional power of w, Z(w) - Aw- a, at least to the upper limit of our measurements. Warburg showed that if the diffusion of ions from the bulk of the electrolyte to the electrode were the factor limiting the current, the impedance should vary asymptotically as w 1/2, as is obvious offhand by virtue of the diffusion equation's being of the parabolic type. Elaborations of this mechanism yield different functions of frequency, with the same asymptotic behavior. Placing linearized chemical reactions (or energy barriers) in series with the diffusion process can yield an asymptotic dependence of the form A i N ,N an integer, but not of any other kind.
It is often remarked informally that any limiting value of the exponent a from zero to one is sometimes to be found; if true, this would make impossible any kind of theory now proposed that depends on a set of linearized differential equations, the variations of whose parameters explain the differences between electrodes and solutions; for no such system can vary the asymptotic a continuously by continuous variation of the parameters in the equations. But in the somewhat limited class of cases we have con-sidered, the limiting exponents cluster closely around the values a = -1/4, a = -1/2, and a = -3/4. Some of them are as follows:
I. Z(w) , const X w-1/4 This is true for:
a. Ag AgCl in 0. 9 percent (physiological, 0. 0155M) NaCl with just enough anodic current to balance the loss of AgCl by diffusion from the microelectrode. The relation is valid from approximately 14 cps to 50 kc/sec. It also holds for
b. Ag JAgCl in 0. 9 percent NaCl + gelatin.
The work reported in this section has been supported in part by the Bell Telephone Laboratories, Incorporated, and by a separate contract with the Office of Naval Research.
II. Z(w) N const X w-1/2 This holds for:
a. bright Pt and Pt-Rh alloy in 0. 9 percent NaC1, from 20 cps to 40 kc/sec; and for
b.
Au
30
kc/sec.
III.
Than
("polarized" by large dc pulses) in the same solution, from 300 cps to (Au is then 40 my positive to the AgjAgCl reference electrode.)
Z(w) - const x
w-3/4
is relation describes:a. bright Ag in 0. 9 percent NaCl, 300 cps to 40 kc/sec;
b. the same electrode in AgNO3; -72
c. Au ("unpolarized") in NaCl, 300 cps to 40 kc/sec during 0. 5 x 10- amp/cm of )dic direct current, which makes the electrode the same potential as the AgjAgCl
reference;
d.
Au in human cerebro-spinal fluid, over the same range;
e.
Pt in cerebro-spinal fluid, from 10 cps to 40 kc/sec;
f.
Nichrome in 0. 9 percent NaCl, from 100 cps to 40 kc/sec.
These results suggest a few interesting possibilities for further investigation. First
of all, the limiting exponent can change sharply with small changes in the solution: Pt
in NaCl gives a
=
1/2; in cerebro-spinal fluid it gives a
=
3/4.
We have a little evidence
that varying the dc bias current may change the exponent suddenly at certain points
on the polarogram, but we cannot be certain of this yet.
If one picks a fixed frequency
and for various direct currents through the electrode measures the impedance, it can
change by a factor of at least two and has a minimum at certain points on the
polaro-gram.
(This is obvious, a priori, for the dc resistance, which is the reciprocal slope
of the polarogram, but not at all for the ac impedance.
We do not know whether the two
quantities vary together. )
We have also made measurements of the noise generated by the electrode surface
in relation to its impedance.
This noise is equal, at least f-rom 20 cps to 50 kc/sec, to
that generated in a resistance equal to the real part of the impedance of the electrode,
i. e. there is no flicker noise.
At 37°C this means that the mean-square noise voltage,
-8in square microvolts, is 1.711 x 10⁻⁸ R
X Aif R is the real component of the
imped-ance in ohms at the mean frequency and
Awis the bandwidth.
So far, we have found no solid electrode as good as Ag AgCl.
We do not know about
Pt black as yet. All the metallic electrodes we have tested are far worse than we had
supposed, but still probably better than pipettes. The distortion they produce can be
corrected electronically, but not, in view of the asymptotic frequency dependence, by a
simple network, and not at all without raising the noise level. All these difficulties are
inversely proportional to the square of the diameter of the tip of the electrode.
F. SPEECH ANALYSIS
Prof. M. Halle Carol D. Schatz
G. W. Hughes C. P. Smith
1. Analysis of Envelope Features
As stated in "Preliminaries to Speech Analysis" (M. I. T. Acoustics Laboratory Technical Report No. 13, May 1952), the phonemes of speech may be broken down into inherent distinctive features which are the ultimate discrete signals. One of these dis-tinctive features which deals principally with the envelope of the sound has been termed interrupted vs continuant. Work is now in progress to determine a suitable measure-ment scheme which will identify this feature without fail. This feature appears as the principal distinction between the class of consonantal sounds called stops and those termed fricatives. Studies have been made of these sounds as they exist in English and Russian.
Listed below are the stops and fricatives of English being studied.
Unvoiced Voiced
Interrupted Continuant Interrupted Continuant
p (pill) f (fill) b (bill) v (veal)
t (till) s (sill) d (dill) z (zeal)
k (kill) g (gall)
tS (chill)
S
(shell) d3 (Jew) 3 (leige)A list of monosyllables containing one or more of these sounds is recorded onto continuous loops of tape to provide for repeated observation of the sound to be studied. A sharp trigger must then be recorded preceding the sound on the loop to synchronize the oscilloscope or any gating apparatus used.
Since the waveforms of the sounds of interest in this study are random and pulse-like in nature, the envelope of the waveform rather than its instantaneous value is con-sidered. This presentation is accomplished as follows: (1) the sound is full-wave recti-fied; (2) the rectified output is smoothed in an RC network; (3) results are displayed on a long-persistence, slow-sweep-speed oscilloscope. A smoothing time constant of 40 msec has been the most satisfactory so far.
The work reported in this section was also supported in part by the Carnegie Foundation and the Rockefeller Foundation.
Several criteria for definitive measurement of the continuant distinction vs the interrupted distinction have been investigated. This measurement must, of course, be related to the difference in onset times. Numbers calculated from data to be proportional to the rise time of the waveform itself, its envelope, or the integral of the waveform failed to distinguish adequately the borderline cases of [S] , and [s], or [z].
In all measurement criteria evaluated there was little difficulty in distinguishing the rapid onset feature of the voiceless consonants. Difficulties became apparent in the case of the voiced consonants.
The sounds on the right side of the table consist, in general, of the corresponding sound on the left side plus a large periodic or voicing component. Highpass filtering beginning at a frequency of 1600 cps has been found to be fairly successful in removing this voicing. However, further study is needed to separate more adequately the true stop or fricative component from the masking of the periodic component.
On the basis of still incomplete measurements the following procedure has been adopted:
1. The sound is passed through a highpass filter, rectified and smoothed, and then displayed on an oscilloscope.
2. The time at which the wave first reaches 20 percent of its ultimate peak value is noted. (a) If in a segment of 150 msec preceding this point there is a silence which in turn is preceded by sound, the sound in question is interrupted. (b) If there is no silence in this period, the sound in question is continuant. (c) If no sound precedes the silence, we proceed to part 3.
3. The time at which the wave shape reaches its maximum is identified. The maxi-mum value in volts is recorded, together with voltages occurring at 15 msec intervals preceding this peak up to and including 105 msec before the peak. We then calculate N according to the following formula:
N =
(V
1 +2V
2 + 3V 3 + 4V4 + 5V 5 + 6V6 + 7V 7) 10where p is the peak value of waveform in volts, and Vn is the value preceding peak by 15n msec. (a) If N is under 20, the sound in question is interrupted. (b) If N is above 65, the sound is continuant. (c) If N lies between 20 and 65, we proceed to part 4.
4. We measure the number of milliseconds the envelope of the waveform remains
above 75 percent of the peak.
A time constant of integration of 40 msec is used. (a) If
this time is less than 40 msec, the sound is interrupted; if more, it is continuant.By applying these criteria we have been able to distinguish correctly the consonants
in about 300 syllables spoken by two males and one female. The number of failures is less than 5 percent of the total material.2. Frequency Analysis
In order to obtain detailed information about the stop consonants, a technique was evolved for measuring the spectral distribution of any small time-segment of the speech signal in terms of the average amplitude in the 32 filter bands of the speech analyzer (cf. Quarterly Progress Report, Research Laboratory of Electronics, M. I. T., October
15, 1952). The special problems presented were those of selecting the segment of the syllable accurately and providing a means of measuring the average amplitude of the rectified speech wave in the segment.
The utterances that have been the subject of the study were recorded on loops of magnetic tape. To provide a synchronizing signal for the long-persistence oscillographic display, a tone burst was recorded onto the tape immediately preceding the beginning of the utterance. We constructed, using a high-speed relay switch, time delay and switching circuits which make it possible to select a small segment of the utterance for measurement. In order to measure the average amplitude of the rectified segment of the speech signal so selected, a balanced, low-drift RC integrator was built. This inte-grator contains polystyrene-dielectric capacitors to minimize leakage and soakage effects.
The segment of the speech signal for which the spectrum is to be determined is selected by observing the pattern of the rectified speech signal on the long-persistence cathode ray tube, and listening to the gated signal. The vowel and consonant portions of the signal are readily identified in terms of their characteristic patterns, even to the
separation of the burst and the frictional modulation of the stop consonants. After adjusting the timing circuits in order to suppress all but that segment of the sound which is to be measured, each filter band is switched on in turn and a calibrated attenuator is used to adjust the level of the speech signal to a standard reference amplitude, as
measured in the RC integrator. The attenuator readings, then, provide a measure of the relative distribution of amplitudes in the various filter bands.
*15 +10 +5 0 -5 -JO I I I 350 1000 2000 3000 4000 FREQUENCY
Fig. VIII-4
Average and peak deviations for the stop /k/ in 12 different utterances of the syllable /ku/.
Is S10 5 350 1000 2000 3000 4000 FREQUENCY 20 SPEAKER J /po/ 15 -5 350 1000 2000 3000 4000 FREQUENCY 10 SO 350 1000 2000 3000 4000 FREQUENCY 20 15 10 5 350 1000 2000 3000 4000 FREQUENCY 2 o1 0 5 0 5 0 20 15 T 10 5 0 350 1000 2000 3000 4000 FREQUENCY 20 15 10 5 350 1000 2000 3000 4000 FREQUENCY 350 1000 2000 3000 4000 FREQUENCY 20 15 S10 5 n 350 1000 2000 3000 4000 FREQUENCY 5 20 15 10 5 iO 350 1000 2000 3000 4000 FREQUENCY 350 1000 2000 3000 4000 FREQUENCY WHITE NOISE .5 0 -10 _IR 350 1000 2000 3000 4000 FREQUENCY
Fig. VIII-5
The spectra for /b/ and /p/ have a generally falling slope;
the spectra for /d/ and /t/ have a rising slope.
J 2
In order to assess the variability of speech sounds measured in this manner, a com-parison was made of 12 utterances of the syllable [ku] by a single speaker of American English. The burst and frictional modulation portions of the stop consonant [k] were measured for each of the 12 utterances, and the average distribution for the 12 utter-ances is plotted in Fig. VIII-4, as well as the peak deviations from this average.
The Russian hard /t/, /p/, /d/, and /b/ in all possible combinations with all the vowels were recorded on tape by two native male speakers. The syllables were then subjected to measurement according to the outlined procedure. Some of the spectra so obtained are given in Fig. VIII-5. It can be seen that /t/ and /d/ have more intensity in the upper frequencies, whereas /b/ and /p/ are stronger in the lower frequencies. Clearly marked maxima appear in some of the consonants; however, these maxima apparently do not correspond to the formants of the adjacent vowel.
G. TRANSIENT PROBLEMS
Prof. E. A. Guillemin Dr. F. M. Reza E. F. Bolinder Dr. M. V. Cerrillo F. Ba Hli R. A. Pucel
1. Use of the Derivative in Electrical Network Problems
Two objectives are pursued in this and the following Quarterly Progress Report. One is an immediate objective, and the other a long-range one. The aim of the present report is to demonstrate that
If P(s)/Q(s) represents the driving-point impedance of a one terminal-pair lossless network (or a two-element type of
net-work), then
dnP(s)/dsn dnQ(s)/dsn
will also represent a one terminal-pair lossless network (or a two-element type of network).
The long-range interest arising from this approach is based on the fact that the notion of differentiation of a polynomial has rarely been used in network problems. It will be brought out in the subsequent discussion that a study of the critical points of the polynomials and rational fractions will expand the present state of network theory and may also clarify some of its existing problems. The term "critical point" in this report is used for the location of zeros of the derivative of a polynomial; this is in con-formity with the practice of such mathematical works as those of J. L. Walsh and M. Marden (1, 2). The reader is reminded not to confuse "critical point" with the more familiar network term "critical frequencies, " which is used to denote the zeros and poles of an impedance function.
As a first step in this long-range direction, the powerful theorem of Lucas (3) is brought within the realm of network theory and is employed to prove the specific theorem stated above. In the next report, as another example of this trend of thought, a gener-alized formula will be presented in the form of the combination with their derivatives of polynomials having real roots. This latter formula may prove to be of considerable use to those interested in either Guillemin's or Weinberg's (4, 5) RC synthesis procedures.
Part I
Consider a field of force, created by placing unit masses at the points Mk which are the location of the roots of a polynomial f(s) = (s-sl)(S-S2). . . (S-Sn) = 0 in the com-plex plane. The field is defined such that each particle repels another with a force equal to the inverse of the distance between them. At the location of a multiple root, one must
assign a number of unit masses equal to the multiplicity of the corresponding root. The force exerted by such a field on a unit mass situated at a point s = x + jy of the complex plane has, respectively, the following components in the direction of the real and imagi-nary axis: n R = (xk) 2 -k
2
(1) 1 n X =- (2) (x-xk) + (y-yk)Z 1where sk = xk + jyk denotes the location of the kth root of f(s) = 0. From these expres-sions, the following relation is immediately obtained
n n
R - jX (XXk) (3)
+x-xk
(yyk)
s-k
1 1
Recalling that the logarithmic derivative of f(s) is
n
f' 1 + 1 1 - 1
f =(s) -s+ - + 1 (4)
fs) s-s s-s2 -s n s-s k
k=l
one could see that
R - jX = f
.
(5)
It is evident, therefore, that the critical points of f(s) are the equilibrium positions in the above mentioned field of force, as well as the location of the multiple zeros of f(s). This is known as Gauss's theorem, which was established in 1816. (See ref. 1, p. 5.) Similar considerations lead Lucas to the fact that
The roots of the derivative function f'(s) = 0 lie within or on the perimeter of the smallest polygon which includes within itself, or on its boundary, all the roots of f(s) = 0.
As an application to engineering problems, consider the Gauss field corresponding to the roots of a Hurwitz polynomial P(s) = 0 (which, of course, lie in the left half-plane or on its boundary). The roots of dP(s)/ds = 0 cannot lie in the right half-plane, since the imaginary axis acts as a part of the boundary of a Lucas polygon for roots of P(s) = 0. This reveals the following useful lemma:
If P(s) is a Hurwitz polynomial, then dnP(s)/dsn is also a
Hurwitz polynomial.The essential characteristic of a Hurwitz polynomial, that is, that its roots lie in the left half-plane, remains invariant under differentiation. This fact enables one to prove the following theorems:
Theorem 1: If Z(s) = P(s)/Q(s) represents the driving-point impedance of an RL (or RC) network, then
dnp(s)/dsn d nQ(s)/dsn also represents an RC or RL driving-point impedance.
Proof: Consider a very thin ellipse in the left half-plane containing all the zeros of P(s) = 0. As a result of Lucas' theorem, one can see that all zeros of dnP(s)/dsn = 0
are also contained in the same ellipse. Nar-rowing down the ellipse to the limiting case, it becomes evident that the segment of the
nega-FREQUENCY PLANE
tive
real axis containing roots for P(s) = 0, willcontain all critical points of dnp(s)/dsn. Further-+ more, the difference between the degrees of the + +
numerator and the denominator of dnp(s)/dnQ(s) is independent of the number of differentiations.
REAL AXIS
Next one must prove that the p. r.
charac-teristic of the impedance function remains invari-ant during this operation. For this purpose one Fig. VIII-6 may consider the polynomial l(s) = P(s) + jQ(s). Example of a re ion for roots of All roots of
H(s)
= 0 are either in the second[dnP(s)/dsn] + j[dnQ(s)/dsn] = 0 or third quadrant (Fig. VIII-6).
This results from the fact that the roots of P(s) and Q(s) are alternating on the negative real axis (6).
One may draw a convex closed curve in the same quadrant around all roots of H(s) = 0. Obviously all critical points of polynomials dnjf (s)/dsn = 0 must remain inside or on the perimeter of this convex set. This fact along with the converse of the Fujiwara or Hermit theorem (6) guarantees that roots of dnp(s)/dsn and dnQ(s)/dsn must alter-nate on the negative real axis.
Theorem 2: If P(s)/Q(s) is a driving-point reactance, then dnP(s)/dnQ(s) also rep-resents a driving-point reactance.
Proof: By assumption, the polynomial H(s) = P(s) + Q(s) is a Hurwitz polynomial; therefore, its nth derivative:
dn I(s) _dnp + dnQ ds
n
dsn n
4 8/3 3/8 0I (10) 1/8 3/32 3 0 - - -- 0-(b) 1/12 2/3 2 1/2 5/4 (b) 17/6 5/3 9/17 5/2 2/3 (d) (e) Fig. VIII-7 Example of RC network
(a) Z(s) = [P(s)]/Q(s)] = (s + 4s + 3)/(s
3+ 6s
2+ 8s)
(b) Z1(s) = [P(s)]/[Q'(s)] = (Zs + 4)/(3s2 + 12s)(c)
Z
2(s)
=
11P"(s)]
/[Q"(s)
=1/(3s + 6)
(a) Z(s) =
(b) Z
1(s) =
(c)
Z(s)
=(d) Z
3(s) =
(e) Z4 (s) = Fig. VIII-8 Example of LC network [P(s)]/[Q(s)] = (s5 + 6s3 + 8s)/(s4 + 4s + 3)[P'(s)] /
Q'(s)] = (5s + 18s + 8)/(4s3 + 8s) P(s)] /IQ(s) = (5s3+ 9s)/(3s + 2) [p(s)
QI(s)]
Q]/
= (5s2 + 3)/(2s) [P(iv)(s)]/[Q ("(s)] = 5sis also a Hurwitz polynomial. Now, since dnp/dsn and dnQ/dsn are even and odd parts of a Hurwitz polynomial, then anp/dnQ must represent a driving-point reactance.
F. M. Reza
References
1. J. L. Walsh: The Location of Critical Points of Analytic and Harmonic Functions, Am. Math. Soc., New York, 1950
2. M. Marden: The Geometry of the Zeros of a Polynomial in a Complex Variable, Am. Math. Soc., New York, 1949
3. F. Lucas: Comptes Rendus de l'Acad6mie des Sciences, July 20, 1868, Jan. 26, 1874, Feb. 1874, and July 28, 1879 (see also ref. 1, pp. 6-7)
4. E. A. Guillemin: Synthesis of RC-Networks, J. Math. Phys. 28, 22-42, April 1949 5. L. Weinberg: New Synthesis Procedures for Realizing Transfer Functions of RLC
and RC Networks, Technical Report No. 201, Research Laboratory of Electronics, M. I. T. Sept. 1951
6. F. Reza: Quarterly Progress Report, Research Laboratory of Electronics, M. I. T. Oct. 1952 (this theorem and its converse were known and used by Hermit, Bichler,
H. COMMUNICATIONS BIOPHYSICS
Prof. W. A. Rosenblith Prof. Y. Katsuki
K. Putter R. M. Brown
1. The Anechoic Chamber and Associated Facilities
A study of the statistical behavior of the auditory nervous system must be based upon electrophysiological records of reliable quality. In particular, one must make sure that interfering noises and vibrations are reduced to a minimum and that only genuine responses to carefully calibrated stimuli are being used in the analysis. A comprehen-sive study of responses from the auditory nervous system will benefit from experiments on intact organisms, in which human observers respond to stimulus conditions that are identical to those in which responses from animals have been obtained.
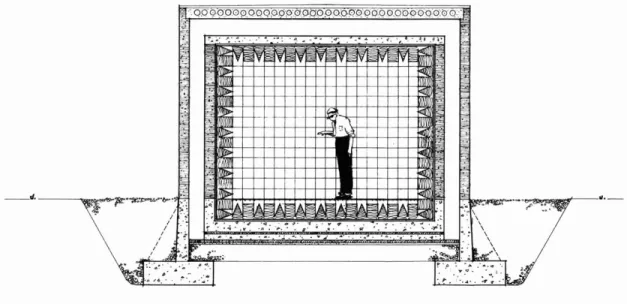
It is against the background of such considerations that the anechoic chamber and the associated facilities have been constructed. The chamber consists of a shell within a shell. Both shells have 8-inch solid concrete block walls that are separated by an air-space of 1 foot. The outer shell rests on a reinforced concrete spread footing that is continuous around its periphery. It is roofed with prefabricated, prestressed concrete forms known as "Flexicore" ; these forms are 8 inches thick and extend from wall to wall. This type of roof construction for the outer shell proved very advantageous since it would have been extremely difficult to remove the forms if poured concrete had been used.
The inner shell "floats" on a complex built-up system as shown on Fig. VIII-9. We
_ _rl. """"",~
Fig. VIII-9
found that because of soil conditions on the site and the requirement of floating the inner shell, it was undesirable to support this inner slab on footings. As a result, the entire floor slab of the inner chamber is a reinforced concrete mat with an upset beam on its periphery, forming in effect a concrete tub, structurally independent of the outer shell. On these upset beams is placed the 8-inch thick solid concrete block wall of the inner
shell with a 6-inch reinforced poured concrete slab roof bearing on the walls. The roof of the inner shell is pierced at two points with sleeves 10 inches by 20 inches for air
supply ducts. The inner floor surface consists of a subway grating in panels small enough to be removed, resting on continuous steel angles which, in turn, are supported on 1-inch rods imbedded in the concrete slab of the inner chamber.
The doors to the anechoic chamber constituted a critical problem in the design. Each of these doors is made up of 3. 5-inch built-up wooden rails and stiles with an inset panel of 0. 5-inch five-ply wood and alternate layers of plastic cement and acoustic damping
layers on both sides of the door with an air space in the center. The inner panels are floated in a continuous soft rubber frame. These doors are sealed to continuous extruded hollow rubber gaskets around the head jambs and threshold to insure an airtight seal.
The whole structure was designed to give a sound transmission loss of 65 to 70 db. The clear inside dimensions of the anechoic chamber are 8 feet 8 inches in length, 12 feet in width, and 9 feet 4 inches in height. The inside of the chamber is covered with wedges having a depth of 12 inches. These wedges are of glass fiber composition enclosed in a wire holder and are mounted on wire mesh supported on steel angle, frames in such a manner that any section may be removed if so desired. The dimensions of the
wedges make the chamber effectively anechoic above 250 cps.
The problem of electrical shielding is not yet satisfactorily solved. At present there is an open mesh hardware cloth wrapped around the outside of the inner shell and sheet copper cemented to the interior walls of the inner shell. Direct current lighting is being used in order to minimize 60 cps pick-up. The chamber is equipped with an air condi-tioning system including both temperature and humidity control.
The associated electronic equipment can be divided into three catagories: (a) stimulus-generating and programming equipment, (b) recording equipment, and (c) equipment for analysis and computation. Equipment listed under (a) permits a wide variety of acoustic stimuli to be generated and delivered to the ears of anesthetized ani-mals or human subjects. Equipment in category (b) includes two differential amplifiers having a gain of 90 db, a four-gun oscilloscope (on loan from the Harvard Psycho-Acoustic Laboratory), an Offner eight-channel EEG machine (including 2 dc channels), and an Ampex tape recorder with 2 FM channels. Equipment in category (c) includes the Imperial College of Science and Technology correlator and a microfilm reader; the time-gated amplitude quantizer is still in the developmental stage.
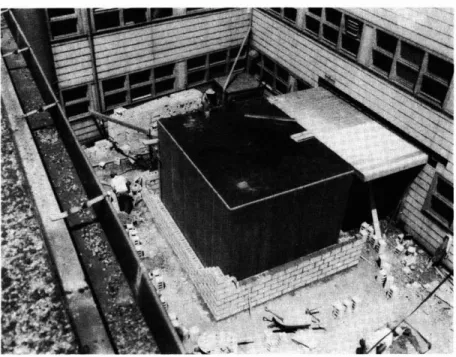
outer shell just started. Note location of whole structure with respect to wing E of building 20.
Fig. VIII-II
A corner inside the anechoic chamber. Note details of wedge construction to permit opening of door, also subway grating floor and air conditioning controls.
facility; Bernard C. Purcell, a member of the firm's staff, was responsible for the design of the chamber.
w.
A. RosenblithFig. VIn -12
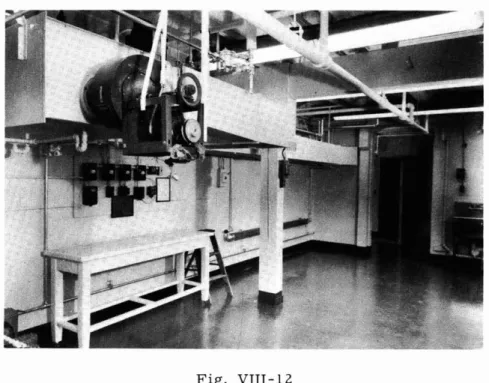
Room 20-E-003 with air conditioning unit for anechoic chamber. In the background, the chamber and its anteroom.
2. Electrophysiological Studies of the Ear of the Kangaroo Rat
The kangaroo rat (Dipodomys) has a tremendously developed bulla; when this bulla is opened, parts of the cochlea and the semicircular canals are exposed and conven-iently available for the study of both auditory and vestibular functions. Since only acoustic stimuli were available, no particular study of the vestibular system of this mammal was undertaken.
The electrical responses were recorded by means of thin wire electrodes (20 micra). These electrodes were introduced into the cochlea and into the semicircular canals. and the responses to acoustic stimuli were recorded by means of unipolar as well as differential electrodes. Since the neural responses to acoustic stimuli can be studied with relatively little interference from microphonic activity, the following experimental situations were investigated:
(l)
neural responses to clicks and tone pips; (2) masking of click responses by white noise; (3) interaction of responses to pairs of clicks;(4) neural responses to pure tones; (5) effect of exposure to strong sound upon neural responses to clicks.
The data were recorded on film. They will be analyzed, and a report will be written. Y. Katsuki, Tokyo Medical and Dental College