HAL Id: hal-01794917
https://hal.archives-ouvertes.fr/hal-01794917
Submitted on 18 May 2018HAL is a multi-disciplinary open access archive for the deposit and dissemination of sci-entific research documents, whether they are pub-lished or not. The documents may come from teaching and research institutions in France or abroad, or from public or private research centers.
L’archive ouverte pluridisciplinaire HAL, est destinée au dépôt et à la diffusion de documents scientifiques de niveau recherche, publiés ou non, émanant des établissements d’enseignement et de recherche français ou étrangers, des laboratoires publics ou privés.
Investigation on reduced thermal models for simulating
infrared images in fusion devices
J. Gerardin, M-H Aumeunier, M. Firdaouss, J-L Gardarein, Fabrice Rigollet
To cite this version:
J. Gerardin, M-H Aumeunier, M. Firdaouss, J-L Gardarein, Fabrice Rigollet. Investigation on reduced thermal models for simulating infrared images in fusion devices. 7th European Thermal-Sciences Conference, Jun 2016, Krakow, Poland. �10.1088/1742-6596/745/3/032019�. �hal-01794917�
Journal of Physics: Conference Series
PAPER • OPEN ACCESS
Investigation on reduced thermal models for
simulating infrared images in fusion devices
To cite this article: J. Gerardin et al 2016 J. Phys.: Conf. Ser. 745 032019
View the article online for updates and enhancements.
Related content
Infrared Imaging: Infantile
haemangiomas—IR thermography in assessment
F Ring, A Jung and J uber
-Infrared Imaging: Thoracic vertebral block—the technique of injecting local anaesthetic
F Ring, A Jung and J uber
-NEAR INFRARED IMAGING OF THE PROPOSED Z=2 CLUSTER BEHIND CL 0939+4713 (ABELL 851)
J. B. Hutchings and T. J. Davidge
Investigation on reduced thermal models for simulating
infrared images in fusion devices
J. Gerardin1, M-H. Aumeunier2, M.Firdaouss2, J-L Gardarein1, F.Rigollet1
1Aix-Marseille University, IUSTI UMR 7343 CNRS, Marseille, France 2CEA/IRFM, Cadarache, France
Jonathan.gerardin@univ-amu.fr
Abstract. In fusion facilities, the in-vessel wall receives high heat flux density up to 20 MW/m2. The monitoring of in-vessel components is usually ensured by infra-red (IR) thermography but with all-metallic walls, disturbance phenomenon as reflections may lead to inaccurate temperature estimates, potentially endangering machine safety. A full predictive photonic simulation is then used to assess accurately the IR measurements. This paper investigates some reduced thermal models (semi-infinite wall, thermal quadrupole) to predict the surface temperature from the particle loads on components for a given plasma scenario. The results are compared with a reference 3D Finite Element Method (Ansys Mechanical) and used as input for simulating IR images. The performances of reduced thermal models are analysed by comparing the resulting IR images.
1. Introduction
In nuclear fusion devices, the in-vessel components have to withstand high heat loads coming both from transported particles and from plasma radiations up to 20MW/m2 for the most powerful devices, as the international experimental reactor ITER. For the safe operation of the actively cooled plasma facing components (PFCs), Infra-Red (IR) thermography is a key diagnostic to measure their surface temperature in order to prevent overheating and provide relevant data for the study of the plasma-wall interaction. So far, these PFCs are in carbon with high emissivity (ε>0.8) but with the introduction of new metallic components, with low and variable emissivity (ε~0.1-0.4), the IR measurement is made more complicated because of the spurious contributions of the reflected fluxes coming from highly radiative surrounding environment. In order to anticipate the optical measurement in this fully-reflective environment, a full-predictive photonic simulation based on a Monte Carlo ray tracing code has been performed [1]. This allows assessing accurately the brightness temperature measured from classical IR thermography and by taking into account the optical properties of PFCs materials (emissivity and reflectivity) [2]. The photonic simulation uses as input a 3D temperature field that describes for a given plasma scenario the surface temperature resulting of the power flux deposits on in-vessel components. This paper deals with methods for converting heat flux density (MW/m2) into
surface temperature of each component taking into account their thermal properties, their water cooled system, etc. Regarding on the properties and number of the different components (several hundred), determining the complete surface temperature inside the device by a 3D numerical tool (in Finite Element Method) is not affordable (high CPU-time cost... etc). This paper investigates reduced models allowing faster calculation of the thermal state of the complete tokamak for a plasma scenario, while
7th European Thermal-Sciences Conference (Eurotherm2016) IOP Publishing
Journal of Physics: Conference Series 745 (2016) 032019 doi:10.1088/1742-6596/745/3/032019
Content from this work may be used under the terms of theCreative Commons Attribution 3.0 licence. Any further distribution of this work must maintain attribution to the author(s) and the title of the work, journal citation and DOI.
preserving sufficient accuracy for simulating realistic infrared images (5-10% precision on surface temperature is expected).
The first part of this paper will briefly present a description of the tokamak and the current state of modelling the heat flux density or the IR image inside WEST tokamak (Cadarache, France) still being upgraded. In a second part, different reduced models are compared to Ansys software used as a reference 3D numerical tool. The third part presents discrepancies between each model on the surface temperature and the consequences on the IR image obtained.
2. Thermal behaviour of the tokamak
2.1. Plasma configuration and Plasma Facing Components (PFCs)
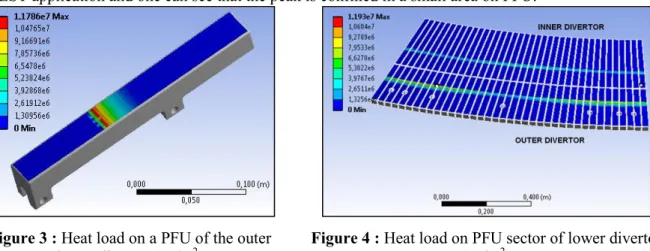
The WEST project (Tungsten (W) Environment for Steady State Tokamak) project is a major upgrade of Tore Supra tokamak to transform it into an X-point magnetic configuration machine (see figure 1) with a fully metallic environment, aiming at testing ITER technologies in relevant plasma conditions [3,4]. Figure 2 presents the different PFCs inside WEST. The antennas are high-frequency heating system, used to heat the plasma. In the first experimental campaign, the lower divertor will be composed of Plasma Facing Units (PFU) in graphite with Tungsten-coating without water cooling (see figure 3). In the second phase, water cooled tungsten monoblocks (ITER relevant) will be used. The PFUs create a toroidal ring structure split into inner and outer divertor, with 12 repeated sectors of 30°, and receive major part of plasma heat flux density from the X-point location to the strike point (one strike point on the inner divertor and one on the outer divertor, see figure 4). Table 1 gives a summary of maximal heat fluxes density received by PFC for an extreme plasma scenario of 1 MW in a far X-point configuration [6].
Figure 1 : Iso-magnetic flux from which is computed heat loads
Figure 2 : WEST PFCs
Table 1: Maximum heat flux density received by PFC of WEST. Far X-point, 𝜆𝑞=5mm, Psol = 1MW
Plasma Facing Components (PFC) Maximum heat fluxes (MW/m2)
Lower divertor 3.53
Upper divertor 0.07
Baffle 0.06
2.2. Heat load simulation
The heat loads come mostly from transported particles along magnetic field lines which causes power flux deposits. A second source coming from the plasma radiations is here neglected. The PFCFlux code [7] is used to determine the heat flux received by all components for a given magnetic equilibrium reconstruction and a given physical model of the plasma power. The transported power is computed along the magnetic field lines assuming a purely parallel transport from the mid-lane to the PFC. Shadowing over the PFC is determined with ray tracing techniques. The heat flux pattern deposited on the PFC is function of (1) the magnetic equilibrium (X-point configuration), (2) the
7th European Thermal-Sciences Conference (Eurotherm2016) IOP Publishing
Journal of Physics: Conference Series 745 (2016) 032019 doi:10.1088/1742-6596/745/3/032019
power injected in the Scrape-Off Layer (SOL), (3) the decay length 𝜆𝑞 of the heat flux density in the SOL [5]. Our study will carry on a far X-point scenario (with X-point localized around 7cm above the divertor) and 𝜆𝑞=5mm, which correspond to the narrowest profile of heat load, as shown on figure 4. The intensity of the plasma heat flux on the PFU is limited to 12MW/m² to stay in a realistic case in WEST application and one can see that the peak is confined in a small area on PFU.
Figure 3 : Heat load on a PFU of the outer
lower divertor (W/m2) Figure 4 : Heat load on PFU sector of lower divertor (W/m2) 2.3. Infrared images simulation
The photonic simulation code is based on a Monte Carlo ray tracing (SPEOS CAA V5 Based from OPTIS [8]) able to propagate the rays through the complex geometry of our lighting scene and taking into account the multiple inter-reflections of the rays in the vacuum vessel. The camera model allows reproducing the real camera view including the detector sampling. The resolution of optical imaging system is assumed to be limited by the sensor pixel size neglecting the possible optical effects (diffraction, aberrations). In other words, the optical transfer function of the virtual camera is a top-hat function of width of a pixel size.
In this paper, “reflection-free” images, namely including only the thermal emission of targets, are used to compare the different reduced thermal model. The photonic simulation delivers images in radiance in W.m-2.sr-1. First, these radiance values are injected in the black body calibration law of the
camera (corresponding to the integration of Planck’s law in the wavelength range of the camera) to deduce the brightness temperature (this ‘apparent black body temperature’ is lower than the true temperature). Then, the emissivity is taken into account to deduce the true temperature.
The camera spatial resolution is also changed in order to assess the accuracy level needed for the reduced model. Three kinds of camera are simulated: (1) High Resolution (HR) camera with a pixel resolution of 0.5 mm in the object plane, which can allow seeing the gap between different PFUs (1-1.5mm), (2) Medium Resolution (MR) camera with 2 mm of pixel resolution and (3) Low resolution (LR) camera with 10mm of pixel resolution.
3. Thermal models
For the study of thermal transfer in graphite PFU in plasma condition, we compare different models, a complete one with the use of a 3D numerical tool, for a reference result, and two reduced models which perform faster calculation. As only surface temperature is needed for the photonic simulation, the idea of the reduced model is to use method that prevent from meshing all the PFU volume. The transient configuration that is chosen to compare the performances of the different models is the computation of the surface temperature for a prescribed constant surface heat flux starting at t=0. 3.1. Finite Element Method
Ansys Mechanical [9] is a Finite Element Analysis tool which can operate various physical calculations (mechanical, thermal, etc…) on 2D or 3D geometry. The Finite Element Method consists in discretizing the studied domain into elements where the Partial Differential Equation (PDE) to solve
7th European Thermal-Sciences Conference (Eurotherm2016) IOP Publishing
Journal of Physics: Conference Series 745 (2016) 032019 doi:10.1088/1742-6596/745/3/032019
in each element is transformed into a system of equations at first or second order. Then, a matrix formulation is used to solve the system of equations. This method requires volumic meshing method and high time-consuming calculations (see table 3 for time-calculation in comparison with reduced models).
3.2. Semi-infinite wall 1D
A basic reduced model is first used to convert the surface flux into temperature, considering that the geometry is a semi-infinite wall in the depth direction, because the rear face temperature remains near initial temperature during the whole simulation. This model could be a good approximation because the component is heated during a short enough time. However it assumes uniform heat flux density on the front surface with infinite area. The complete formulation of this method can be found in [10]. The surface temperature Tf obtained after exposure to a heat flux density 𝑞 during a time t is calculated by:
𝑇𝑓 = 𝑇0+ 2𝑞
𝜆√𝜋√𝑎𝑡 (1)
with 𝑎 =𝜌𝐶𝑝𝜆 the thermal diffusivity, T0 the initial temperature, 𝜆 the thermal conductivity, 𝜌 the
density and 𝐶𝑝 the heat capacity. This method is used for the 2D calculation of the surface temperature but remains a 1D method that does not take into account the lateral diffusion of the heat load. The temperature is calculated at each location where the component receives a plasma flux, with no consideration of the neighbourhood fluxes.
3.3. Thermal quadrupole
A most sophisticated method is the thermal quadrupole [11], already used in a 2D tokamak configuration in [12]. In the Laplace domain, this method links the temperature and heat flux density on the front face of the geometry to the corresponding ones on the rear face with the use of different matrices (just one 2 by 2 matrix in the simplest configuration for a one-layer material). In addition to the Laplace transform on time dimension, Fourier transforms on space dimensions can allow calculation in 2D or 3D. After resolution in the Laplace-Fourier domain, numerical inversion is used to give the solution in the physical time-space domain. The weaknesses of this method are the limited geometry possibilities (basically a slab, here in Cartesian coordinates) and the impossibility to perform calculation with temperature dependent physical properties.
The 3D thermal quadrupole capabilities are studied here for a better representation of the heat flux profile on the front face and to consider the lateral heat diffusion. So the studied PFU are considered as slabs and calculated separately, not as a sector like Ansys calculation. The link between heat flux density 𝜑 and temperature 𝜃 of the front face (z = 0) and the lower face (z = e) in Fourier-Laplace space can be written as:
[𝜃∗(𝛼, 𝛽, 0, 𝑝) 𝜑∗(𝛼, 𝛽, 0, 𝑝)] = [𝐴 𝐵𝐶 𝐷] [ 𝜃∗(𝛼, 𝛽, 𝑒, 𝑝) 𝜑∗(𝛼, 𝛽, 𝑒, 𝑝)] (2) with 𝐴 = 𝐷 = cosh(𝜎𝑒), 𝐵 = 1 𝜎𝜆𝑧sinh(𝜎𝑒), 𝐶 = 𝜆𝑧𝜎sinh(𝜎𝑒), 𝜎 = ( 𝑝 𝑎+ 𝜆𝑥 𝜆𝑧𝛼 2+𝜆𝑦 𝜆𝑧𝛽 2)1/2, 𝑝 (in s-1) is the Laplace variable, 𝛼 and 𝛽 (in m-1) are the Fourier variables corresponding to directions x and
y. The * and ̅ superscripts show that the variable is respectively in Laplace domain and/or Fourier domain. The rear face is considered as adiabatic, so 𝜑̅̅̅̅(𝑒, 𝑝) = 0. We obtain a system of two ∗ equations:
{𝜃∗(𝛼, 𝛽, 0, 𝑝) = 𝐴𝜃∗(𝛼, 𝛽, 𝑒, 𝑝)
𝜑∗(𝛼, 𝛽, 0, 𝑝) = 𝐶𝜃∗(𝛼, 𝛽, 𝑒, 𝑝) (3)
𝜃∗(𝛼, 𝛽, 0, 𝑝) =𝐴
𝐶𝜑∗(𝛼, 𝛽, 0, 𝑝) (4)
The Laplace transform of a constant heat flux density Q is written:
7th European Thermal-Sciences Conference (Eurotherm2016) IOP Publishing
Journal of Physics: Conference Series 745 (2016) 032019 doi:10.1088/1742-6596/745/3/032019
𝜑∗(𝑥, 𝑦, 0, 𝑝) =𝑄(𝑥, 𝑦)
𝑝 (5)
which gives in Fourier-Laplace domain after cosines transformation: 𝜑∗
̅̅̅̅(𝛼, 𝛽, 0, 𝑝) =1𝑝∫ ∫ 𝑄(𝑥, 𝑦)𝑐𝑜𝑠(𝛼𝑥)𝑐𝑜𝑠(𝛽𝑦)𝑑𝑥𝑑𝑦0𝐿𝑥 0𝐿𝑦 (6) The cosines formulation of the Fourier transform has been chosen because the lateral boundaries are considered to be in adiabatic conditions (x=0, y=0, x=Lx, y=Ly). This flux (6) is calculated by numerical integration. The temperature in Laplace domain is given by the following inverse Fourier transform: 𝜃∗(𝑥, 𝑦, 𝑧, 𝑝) = 1 𝐿𝑥× 𝐿𝑦𝜃 ∗ ̅̅̅(0,0, 𝑧, 𝑝) + 2 𝐿𝑥× 𝐿𝑦∑ 𝜃 ∗ ̅̅̅ (𝛼 =𝑛𝜋 𝐿𝑥, 0, 𝑧, 𝑝) cos(𝛼𝑥) ∞ 𝑛=1 … + 2 𝐿𝑥× 𝐿𝑦∑ 𝜃 ∗ ̅̅̅ (0, 𝛽 =𝑛𝜋 𝐿𝑦, 𝑧, 𝑝) cos(𝛽𝑦) ∞ 𝑛=1 … + 4 𝐿𝑥× 𝐿𝑦 ∑ ∑ 𝜃 ∗ ̅̅̅ (𝛼 =𝑛1𝜋 𝐿𝑥 , 𝛽 = 𝑛2𝜋 𝐿𝑦 , 𝑧, 𝑝) cos(𝛼𝑥) cos(𝛽𝑦) ∞ 𝑛2=1 ∞ 𝑛1=1 (7)
The temperature is then obtained in the time domain by numerical Laplace inversion with De Hoog algorithm [13]. Series 𝛼 and 𝛽 were stopped after 50 terms.
Regular spatial discretization was used to mesh the upper surface, with as much surface nodes as Ansys calculation. Interpolation was then performed to calculate the temperature at exactly same position.
4. Results
4.1. Temperature field and calculation analysis
The reference result was done by Ansys. A mesh of 2.7 million nodes was created as shown in figure 5 (max cell size: 3mm). Ansys handles temperature dependent physical properties of the graphite. Heat flux density is deposited on the upper face. Initial and environment temperature are set at 90°C, corresponding to the standard initial state inside the tokamak. Other sides of PFU are considered as adiabatic, since they are surrounded by environment in quite steady state at 90°C. Transient problem was considered for duration of 8.5s with a fine time step of 10ms to ensure a good stability of result. The PFU surface temperature after 8.5s is shown on figure 6. The maximum temperature reaches 1630°C and temperature profile is obviously less peaked than the heat flux profile because of lateral heat diffusion.
Figure 5 : PFU Mesh (2.7 millions nodes) Figure 6 : PFU surface temperature after 8.5s
7th European Thermal-Sciences Conference (Eurotherm2016) IOP Publishing
Journal of Physics: Conference Series 745 (2016) 032019 doi:10.1088/1742-6596/745/3/032019
The reduced models used cannot handle temperature dependent physical properties, so we use physical properties of graphite at temperature of 800°C, as shown in table 1, to have a compromise between areas at ambient temperature and areas at high temperature. As a comparison, we also perform an Ansys calculation with those constant physical properties.
Table 2 : Physical properties of graphite at 800°C
𝜆 (W/m/K) 𝜌 (kg/m3) Cp (J/kg/K)
55.3 1880 1829
Time calculations of different models are presented into table 2. The Ansys calculation and the semi-infinite wall calculation were performed on the global mesh for faster calculation (less time calculation for loading the geometry, global 3D geometry for Ansys and only surface geometry for the semi-infinite wall), but the thermal quadrupole method has to be done on each PFU separately. This explains the difference on the RAM memory used by thermal quadrupole versus other methods. FEM method gives the surface temperature for each time step whereas other reduced methods give the surface temperature only for the final time step and allow calculation to be 40 to 100 times faster.
Table 3 : Time calculation and memory used for different methods
Method Total time calculation RAM memory used
Ansys FEM 3D (temperature dependent) 20h 14336MB
Thermal quadrupole 3D 0.5h 50MB
Semi-infinite wall 1D 0.19h 1310MB
4.2. Temperature profile before photonic simulation
The temperature profile along the hottest PFU (see figure 7) is plotted on figure 8 together with profiles given by the different models. The use of constant properties instead of real properties tends to enhance the heat diffusion inside the PFU, resulting to a lower maximum temperature and smaller surface hot zone.
Figure 7 : Axis of comparison Figure 8 : Temperature profile along a graphite PFU
The semi-infinite model is inaccurate due to the non-consideration of the lateral heat diffusion, largely overestimating temperature at the high flux locations (up to 800°C for present case) and underestimating temperature at the low flux locations. The heat diffusion is quite well modelled by 3D quadrupole versus FEM calculation with constant properties, but it tends to overestimate the maximum temperature of 180°C.
By comparison with real properties calculation, the overestimation is of only 60°C for the maximum temperature and the discrepancy of temperature is never more than 85°C elsewhere. For the next part, we will consider as reference result only the one coming from the real temperature dependent properties calculation.
7th European Thermal-Sciences Conference (Eurotherm2016) IOP Publishing
Journal of Physics: Conference Series 745 (2016) 032019 doi:10.1088/1742-6596/745/3/032019
4.3. Impact of camera resolution on temperature profile
Photonic simulations were performed using the temperature field obtained from the three different methods to produce the IR images in the studied resolution. Figure 9 shows the IR image associated to the temperature field given by Ansys FEM 3D model, after conversion from radiance to surface temperature as explained previously. A zoom on the IR image of the hottest PFU with input temperature coming from each model is presented in figure 10. The image from Ansys temperature (on left) and quadrupole temperature (on middle) are quite similar. As expected, the semi-infinite model temperature produces a very different image.
Figure 9 : Simulated HR IR image of the PFU with temperature from Ansys FEM 3D model
Figure 10: Comparison of HR simulated IR images of hottest PFU with different methods. Left: FEM 3D temperature. Middle: Quadrupole 3D. Right : Semi-infinite wall 1D
The figure 11 shows the temperature profile deduced from the simulated IR images for the 3 different camera resolution using temperature from Ansys FEM 3D as input and compared to the Ansys temperature. HR camera allows recovering accurately the temperature, the MR camera tends to underestimate the peak of temperature by 40°C and the LR camera is too coarse to see accurately the temperature. On figure 12, the temperature profile from simulated IR images (MR and HR resolutions) are presented together with the temperature profiles calculated from the different methods.
Figure 11 : Temperature profile on simulated IR images versus temperature before photonic simulation
Figure 12 : Temperature profile on simulated IR images
As expected, the semi-infinite wall remains inaccurate with an error higher than 800°C on the peak temperature for any camera resolution. The quadrupole 3D model is more reliable but, on some pixels, the discrepancy can reach 200°C for HR camera, higher than the one on the temperature estimated
7th European Thermal-Sciences Conference (Eurotherm2016) IOP Publishing
Journal of Physics: Conference Series 745 (2016) 032019 doi:10.1088/1742-6596/745/3/032019
before photonic simulation (maximum discrepancy of 85°C). Temperature error is evaluated more important with HR camera. Two causes may explain this discrepancy: first, the mesh used in this simulation is too coarse compared to the camera resolution of HR camera, and secondly higher resolution makes more sensitive the results to the camera position (pixelization of peak profile). 5. Conclusion
This paper introduces the methodology to perform an end-to-end simulation of thermal characterisation of WEST tokamak from heat flux density profile (coming from the plasma and deposited on the different components) to the IR image obtained with a virtual infrared camera. It also presents different reduced thermal models which can be used to determine the surface temperatures of the PFC with an affordable time calculation. A study was performed on the lower divertor where maximum flux density is received following a peaked form. Semi-infinite wall approximation and 3D thermal quadrupole are tested and compared to a reference solution obtained by 3D FEM. Good agreement is obtained with the 3D quadrupole model (maximal temperature overestimated by 7%) whereas the semi-infinite model, by its non-consideration of lateral heat diffusion, cannot model accurately neither the heating magnitude nor its pattern. Infrared images are then simulated from those temperature profiles, with different camera resolutions (pixel of 0.5mm to 10mm). The results show that for the best resolution, the temperature determined from those IR images can present a gap up to 200°C (12% of overestimation) between the 3D quadrupole solution and the reference solution which is higher than the 5% expected precision on measured temperature.
The accuracy of methods is assessed from the discrepancy between the simulated IR images which shows that none of both methods remains precise enough to reduce time calculation. Moreover, none of these methods can use temperature dependant physical properties. For this case, the use of constant properties has reduced the error of the reduced models but for other PFUs, with other materials, the use of constant properties could increase the error. Next step will be to investigate another reduced model based on matrix formulation [14] and able to take into account temperature dependent physical properties. This model has to be constructed from some reference results, thus Ansys will be used with a thin mesh to give those reference results.
Acknowledgments
This work has been carried out thanks to the support of the A*MIDEX project (n°ANR-11-IDEX-0001-02) funded by the “Investissements d’Avenir” French Government program, managed by the French National Research Agency (ANR).
References
[1] Aumeunier M-H. et al., 2012, IEEE Transactions On Plasma Science, 40, 3. [2] Missirlian M. et al, 2014, Fusion Engineering and Design , 89, 1048-53. [3] Bourdelle C. et al, 2015, Nuclear Fusion, 55, 063017-32.
[4] Bucalossi J. et al, 2014, Fusion Enginerring and Design, 89, 907-12. [5] Eich T. et al., 2013, Journal of Nuclear Materials, 438, 72-77.
[6] Firdaouss M. et al., 2015, Fusion Engineering and Design, 98-99, 1294-98. [7] Firdaouss M. et al., 2013, Journal of Nuclear Materials, 438, 947-50. [8] Aumeunier M-H. et al., 2012, Review of Scientific Instruments, 83, 10D522. [9] Ansys Inc., 2013, ANSYS Mechanical APDL Theory Reference, Release 15
[10] Özişik N., 1985, Heat Transfer : A Basic Approach, McGraw-Hill international editions : Mechanical engineering series, (McGraw-Hill Education), ISBN : 0-07-066460-9
[11] Maillet D. et al., 2000, Thermal Quadrupoles : Solving the Heat Equation Through Integral Transforms, John Wiley and Sons Ldt, (Chichester), ISBN 0471983209.
[12] J.-L. Gardarein et al. , 2009, International Journal of Thermal Sciences, 48, 1, 1-13 [13] de Hoog, F. R. et al., 1982, SIAM Journal Scientific and Statistical Computing, 3, 357-66. [14] Girault M. and Petit D., 2005, International Journal of Heat and Mass Transfer, 48, 105-18
7th European Thermal-Sciences Conference (Eurotherm2016) IOP Publishing
Journal of Physics: Conference Series 745 (2016) 032019 doi:10.1088/1742-6596/745/3/032019