HAL Id: in2p3-00407948
http://hal.in2p3.fr/in2p3-00407948
Submitted on 10 Feb 2010HAL is a multi-disciplinary open access archive for the deposit and dissemination of sci-entific research documents, whether they are pub-lished or not. The documents may come from teaching and research institutions in France or abroad, or from public or private research centers.
L’archive ouverte pluridisciplinaire HAL, est destinée au dépôt et à la diffusion de documents scientifiques de niveau recherche, publiés ou non, émanant des établissements d’enseignement et de recherche français ou étrangers, des laboratoires publics ou privés.
On the predictions of the models for the Super-Heavy
Elements
D. Boilley, Y. Abe, Caiwan Shen, B. Yilmaz
To cite this version:
D. Boilley, Y. Abe, Caiwan Shen, B. Yilmaz. On the predictions of the models for the Super-Heavy Elements. 12th International Conference on Nuclear Reaction Mechanisms, Jun 2009, Varenna, Italy. pp.480-486. �in2p3-00407948�
On the predictions of the models for the Super-Heavy Elements
David Boilley1,2, Yasuhisa Abe3, Caiwan Shen4 and Bülent Yılmaz1,5
1GANIL, CNRS/IN2P3-CEA/DSM, BP 55027, F-14076 Caen cedex 5, France 2Univ. Caen, Esplanade de la Paix, B.P. 5186, F-14032 Caen cedex, France 3RCNP, Osaka University, Ibaraki (Osaka), 567-0047 Japan
4School of Science, Huzhou Teachers College, Huzhou 313000, China 5Department of Physics, Ankara University, 06100 Ankara, Turkey
Abstract
Nuclear structure calculations predict the existence of super-heavy elements (SHE) that are tentatively synthesized through heavy-ion collisions. A com-plete description of the reaction to synthesize Super-Heavy Elements is nec-essary to bridge these predictions with the experimental results on the fission time and residue cross sections. In this contibution, we will present the con-straints that can be given on the shell correction energy from experimental data and the developments that are needed for the dynamical models.
1 Introduction
Super-Heavy Elements (SHE) are expected to exist due to the next magic number corresponding to a closed shell but they have never been observed in nature. There has been a continuous attempt to synthesize them by heavy-ion collisions in various laboratories since these last decades. In parallel, there have been also continuous theoretical developments in order to describe the whole reaction process leading to the synthesis of the SHE. One of the long-term goal is to be able to guide the experiments. Before that, the dynamical model can give constraints on the shell correction energy predicted by various models, by linking them to the experimental results. As a matter of fact, there are large discrepencies on the prediction of the structure models, leading to a large variety of shell correction energies. Even the next magic number is not known.
Fusion models developed for lighter systems cannot be simply extrapolated to heavy ion collisions. It is well known that fusion is hindered for heavy systems, i.e. an extra energy is necessary for the colliding system to fuse. But SHE are very fragile and undergo fission as soon as they are slightly excited. On one hand, they should be synthesized with a high energy in order to fuse and on the other hand, with a low energy in order to survive. Therefore, experiments are facing the problem of the extremely low cross-sections, of the order of picobarns or less. This means that we have very few data and information to constrain the models.
In order to avoid these problems, some experiments have been performed at GANIL to measure the fission time of the SHE in order to get some information on their stability [1]. The larger shell correction energy, the longer fission time. Statistics are not a problem anymore. What information on the shell energy can we extract from the long fission times that were observed?
In this talk, we will present the information we can get from these experimental results. Unfortu-nately, they will appear not precise enough to get strict information on the shell correction energy. So, we will also present the conditions that are necessary to get precise information from the residue cross sections.
2 What can we learn from the fission time of SHE?
2.1 Long fission time of the Z = 120 and 124 elements
The fission time of super-heavy elements Z = 114, 120 and 124 obtained by fusion reaction were measured at GANIL using the crystal blocking technique. It was observed that for the last two elements,
1E-20 1E-19 1E-18 1E-17 1E-16 1E-15 1E-14 0 0,5 1 1,5 2 Bf/Bn A
verage fission time (s)
without gamma emission
with gamma emission E*=80 MeV
0 1 2 3 4 5 6 7 8 0 0,5 1 1,5 2 Bf/Bn
Mean pre-fission neutron
multiplicity
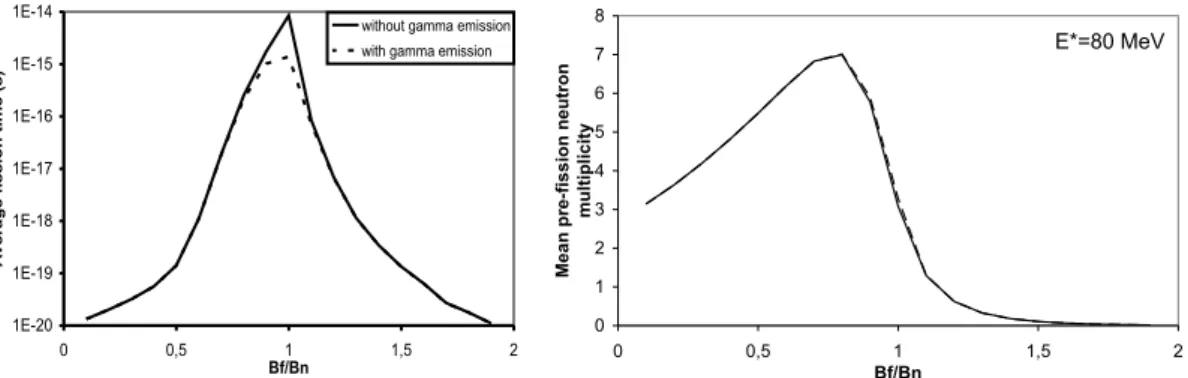
Fig. 1: Left: Average fission time of a Z = 124 like nucleus at E∗= 80 MeV with the fission barrier, Bf and the
binding energy of the neutrons Bnthe same all along the isotope chain. Right: pre-scission neutron multiplicities
for the same system.
at least 10% of the capture events had a long fission time, longer than 10−18 s. No such long fission events were observed for Z = 114 [1].
A fission time of 10−18s is very long compared to the fission width that is of the order of 1021s−1. This is explained by the fact that the fission decay channel enters into competition with the evaporation of light particles, mainly neutrons. In order to describe the decay of a hot nuclei including all the possible channels, we have developed a specific code [2, 3]. The physical ingredients entering this code are very classic. One of its main specificities is that it solves dynamically Bateman equations which describe the time evolution of the cascade.
Let us first consider the very simplified case where the compound nucleus obtained by a fusion reaction can only decay through fission or neutron evaporation, the main two channels. In addition, we will suppose that the neutron binding energy Bnand the fission barrier Bf are the same for all the isotopes of the evaporation chain. The average fission time and number of pre-scission neutrons are plotted in Fig. 1.
When the fission barrier is small, smaller than the neutron binding energy, fission occurs quickly and the isotope chain is short. Then, the averge fission time is small. When the fission barrier increases, the average fission time also increases. But, when the fission barrier is very large, the fission time decreases. This is due to the fact that the excitation energy of the isotopes of the chain decreases by evaporation and goes below the fission barrier. Then, the rare fission events are only due to the first isotopes of the chain, as it can be seen by the number of pre-scission neutrons. As a consequence, long average fission times mean that the fission barrier should be of the order of the neutron binding energy to allow competition between the two decay channels all along the evaporation chain. Typically, Bf ' 3 MeV is necessary to get 10% of the fission events with a fission time longer than 10−18s. The long time fission events observed by the crystal blocking experiments correspond to events that occur after the evaporation of several neutrons [4].
In reality, the fission barrier is not uniform along the chain. It depends, of course, on the properties of the isotope which are not known. In addition, it is also affected by the excitation energy because it is mainly due to the shell correction energy in this region of the nuclear chart. This is included in our calculations through the Ignatyuk’s prescription on the level density parameter [5]. When the excitation energy is high enough, this prescription can be appromimately expressed by an effective fission barrier [6, 7],
Bf ' |∆Eshell| exp(−E∗/Ed). (1)
Here, E∗ and Ed = 18.5 MeV are the excitation energy and a parameter called the damping energy respectively. With an excitation energy of 70 to 80 MeV, the long fission tails observed for the Z = 120 and 124 nuclei mean a large ∆Eshellat the beginning of the chain, larger than the typical values of the
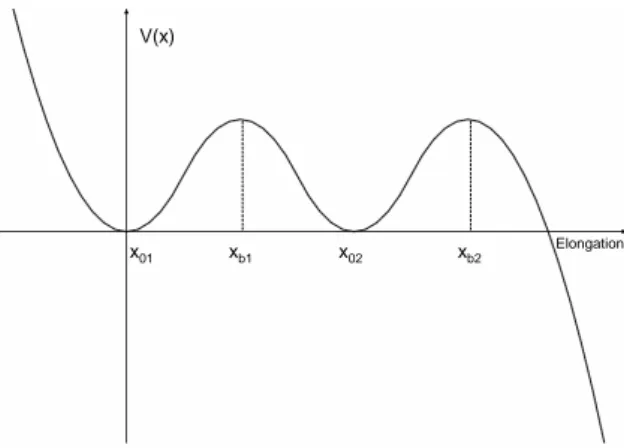
V(x)
x01 xb1 x02 xb2
Elongation
Fig. 2: Potential shape with two humps that gives the longest fission time.
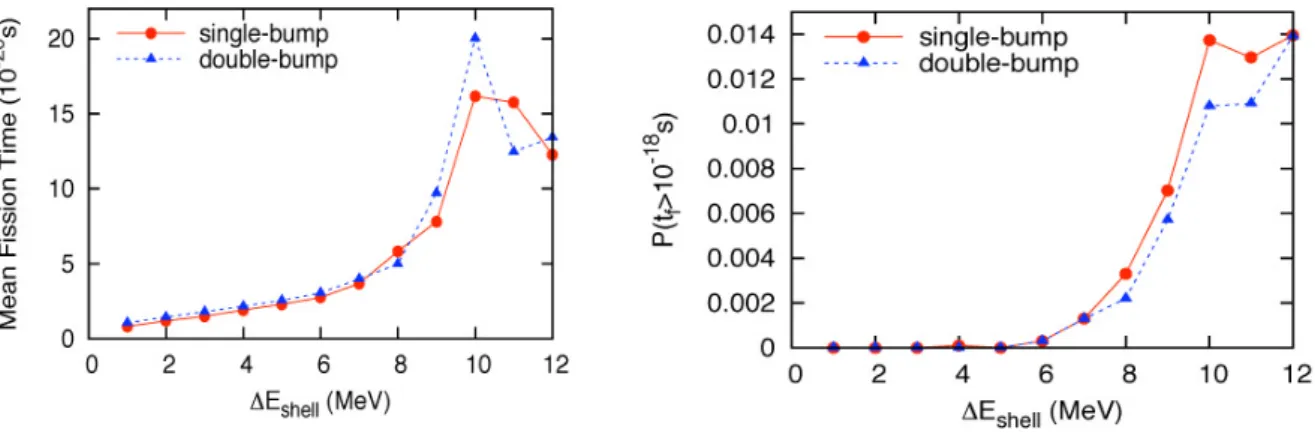
0 2 4 6 8 10 12 1 2 3 4 5 6 tfis (double-bump)/t fis (single-bump) Bf (MeV)
Fig. 3: Ratio of the average fission time of a hot nucleus evaporating neutrons calculated with the double humped
potential of Fig. 2 and the one calculated with a single-humped potential.
mass tables [8,9]. How much? It is hard to say because about 9 isotopes are contributing to this long tail. At this stage, the only thing we can say is that the observed long fission times for the Z = 120 and 124 elements are hints that these elements should have a large extra-stability due to the shell structure of the nuclei, but we can’t hardly be more quantitative. These large values are due to the phenomenological damping function of the shell correction energy [5].
2.2 Effect of an isomeric state on the fission time
The fission width that enter any statistical code is based on the Bohr and Wheeler [10] formula that supposes that there is only one fission barrier between the compound and scission shapes. But for the SHE, the potential might have structures similar to what is known for actinides, as predicted by some structure calculations [11]. How such a fission isomer influences the fission time?
We have investigated various kinds of potential shape with structure, and the one that increases most the fission time is with two equal barriers, see Fig. 2. Then, we have calculated the average thermal fission time and the number of events with a fission longer than 10−18s, using a Langevin equation, as it is usually done [12], including neutron evaporation. With a fixed potential for all isotopes, the result are shown in Fig. 3: the average fission time can be up to one order of magnitude longer with a potential with structure [13]. For the sake of simplicity, we have assumed, in this calculation, that the other parameters like the level density, the reduced friction or the inertia do not depend on the deformation.
E = 0
E = 5 M eV
E* = 2 0 M eV E* = 2 M eV
Fig. 4: Evolution of the potential used for the calculation with excitation energy.
Fig. 5: Comparision of the average fission time and the number of fission events longer than 10−18s calculated
with the two potentials of Fig. 4. These results are still preliminary.
This toy model shows that a uniform fission barrier of about 2 MeV is necessary to have 10% of the fission events longer than 10−18s with a double-humped potential instead of 3 MeV with a single-humped one.
Again, a fixed barrier for all isotopes and excitation energies is not realistic. The structure due to the shell correction energy tends to disappear at high excitation energy [14]. To take into account such an effect, we considered the potentials of Fig. 4 and did the same comparison between the single- and double-humped cases. The results of Fig. 5 show that there is almost no difference anymore between the two cases [13].
As a conclusion, the structure effect cannot explain the long fission time observed in the experi-ments. This strengthens the hypothesis that such an observation is due to a large shell correction energy. The main problem of these fission time measurements is that they involve several isotopes. It is then impossible to constrain the shell correction energy of each of them separately. This is not the case for the residue cross sections that are measured for each isotope.
3 What can we learn from the residue cross sections of the SHE?
3.1 Residue cross sections
Let us now consider the residue cross sections measured at GSI, JINR and RIKEN. They can be calcu-lated with KEWPIE2 [2, 3], the code used for the fission time, with the same physical ingredients. The results are very sensitive to the fission width, since this decay channel is the main one. A slight change of the fission width will not affect much the fission probability which remains close to 1, but will have a dramatic effect on the residue cross sections.
The fission width depends on three parameters that are, the fission barrier which is mainly due to the shell correction energy in the SHE region, the evolution of the shell correction energy with the excitation energy, characterized by the so-called damping energy, see eq. (1), and the friction coefficient. In order to reproduce all the experimental data, obtained by both hot and cold fusion, one has to fix the damping energy to Ed = 18.5 MeV and the friction coefficient to β = 2 × 10²¹ s−1, which are usual values [3]. Then, the shell correction energy can be adjusted for all the measured elements with an accuracy of the order of 1 MeV, which corresponds to a change of one order of magnitude of the cross section.
Unfortunately, such an accuracy can only be reached if one knows the fusion cross section. For heavy nuclei, fusion is hindered and the model developed for lighter systems cannot be simply extrapo-lated.
3.2 Origin of the fusion hindrance
The origin of the fusion hindrance is nowadays well understood and accepted: to synthesize a compound nucleus with a large fissibility, the di-nucleus system has to cross an inner barrier between the Coulomb barrier and the compound shape [15–18]. This inner barrier does not exist for light systems. Dissipation also plays a crucial role in the study of the barrier crossing and is a key parameter to evaluate the fusion probability [19].
Most of the models used to describe the fusion of SHE are qualitatively based on the same scheme: the fusion probability is calculated in two steps [20] and obtained by the product of the capture probability corresponding to the crossing of the Coulomb barrier and the formation probability corresponding to the crossing of the inner barrier. But the size of the barriers and the strength of the dissipation mechanism differ from one model to the other.
On an experimental point of view, it is very difficult to distinguish between quasi-fission and fission events. Therefore, there are no reliable fusion cross sections. Then, how to assess the key parameters entering the fusion models?
The fusion cross section appears to be very sensitive to the way the evolution of the neck between the two colliding nuclei is treated. This is easily understood at looking at the evolution of the inner barrier with the neck parameter, Fig. 6, left plot. We solved dynamically the evolution of the neck when the two nuclei are at contact [17] and showed that it evolves faster than the relative distance. The characteristic time of the denecking process is one order of magnitude shorter than the diffusion time over the barrier along the relative distance [22]. This can be explained by the strong slope the LDM potential at contact, along the neck variable, Fig. 6, right plot, and the respective inertia of these two collective variables.
Therefore, we have a good argument to fix the neck parameter at its thermal average value, hεi =
0.1, to study the formation process from the contact point to the compound shape. Such a conclusion is
in agreement with the hypothesis done in Ref. [18] but contradicts the conclusions of Ref. [23]. Do we have experimental arguments to assess this conclusion?
The fusion hindrance is explained by the existence of an inner barrier. Then the appearance of this phenomenon should corresponds to the overlap of the Coulomb and inner barriers. The matching of the experimental and theoretical frontiers is a way to constrain the inner potential barrier which depends
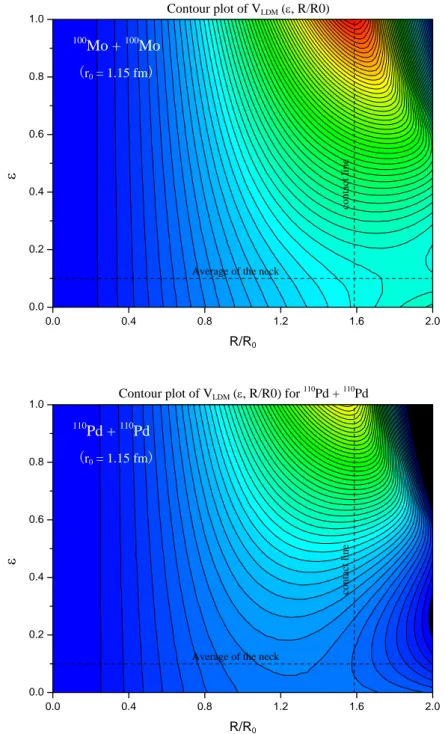
Fig. 6: LDM potential for100Mo+100Mo as a function of the relative distance (left) for various neck parameters
and as a function of the neck at contact (right). ε = 1 corresponds to two touching spheres and ε = 0 to a neckless shape.
on the neck parameter, see Fig. 6 [24]. For symmetric reactions, fusion hindrance appears between 100Mo+100Mo and110Pd+110Pd [25]. The second reaction is hindered, not the first one.
In Fig. 7, we show the contour plot of the LDM potential calculated with the two-center parametriza-tion [26] for both cases. The vertical lines correspond to the contact posiparametriza-tion, just after the crossing of the Coulomb barrier. It can be considered as the injection point. The location of the compound nucleus is at the left of the figure. For the 100Mo+100Mo case, the injection point is on the inner side of the LDM barrier, whathever the value of the neck parameter, but for the 110Pd+110Pd case, this is not the case for small neck values. Since the110Pd+110Pd fusion reaction is hindered, this analysis suggests that the value of the neck parameter should be small, smaller than 0.6, in agreement with the dynamical arguments.
With this study, we have clarified the behavior of an important aspect of the fusion of heavy elements that is related to size of the barriers that has to be crossed in order to reach a compound nucleus. The present study is limited to symmetric reactions for the moment and its extrapolation to asymmetric cases is under progress. But the fusion probabilities also depend a lot on the dissipation mechanisms [22] which has to be assessed by other means.
4 Conclusions
Dynamical models that can describe the whole reaction leading to the synthesis of SHE are very im-portant to assess the prediction of the nuclear structure calculations with the exprimental results. These dynamical models cannot simply be extrapolated from what is known from reactions with lighter nuclei because fusion is hindered. The origin of the hindrance is well established, but not its amplitude. This means that we also have to find a way to assess the dynamical models themselves.
On one hand, we have data from fission time measurements that have the merit to be performed at an energy that is high enough to consider that the fusion probability is close to one. The long fission time observed for the Z = 120 and 124 nuclei are explained by the fact the process involves a complete decay chain. Therefore, these data, which involve several isotopes, cannot give constraints on each of the isotope separately. The only thing that we can conclude from these experiments is that the shell correction energy the compound nuclei formed during these reactions should be large, larger than the usual predictions. Quantitative values are very sensitive to the way shell correction energies are affected by the excitation energy.
On the other hand, we have many data from the residue cross section measurements. The merit of these data is that we can constrain the shell correction energy of each isotope with a accuracy of about 1 MeV. But such a performance depends on the reliability of the fusion cross section data or model.
0.0 0.4 0.8 1.2 1.6 2.0 0.0 0.2 0.4 0.6 0.8 1.0 R/R0 ε contact line
Average of the neck
100 Mo + 100Mo (r0 = 1.15 fm) Contour plot of VLDM (ε, R/R0) 0.0 0.4 0.8 1.2 1.6 2.0 0.0 0.2 0.4 0.6 0.8 1.0 R/R0 ε contact line
Average of the neck
110
Pd + 110Pd
(r0 = 1.15 fm)
Contour plot of VLDM (ε, R/R0) for 110
Pd + 110 Pd
Fig. 7: LDM potential map for100Mo+100Mo (top) and110Pd+110Pd (bottom) as a function of the relative distance
Experimentally, it is difficult to distinguish between fission and quasi-fission events, and then to extract the fusion probabilities from the data. One has to find other means to assess the fusion models of the hindered systems. We have shown that the appearance of the fusion hindrance gives constraints on the fusion barriers.
Fusion probabilities depend also a lot on the dissipation strength of the models. One of the main challenge is therefore to find a mean to assess this mechanism.
Acknowledgements
Authors thanks GANIL, Huzhou Teachers College and RCNP for the warm hospitality and support extended to them during many visits. The present work has been supported in part by the Natural Science Foundation of China under the grant No. 10675046, the key project of the Ministry of Education of China under the grant No. 209053, by the JSPS grant No. 18540268 and by the LIA between GANIL and RIKEN.
References
[1] M. Morjean et al, Phys. Rev. Lett. 101 (2008) 072701 [2] B. Bouriquet et al, Comp. Phys. Comm. 159 (2004) 1
[3] A. Marchix, PhD thesis, Univ. Caen (2007), http://tel.archives-ouvertes.fr/ tel-00197012/fr/
[4] D. Boilley et al, Int. J. Mod. Phys. E17 (2008) 1681 [5] A.V. Ignatyuk et al., Sov. J. Nucl. Phys. 21 (1975) 255 [6] Y. Abe et al, Acta Phys. Polonica B34 (2003) 1927 [7] W. J. ´Swi¸atecki et al, Phys. Rev. C78 (2008) 054604
[8] P. Möller et al, At. Data and Nucl. Data Tables, 59 (1995) 185
[9] H. Koura et al, http://wwwndc.tokai-sc.jaea.go.jp/nucldata/mass/KTUY04_E.html [10] N. Bohr and Wheeler, Phys. Rev. 56 (1939) 426
[11] J.C. Pei et al, Phys. Rev. Lett. 102 (2009) 192501 [12] Y. Abe et al, Phys. Rep. 275 (1996) 49
[13] B. Yılmaz et al, under preparation
[14] J. A. Sheikh et al, Phys. Rev. C80 (2009) 011302(R) [15] W. J. ´Swi¸atecki, Nucl. Phys. A376 (1982) 275 [16] G. Royer et al, Nucl. Phys. A444 (1985) 477
[17] Y. Abe et al, Prog. Theor. Phys. Suppl. 146 (2002) 104
[18] W. J. ´Swi¸atecki, K. Siwek-Wilczy´nska and J. Wilczy´nski, Phys. Rev. C71 (2005) 014602 [19] Y. Abe et al, Phys. Rev. E61 (2000) 1125
[20] C. Shen et al, Phys. Rev. C66 (2002) 061602 (R)
[21] Y. Abe et al, Int. J. Mod. Phys. E17 (2008) 2214; Int. J. Mod. Phys. E18 (2009) [22] D. Boilley et al, Eur. Phys. J. A18 (2003) 627
[23] J.D. Bao, Int. J. Mod. Phys. E15 (2006) 1625 [24] C. Shen et al, Science in China G 52 (2009) 1458 [25] K.-H. Schmidt et al, Rep. Prog. Phys. 54 (1991) 949 [26] K. Sato et al, Z. Phys. A288 (1978) 383