HAL Id: cea-00881375
https://hal-cea.archives-ouvertes.fr/cea-00881375
Submitted on 15 Oct 2019
HAL is a multi-disciplinary open access
archive for the deposit and dissemination of
sci-entific research documents, whether they are
pub-lished or not. The documents may come from
teaching and research institutions in France or
abroad, or from public or private research centers.
L’archive ouverte pluridisciplinaire HAL, est
destinée au dépôt et à la diffusion de documents
scientifiques de niveau recherche, publiés ou non,
émanant des établissements d’enseignement et de
recherche français ou étrangers, des laboratoires
publics ou privés.
Serial translocation by means of circular intermediates
underlies colour sidedness in cattle
Keith Durkin, Wouter Coppieters, Cord Drögemüller, Naima Ahariz, Nadine
Cambisano, Tom Druet, Corinne Fasquelle, Aynalem Haile, Petr Horin,
Lusheng Huang, et al.
To cite this version:
Keith Durkin, Wouter Coppieters, Cord Drögemüller, Naima Ahariz, Nadine Cambisano, et al.. Serial
translocation by means of circular intermediates underlies colour sidedness in cattle. Nature, Nature
Publishing Group, 2012, 482 (7383), pp.81-84. �10.1038/nature10757�. �cea-00881375�
LETTER
doi:10.1038/nature10757Serial translocation by means of circular
intermediates underlies colour sidedness in cattle
Keith Durkin1, Wouter Coppieters1, Cord Dro¨gemu¨ller2, Naima Ahariz1, Nadine Cambisano1, Tom Druet1, Corinne Fasquelle1,
Aynalem Haile3, Petr Horin4, Lusheng Huang5, Yohichiro Kamatani6, Latifa Karim1, Mark Lathrop6, Simon Moser7, Kor Oldenbroek8, Stefan Rieder7, Arnaud Sartelet1, Johann So¨lkner9, Hans Sta˚lhammar10, Diana Zelenika6, Zhiyan Zhang1,
Tosso Leeb2, Michel Georges1& Carole Charlier1
Colour sidedness is a dominantly inherited phenotype of cattle char-acterized by the polarization of pigmented sectors on the flanks, snout and ear tips1. It is also referred to as ‘lineback’ or ‘witrik’
(which means white back), as colour-sided animals typically display a white band along their spine. Colour sidedness is documented at least since the Middle Ages and is presently segregating in several cattle breeds around the globe, including in Belgian blue and brown Swiss1,2. Here we report that colour sidedness is determined by a first
allele on chromosome 29 (Cs29), which results from the translocation
of a 492-kilobase chromosome 6 segment encompassingKITto chromosome 29, and a second allele on chromosome 6 (Cs6), derived
from the first by repatriation of fused 575-kilobase chromosome 6 and 29 sequences to theKITlocus. We provide evidence that both translocation events involved circular intermediates. This is the first example, to our knowledge, of a phenotype determined by homo-logous yet non-syntenic alleles that result from a novel copy-number-variant-generating mechanism.
To gain insights into the molecular basis of colour sidedness (Fig. 1), we genotyped 21 colour-sided and 30 control Belgian blue animals with a custom-made 50K single nucleotide polymorphism (SNP) array3. As a result of segregation at the roan locus, Belgian blue animals
are either black spotted (rBlrBl), blue spotted (rBlrWh) or white (rWhrWh)4.
As white is epistatic to colour sidedness, we selected non-white control animals. We assumed autosomal dominant inheritance (Cs allele) and genetic homogeneity in Belgian blue, and thus scanned the genome of colour-sided animals for a shared haplotype (present in at least one copy) using the ASSDOM software (see Methods). This analysis yielded a single genome-wide significant signal (P , 0.03), mapping the Cs locus to bovine chromosome 29 (BTA29) (Fig. 2a and Supplemen-tary Fig. 1). A sire transmitting the colour-sided phenotype to all its pigmented offspring was homozygous for the corresponding haplotype as expected. The shared haplotype spanned 1.9 Mb, and encompassed LUZP2—not known to be involved in pigmentation—as the only gene. Sequencing the LUZP2 open reading frame (ORF) from colour-sided and control animals did not reveal any protein-sequence-altering vari-ant (data not shown).
In an independent effort, we scanned the genome for copy number variants (CNVs) using a database of 50K SNP genotypes from .4,500 animals of different breeds and the PennCNV software5. Intriguingly,
this analysis revealed a private duplication encompassing 26 SNPs on chromosome 6 (BTA6), shared by the 21 colour-sided Belgian blue animals (Fig. 2b). We confirmed and refined the boundaries of this ,480 kb duplication by comparative genome hybridization (CGH) of genomic DNA of a Cs/Cs and 1/1 Belgian blue animal
on a genome-wide Nimblegen tiling array (Fig. 2c). The corresponding CNV encompassed the KIT gene, known to be essential for melanocyte migration and survival6, and to be associated with coat colour
variation7,8.
To reconcile these apparently discrepant results, we performed fluorescence in situ hybridization (FISH) with bacterial artificial chro-mosome (BAC) clones mapping respectively to the BTA29 association interval (labelled with a red fluorophore), and to the BTA6 CNV interval (labelled with a green fluorophore) on lymphocytes of a Cs/ 1and a 1/1 animal. Overlapping red and green signals on one of the BTA29 homologues of the colour-sided animal demonstrated that the
1Unit of Animal Genomics, GIGA-R & Faculty of Veterinary Medicine, University of Lie`ge (B34), 1 Avenue de l’Hoˆpital, 4000-Lie`ge (Sart Tilman), Belgium.2Institute of Genetics, University of Bern,
Bremgartenstrasse 109a, Postfach 8466, 3001 Bern, Switzerland.3International Center for Agricultural Research in the Dry Areas (ICARDA), PO Box 5466, Aleppo, Syria.4Institute of Genetics, University of
Veterinary and Pharmaceutical Sciences Brno, 612 42 Brno, Czech Republic.5Key Laboratory for Animal Biotechnology of Jiangxi Province and the Ministry of Agriculture of China, NanChang, Jiangxi
Province, 330045, China.6Fondation Jean Dausset – Centre d’Etude du Polymorphisme Humain, 27 Rue Juliette Dodu, Paris 75012, France and CEA-IC Centre National de Ge´notypage, 2 Rue Gaston
Cre´mieux, CP 5721, 91057 Evry Cedex, France.7Swiss College of Agriculture, Bern University of Applied Sciences, 3052 Zollikofen, Switzerland.8Centre for Genetic Resources the Netherlands (CGN), 6701
BH Wageningen, The Netherlands.9Division of Livestock Sciences, University of Natural Resources and Applied Life Sciences, A-1180 Vienna, Austria.10Viking Genetics, O¨ rnsro, Box 64, S-532 21 Skara,
Sweden.
a
b c
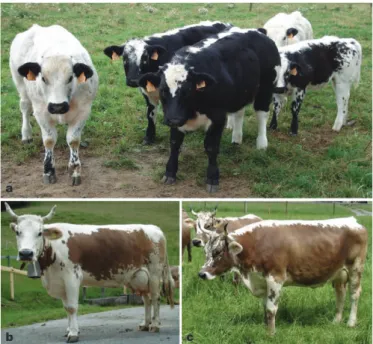
Figure 1|Colour-sided Belgian blue and brown Swiss animals. a, All represented Belgian blue animals are heterozygous Cs/1. In addition to the effect of the Cs locus, which causes polarization of pigmented sectors to the flanks, ears and snout, Belgian blue animals exhibit considerable polygenic variation in the degree of white spotting. The colour-sided phenotype of the two nearly completely white animals (extensive degree of white spotting) is apparent from the pigmentation of ear tips and snout. b, c, In brown Swiss, which are generally devoid of white spotting, homozygous Cs/Cs (b) and heterozygous Cs/1 (c) animals differ by the extent of pigmentation, explaining why colour sidedness is also referred to as semi-dominant.
CNV signal resulted from the translocation of the ,480 kb BTA6 segment to BTA29 (Fig. 2d). Retrospective examination of the SNP genotypes indicated that on average 3.17 of the 26 SNPs mapping to the ,480 kb duplication could not be called in colour-sided animals, yet the remaining genotypes were sufficient to yield a suggestive asso-ciation signal (genome-wide P 5 0.37), reflecting the sharing of the extra KIT haplotype by colour-sided animals (Fig. 2a).
To define the translocation breakpoints, we generated mate-pair libraries from self-ligated ,5 kb DNA fragments of a homozygous Cs/Cs Belgian blue animal, and generated ,10 Gb of sequence on an Illumina GAIIx instrument. We expected two clusters of aberrant mate pairs spanning the left and the right breakpoint resulting from the insertion of an intact BTA6 fragment in a BTA29 segment. We refer to the intact BTA6 fragment as A–B–C–D–E, the BTA29 segment in which it inserts as a–b, and the resulting left and right breakpoints as a–A and E–b, respectively. However, we observed three aberrant mate-pair clusters corresponding respectively to a–D, E–A and C–b fusions (Supplementary Fig. 2). The corresponding topology is most parsimoniously explained by assuming that: (1) the translocated BTA6 fragment circularized (generating fusion E–A); (2) reopened in the C–D interval; and (3) integrated in the a–b BTA29 interval (generat-ing fusions a–D and C–b; Fig. 3).
Using the genomic coordinates of the clustered mate pairs, we designed primer sets to amplify the three corresponding fusion points. Productive amplification was only achieved using genomic DNA from colour-sided Belgian blue animals, as expected (Supplementary Fig. 3A). We sequenced the corresponding PCR products to define the break-points at single-nucleotide resolution. The E–A fusion was characterized by 2 bp micro-homology typical of non-homologous end joining (NHEJ)
(Supplementary Fig. 4A), whereas the a–D and C–b fusions exhibited micro-duplications and micro-deletions reminiscent of replication-dependent microhomology-mediated break-induced replication (MMBIR) (Supplementary Fig. 4B)9. All breakpoints mapped to interspersed
non-homologous repeat elements (data not shown).
The dominance of the Cs allele is expected to reflect a gain of function resulting from dysregulated expression of the translocated KIT gene. To verify the transcriptional competence of the translocated
1 3 5 7 9 11 13 15 17 19 21 23 25 2729 1 1 1 1 333333333333333333333 5555555555555555555555555555 77777777777777777777777 9999999999999999999999 11111111111111111111 131313131113113113113131333333333 1515151151515151151511515151555555551717171171717111717117171777777191919191919191911191919199999999222222222212222221212122222121222 22322223232323232223232223232322323223232222232252525252525252525252525225252522522225252555222227227222722222227227272272272727777777777777777777777777777777777722929229292929292929292922922929222922229229999 BTA6:72–73.6 Mb BTA6:72–73.6 Mb a b c d 72 72.2 72.4 72.6 72.8 73 73.2 73.4 73.6 1 0.8 0.6 0.4 0.2 0 –0.2 –0.4 –0.6 1.8 1.5 1.2 0.9 0.6 0.3 0 1 3 5 7 9 11 13 15 17 19 21 23 25 2729 72 72.2 72.4 72.6 72.8 73 73.2 73.4 73.6 1 0.8 0.6 0.4 0.2 0 –0.2 –0.4 –0.6 1 0.8 0.6 0.4 0.2 0 Belgian Blue Cs/+ BTA29 Log(1/ P ) Log R ratio Log 2 ratio Chromosome number B allele fr equency KIT KIT KIT
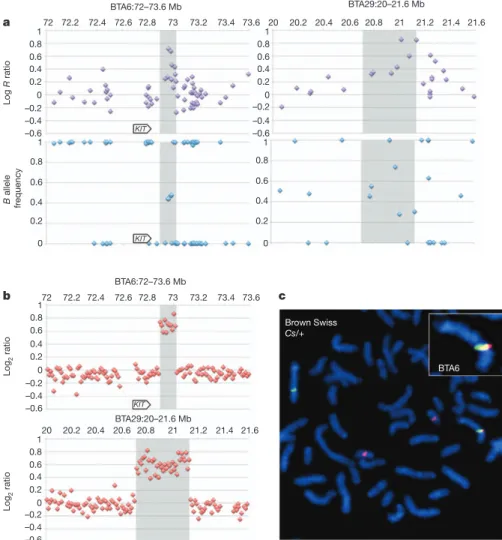
Figure 2|Identification and mapping of the colour-sided locus in the Belgian blue. a, Genome-wide association mapping using ASSDOM (see Methods), revealing a genome-wide significant association (P , 0.03) on BTA29 (black arrow) and suggestive association on BTA6 (grey arrow). Vertical lines separate chromosomes. b, Detection of a duplication on the BTA6 segment shared by 21 colour-sided Belgian blue animals using 50K SNP array
data3and PennCNV3. c, Confirmation and boundary definition using CGH on
a Nimblegen bovine tiling array. Shaded areas in b and c mark the boundaries of the CNV as defined by CGH. d, Demonstration by FISH of the translocation of a KIT-encompassing BTA6 segment onto BTA29 in a heterozygous Cs/1 Belgian blue animal. Magnification, 3100.
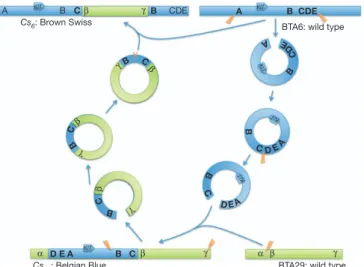
A B C B CDE D E A B C A B CDE A C E A C D E A C D E B C B C
BTA29: wild type BTA6: wild type
Cs29: Belgian Blue Cs6: Brown Swiss KIT KIT KIT KIT KIT KIT B X C D B B B β γ β γ β γ β γ α β γ α β γ
Figure 3|Model for the generation of the colour-sidedCs29andCs6alleles
by serial translocation via circular shuttling intermediates.
KIT copy, we performed polymerase chain reaction with reverse tran-scription (RT–PCR) experiments using amplicons spanning two SNPs: the ss469414206 G-to-A transition in intron 1, and the ss469414207 C-to-T transition in intron 7. We extracted total RNA from pigmented and unpigmented skin sectors of a Cs/1 colour-sided Belgian blue animal with the GG genotype on BTA6 and the A geno-type on BTA29 ((GG)6/A29) for ss469414206 and the (CC)6/T29
geno-type for ss469414207. The resulting pre-mRNA-dependent RT–PCR products were directly sequenced and the ratio of T/C and A/G species was estimated using Peakpicker10. T/A transcripts accounted for
,33% of the KIT output in both pigmented and unpigmented sectors, demonstrating the transcriptional potential of the translocated gene copy. Long-range RT–PCR analysis of the near complete KIT mRNA with primers located respectively in exon 1 and the 39 untranslated region (UTR) followed by amplicon sequencing did not show evidence for alternate transcripts in colour-sided animals (Supplementary Fig. 5). Linkage analysis performed in a brown Swiss pedigree segregating for colour sidedness with microsatellite markers targeting candidate genes (KIT, KITL, MITF, EDNRB, ADAMTS20), yielded a log of odds (lod) score of 6.9 maximizing in the immediate vicinity of the KIT locus (Supplementary Table 1). We genotyped four colour-sided (three Cs/Cs and one Cs/1), and five control brown Swiss animals using a 50K SNP array3. Colour-sided Cs/Cs brown Swiss animals
indeed shared a 2.0 Mb autozygous haplotype encompassing the KIT locus. At first glance, these findings suggested a distinct determinism of colour sidedness in Belgian blue and brown Swiss.
We analysed the corresponding SNP genotypes with PennCNV and performed CGH using genomic DNA from brown Swiss Cs/Cs versus 1/1 animals. This revealed the duplication of a ,120-kb BTA6 seg-ment nested in the Belgian blue duplication, but excluding the KIT
gene. Intriguingly, it also revealed the duplication of a ,418-kb BTA29 segment immediately flanking the Belgian blue insertion site and encompassing the last four of twelve LUZP2 exons (b–c; Fig. 4a, b). Moreover, fusion point C–b (but not a–C and D–A), specifying the Belgian blue Cs allele, could be amplified by PCR from genomic DNA of all examined brown Swiss colour-sided but not control animals (Supplementary Fig. 3). These findings established a clear link between the Belgian blue and brown Swiss Cs alleles.
We performed FISH analysis on lymphocytes of a Cs/1 brown Swiss animal using BTA6 and BTA29 BAC clones. Remarkably, we observed overlapping red and green signals on one of the BTA6 homo-logues, hence revealing the translocation of a BTA29 fragment on BTA6 (Fig. 4c). We generated mate-pair libraries from self-ligated ,5-kb and ,2-kb DNA fragments of a brown Swiss Cs/Cs animal and generated ,15 Gb of sequence on an Illumina GAIIx instrument (Supplementary Fig. 2). Analysis of the resulting sequence traces revealed two aberrant mate-pair clusters. The first corresponds to the Belgian blue C–b fusion point, previously detected by PCR. The second corresponds to a novel B–c fusion point (Supplementary Fig. 2). The most parsimonious explanation accounting for all the data is that the brown Swiss Cs allele derives from the Belgian blue Cs allele by (1) excision of the B-C-b-c fragment from the Belgian blue Cs allele on BTA29, (2) circularization, and (3) re-integration in the wild-type KIT locus by homologous recombination. This would result in a novel Cs allele mapping to the KIT locus and characterized by tandem duplicates of the B–C segment flanking the translocated b–c BTA29 fragment (A-B-C-b-c-B–C-D-E; Fig. 3).
Our model predicts that the C and B BTA6 segments immediately flanking b–c carry the same haplotype as the Cs-allele of Belgian blue. To test this, we developed long-range PCR assays that would specifically
BTA6 Brown Swiss Cs/+ BTA6:72–73.6 Mb Log 2 ratio Log 2 ratio BTA29:20–21.6 Mb 1 0.8 0.6 0.4 0.2 0 –0.2 –0.4 –0.6 B allele fr equency Log R ratio BTA6:72–73.6 Mb BTA29:20–21.6 Mb c b a 72 72.2 72.4 72.6 72.8 73 73.2 73.4 73.6 1 0.8 0.6 0.4 0.2 0 –0.2 –0.4 –0.6 20 20.2 20.4 20.6 20.8 21 21.2 21.4 21.6 1 0.8 0.6 0.4 0.2 0 1 0.8 0.6 0.4 0.2 0 72 72.2 72.4 72.6 72.8 73 73.2 73.4 73.6 20 20.2 20.4 20.6 20.8 21 21.2 21.4 21.6 1 0.8 0.6 0.4 0.2 0 –0.2 –0.4 –0.6 1 0.8 0.6 0.4 0.2 0 –0.2 –0.4 –0.6 KIT KIT KIT
Figure 4|Identification and mapping of the colour-sided locus in brown Swiss animals. a, PennCNV evidence for BTA6 and BTA29 duplications in brown Swiss colour-sided animals. The slightly different distribution of BTA6 SNPs when compared to Fig. 2 is due to the use of a different version of the 50K SNP array1.
b, Confirmation and boundary definition of the Cs-associated BTA6 and BTA29 duplication in brown Swiss animals using CGH on Nimblegen bovine tiling arrays. The shaded areas in a and b mark the boundaries of the CNV, as defined by CGH. c, Demonstration by FISH of the translocation of a BTA29 segment onto BTA6 in a heterozygous Cs/ 1brown Swiss animal.
amplify B, C, B and C segments from genomic DNA of a Cs/Cs brown Swiss animal, and—by sequencing the corresponding amplicons— determined the genotype of B and B and C and C for four SNP posi-tions heterozygous in the high-throughput sequence reads of the brown Swiss Cs/Cs animal. We then determined the genotype of the Belgian blue Cs allele for the corresponding variants and showed that it matched the C and B segments of the brown Swiss Cs allele, in agree-ment with our model of homologous-recombination-dependent reso-lution of the circular intermediate (Fig. 3 and Supplementary Fig. 6). Using the mate-pair genomic coordinates, we designed primer pairs to amplify the c–B fusion point. As expected, productive amplification was only achieved using genomic DNA from colour-sided brown Swiss animals (Supplementary Fig. 3). We sequenced the correspond-ing PCR products to define the breakpoints at scorrespond-ingle-nucleotide reso-lution. The c–B fusion presented hallmarks typical of microhomology mediated break induced replication (MMBIR) (Supplementary Fig. 4). We obtained genomic DNA from colour-sided animals from seven additional cattle breeds and domestic yaks (Supplementary Fig. 7), which we tested by PCR for the presence of the two Belgian-blue-specific fusion points (E–A, a–D), the brown-Swiss-Belgian-blue-specific fusion point (c–B), and the Belgian blue/brown Swiss shared fusion point (C–b). Colour-sided Dutch witrik and Ethiopian fogera animals were shown to carry the Belgian blue Cs allele (Cs29), Austrian pustertaler
sprinzen, Czech red-spotted cattle and French vosgienne the brown Swiss Cs allele (Cs6), and Irish moiled, Swedish mountain and domestic
yak carried both the Cs29and Cs6alleles (Supplementary Fig. 3). We
assume that Cs29and Cs6alleles were introgressed in yak after
domestica-tion via well-documented hybridizadomestica-tion of Bos taurus and Bos grunniens. These findings indicate that the Cs29and Cs6alleles account for most if
not all colour sidedness in cattle.
Analysis of colour sidedness has revealed a novel CNV-generating translocation mechanism involving circular intermediates. Whether this is a bovine idiosyncrasy or a more common mechanism remains to be determined. That some CNVs reflect translocation events is well established. As an example, 75 probable dispersed duplications in the human genome have been reported11, as well as at least four
interchro-mosomal duplications12,13. We ourselves performed genome-wide
association mapping between the SNP and CNV genotype in human and cattle, and observed 21 and 4 putative ‘trans-associations’ (that is, non-syntenic CNV-defining SNPs and associated SNPs), respectively (Supplementary Material). Some of these dispersed duplications might involve circular intermediates. In support of the occurrence of other instances involving circular intermediates are recent observations of repeated translocation of five clustered ORFs in wine and bioethanol strains of Saccharomyces cerevisiae, apparently via resolution of circular intermediates14. The same mechanism may contribute to somatic
muta-tions in tumours. Indeed, episomes with the NUP214–ABL1 fusion gene (observed in ,6% of T-cell acute lymphoblastic leukaemia) have been proposed to result from circularization and excision of a chromosome 9 segment bounded by the NUP214 and ABL1 genes, and to reintegrate ectopically by the same resolving mechanism proposed for colour sidedness in at least some patients15. The repatriation of exogenous
sequences (including exons) back to the original chromosomal location via circular ‘shuttling’ intermediates suggests that this mechanism might underlie a specific mode of exon shuffling.
METHODS SUMMARY
A custom 50K SNP array3was used to genotype 21 colour-sided and 30 control Belgian blue animals. The genome of colour-sided animals was scanned for a shared haplotype using the ASSDOM software. In the brown Swiss, microsatellites adjacent to five candidate genes were genotyped in three half-sibling families and two point linkage calculated using the Merlin software16. CNVs were identified in the 50K SNP array data using the PennCNV software5. Array CGH was carried out on a custom 2.1 M oligonucleotide array (Roche-Nimblegen) with a non-colour-sided Belgian blue used as the reference in each hybridization. Metaphase spreads
were generated from short-term lymphocyte cultures. BACs from the duplicated regions on BTA6 and BTA29 were identified using end sequences from the bovine RPCI42 BAC library. BACs were labelled with the appropriate fluorochrome by nick translation (Abbott Molecular), hybridized to the metaphase spreads and examined by fluorescent microscopy. Mate-pair libraries were generated using the Illumina mate-pair library kit v.2 for a Cs/Cs Belgian blue and a Cs/Cs brown Swiss animal. A paired-end library was also generated for a Cs/1 Belgian blue using the Illumina paired-end kit. Sequencing was carried out on an Illumina GAIIx instrument. PCR products spanning regions of interest were purified using QIAquick PCR purification kit (Qiagen), sequenced using Big Dye terminator cycle-sequencing kit v.3.1 (Applied Biosystems) and run on an ABI PRISM 3730 DNA analyser (Applied Biosystems). RNA was extracted form skin using the RNeasy fibrous tissue mini kit (Qiagen) and cDNA was synthesized using SuperScript II first-strand Synthesis SuperMix (Invitrogen). Long-range PCR was carried out using the Expand Long Template PCR System (Roche). Full Methods and any associated references are available in the online version of the paper at www.nature.com/nature.
Received 4 September; accepted 5 December 2011.
1. Olson, T. The Genetics of Cattle (CAB International, 1999).
2. Porter, V. & Mason, I. L. Mason’s World Dictionary of Livestock Breeds, Types, and Varieties (CAB International, 2002).
3. Charlier, C. et al. Highly effective SNP-based association mapping and management of recessive defects in livestock. Nature Genet.40, 449–454 (2008). 4. Charlier, C. et al. Microsatellite mapping of the bovine roan locus: a major
determinant of white heifer disease. Mamm. Genome7, 138–142 (1996). 5. Wang, K. et al. PennCNV: an integrated hidden Markov model designed for
high-resolution copy number variation detection in whole-genome SNP genotyping data. Genome Res.17, 1665–1674 (2007).
6. Yoshida, H. et al. Melanocyte migration and survival controlled by SCF/c-kit expression. J. Investig. Dermatol. Symp. Proc.6, 1–5 (2001).
7. Brooks, S. A. et al. A chromosome inversion near the KIT gene and the Tobiano spotting pattern in horses. Cytogenet. Genome Res.119, 225–230 (2007). 8. Marklund, S. et al. Molecular basis for the dominant white phenotype in the
domestic pig. Genome Res.8, 826–833 (1998).
9. Hastings, P. J., Lupski, J. R., Rosenberg, S. M. & Ira, G. Mechansisms of change in gene copy number. Nature Rev. Genet.10, 551–564 (2009).
10. Ge, B. et al. Survey of allelic expression using EST mining. Genome Res.15, 1584–1591 (2005).
11. Conrad, D. F. et al. Origins and functional impact of copy number variation in the human genome. Nature464, 704–712 (2010).
12. Liu, G. E. et al. Analysis of copy number variations among diverse cattle breeds. Genome Res.20, 693–703 (2010).
13. Liu, G. E. et al. Analysis of recent segmental duplications in the bovine genome. BMC Genomics10, 571 (2009).
14. Borneman, A. R. et al. Whole-genome comparison reveals novel genetic elements that characterize the genome of industrial strains of Saccharomyces cerevisiae. PLoS Genet.7, e1001287 (2011).
15. Graux, C. et al. Heterogeneous patterns of amplification of the NUP214-ABL1 fusion gene in T-cell acute lymphoblastic. Leukemia23, 125–133 (2009). 16. Abecasis, G. et al. Merlin-rapid analysis of dense genetic maps using sparse gene
flow trees. Nature Genet.30, 97–101 (2002).
Supplementary Information is linked to the online version of the paper at www.nature.com/nature.
Acknowledgements This work was funded by the Walloon Direction General Operationnelle Agriculture, Resources Naturelles et Environnement (grants D31-1206 and D31-1214) and the Swiss National Science Foundation (grant 31003A_133034 to T.L.). We are grateful for the support of the GIGA-R Genomics platform, to P. Melvin, to G. Mekuriaw and staff of the Andassa livestock research center, Viking Genetics, Swissgenetics and the Schweizer Braunviehzuchtverband for their assistance in sample collection, to J. Vermeesch and B. Nowakowska for their assistance with array CGH.
Author Contributions K.D. performed the PennCNV, CGH, FISH, next-generation sequencing, breakpoint, DNA sequence variant and expression analyses. W.C. performed the bioinformatic analyses of the high-throughput sequencing reads. A.H., P.H., L.H., K.O., A.S., J.S. and H.S. provided samples from colour-sided animals. C.D., S.M. and S.R. performed linkage analyses in brown Swiss animals. T.L. supervised the work in Switzerland. C.C., M.G., T.D. and Z.Z. performed the association analyses. N.A. and N.C. performed SNP genotyping. C.F. and L.K. performed amplicon sequencing. Y.K., M.L. and D.Z. provided human CNV genotype data. K.D., M.G. and C.C. analysed data and wrote the manuscript.
Author Information Reprints and permissions information is available at www.nature.com/reprints. The authors declare no competing financial interests. Readers are welcome to comment on the online version of this article at www.nature.com/nature. Correspondence and requests for materials should be addressed to M.G. ([email protected]).
METHODS
Association and linkage mapping of the colour-sided locus.SNP genotyping was conducted using custom-made 50K Infinium SNP arrays3used according to the instructions of the manufacturer. Microsatellite genotyping was conducted as previously described17. Association analysis was conducted using ASSDOM. ASSDOM searches for chromosome segments devoid of SNPs for which cases have alternate homozygous genotype (say 11 versus 22), excluding the sharing of an identical-by-descent (single-copy) haplotype. Intervals bounded by such excluding SNPs receive a score corresponding to Xki~1log(1{p2
i) n
, where pi
is the frequency of the allele missing among n cases, estimated in m controls. The genome-wide statistical significance of the ‘non-exclusion’ signal is determined by phenotype permutation of the disease status between the n cases and m controls. Two-point linkage analyses were conducted with Merlin16.
Prediction of CNVs from SNP genotype data.The log R ratio signal intensity and B allele frequency from a custom 50K SNP array3were obtained using Illumina BeadStudio software. PennCNV, a hidden Markov model based approach that takes into account signal intensity, allelic intensity ratio, distance between markers and allele frequency5was used to call CNVs. Regions of the genome that showed evidence of copy number change were inspected in greater detail. Plots of log R ratio and B allele frequency were examined in BeadStudio (Illumina) and the region checked in the University of California, Santa Cruz (UCSC) genome browser (http://genome.ucsc.edu/).
Detection of CNVs by CGH.Array CGH was carried out on a custom 2.1 M oligonucleotide array (Roche-Nimblegen) based on the UMD 3.0 bovine assembly. The array contained 2,152,422 probes (50–75 mers) with a median spacing of 1,160 bp. The reference animal used in hybridizations was a non-colour-sided Belgian blue. Genomic DNA labelling (Cy3 for sample and Cy5 reference), hybridization and washing were performed according to the manufacturer’s instruc-tions and have been described elsewhere18. Slides were scanned using a GenePix 4000B 5 mm microarray scanner (Axon Instruments). Images were processed using NimbleScan software (Roche-Nimblegen). Spatial correction was applied and data normalized19, segmentation was performed using the DNACopy algorithm20. The log2ratios for each oligonucleotide were also examined visually for evidence of a
change in copy number in regions of interest.
FISH.Peripheral blood was obtained from colour-sided and wild-type Belgian blue and brown Swiss animals. Pokeweed-stimulated lymphocyte cultures were established and chromosome spreads prepared for colour-sided and wild-type animals in each breed following standard cytogenetic procedures. End sequences from the RPCI42 bovine BAC library and the duplicated regions on BTA6 and BTA29 in the colour-sided Belgian blue and brown Swiss were downloaded from the National Center for Biotechnology Information (NCBI; http://www.ncbi.nlm. nih.gov/). BLAST was used to identify end sequences located in the duplicated regions. The BACs 160M9 and 156I13 overlap and cover the region chr6:72,566,605–72,817,995 (bosTau4), while the BACs 37P11 and 116G8 also overlap and cover the region chr29:20,772,406–21,035,251 (bosTau4). BAC clones were initially cultured at 37uC in 1 ml of 2YT media containing 30 ml ml21
chloramphenicol. The cultures were plated on lysogeny broth (LB) agar plats with 30 ml ml21chloramphenicol to obtain single colonies, the identity of the BACs was
confirmed by PCR using primers designed within the area encompassed by the respective BAC (Supplementary Table 2). The positive clones were then used to inoculate 100 ml of 2YT media with 30 ml ml21chloramphenicol. Following 24 h
at 37uC with constant agitation, DNA was extracted using the Qiagen midiprep kit, following the manufacturer’s instructions. The DNA was labelled with the nick translation kit from Abbott Molecular, using the manufactures protocol. DNA from BACs 160M9 and 156I13 was mixed and labelled with spectrum green (Abbott Molecular) while 37P11 and 116G8 were mixed and labelled with spectrum orange (Abbott Molecular). Labelled DNA (100 ng) was combined with 1 mg of bovine Cot-1 DNA and 2 mg of bovine genomic DNA, precipitated then re-suspended in 3 ml of purified water and 7 ml of hybridization buffer (Abbott Molecular). The separate probes were denatured at 73uC for 5 min and then combined on a slide containing metaphase spreads. These slides had been dena-tured in 70% formamide in 23 SSC at 75uC for 5 min followed by dehydration in ethanol. A coverslip was secured with rubber cement and the slide incubated overnight at 37uC in a humidified chamber. Slides were then washed in 0.43 SSC/0.3% Tween-20 at 73uC for 1–3 s followed by washing in 23 SSC/0.1% Tween-20 at room temperature (,18uC) for 1–3 s and air dried. The slides were counterstained with DAPI II (Abbott Molecular) and visualized by fluorescent microscopy.
Next-generation sequencing of mate-pair and paired-end libraries.Mate-pair libraries with different insert sizes were generated using the Illumina mate-pair library kit, v.2. The manufacturer’s instructions were followed except for the step involving fragmentation of the circularized DNA, for which a bioruptor sonicator
UCD-200 (Diagenode) was used. The 300 ml sample was placed in a 1.5 ml Eppendorf tube and sonicated for 8 min with the instrument set to high and a cycle of 30 s on and 30 s off. A 5-kb insert library was generated for a Cs/Cs Belgian blue animal and a 2-kb and 5-kb for a Cs/Cs brown Swiss animal. A paired-end library with a 400 bp insert size was also generated for a Cs/1 Belgian blue animal using the Illumina paired-end kit, following the instructions of the manufacturer. The result-ing libraries were quantified usresult-ing Pico-Green (Quant-it, Invitrogen) and the Agilent 2100 Bioanalyzer High Sensitivity DNA kit (Agilent Technologies). Sequencing was carried out on an Illumina GAIIx instrument. Mapping of the 36 bp from each end of the mate-pair libraries and the 110 bp from the ends of the paired-end library was performed using the BWA tool21. Breakpoints were identified by visually inspecting the mate pairs using the integrative genomics viewer22 in the ,2-Mb region surrounding the Cs-specific duplications in Belgian blue and brown Swiss animals and looking for discordant mate pairs. PCR amplification of translocation breakpoints.PCR primers were designed to span each of the breakpoints identified by mate-pair sequencing. The primers were tested on genomic DNA from colour-sided and wild-type animals. PCR products were visualized on a 2% agarose gel. Primers with amplification confined to colour-sided animals were purified using the QIAquick PCR purification kit (Qiagen), where multiple bands were observed the relevant band was excised and purified using the QIAquick gel extraction kit (Qiagen). The fragments were then sequenced using Big Dye terminator cycle-sequencing kit v.3.1 (Applied Biosystems) with the purified reaction run on a ABI PRISM 3730 DNA analyser (Applied Biosystems). Primers used are listed in Supplementary Table 2. Analysis ofCs29-derivedKITtranscripts.To ensure that no mutations were
present in the coding sequence of the Cs29-specific KIT gene, primers were
designed to amplify all the exons and the 39 UTR from genomic DNA (Supplementary Table 2). The resulting PCR products were sequenced as outlined above, which did not reveal any protein altering DNA sequence variant. To examine expression of KIT from the Cs29allele, a small biopsy of skin was removed from the
back (white skin) and side (pigmented skin) of a colour-sided Belgian blue animal (the relevant ethical procedures were adhered to). The samples were immediately frozen in liquid nitrogen and stored at 280uC until RNA extraction. The tissue was homogenized using a Tissue Lyser (Qiagen), total RNA was extracted using the RNeasy fibrous tissue mini kit (Qiagen), following the manufacturer’s instructions. First-strand cDNA was synthesized using SuperScript II first-strand Synthesis SuperMix (Invitrogen) with a mixture of random hexamers and oligo(dT) primers. Genomic DNA was extracted from whole blood from the same animal using standard phenol-chloroform extraction. The intronic regions of the KIT gene were searched for SNPs using the mate-pair sequences produced from the Cs/Cs Belgian blue animal. Primers were designed around suitable SNPs and sequenced in the tissue donor. To establish the genotype of the Cs29allele, multiple colour-sided
animals were sequenced. For SNP ss469414207 (C/T) 40 colour-sided animals were sequenced. For all Cs/Cs animals, the C and T alleles had equal peak height, while in the remaining Cs/1 animals the T allele produced the smaller peak. Additionally seven non colour-sided Belgian blue animals were also sequenced and none possessed the T allele. For SNP ss469414206 (G/A), two Cs/Cs and three Cs/1 animals were sequenced and showed a pattern of peak heights consistent with the Cs29allele having the A genotype. To determine if the Cs29allele was expressed,
the cDNA from the skin biopsies was amplified using primers spanning both SNPs and sequenced as outlined above. Moreover, and to ensure the integrity of Cs29
-derived KIT transcripts, primers located in the first exon and the 39 UTR (Supplementary Table 2) were used with the Expand Long Template PCR System (Roche) to amplify the near full-length KIT cDNA. The product was run on 1% gel and examined for evidence of alternative splicing.
Genotyping the duplicated B and C segments of theCs6allele.Long-range PCR
was carried out using the Expand Long Template PCR System (Roche). The genomic DNA used as template was extracted using QIAamp DNA Mini columns (Qiagen) following the manufacturer’s instructions to produce high molecular weight DNA. For each reaction the following mix was prepared: 2 ml Buffer 1, 140 mM dNTP, 120 nM upstream and downstream primer, 0.3 ml enzyme mix and 100 ng genomic DNA, final volume was 20 ml. Extension time and the thermal profile recommended by the manufacturer was followed. Following 30 cycles 10 ml of the product was run on a 0.8% agarose gel to check for amplification, the remaining reaction mix was retained. The PCR primers spanning the relevant SNP where then used in a conventional PCR reaction using between 0.1 and 0.5 ml (amount determined by intensity of band) of the long-range product as template. When long-range PCR product was used as template the number of cycles was reduced to 20. Clean-up and sequencing was carried out as outlined above. Used primers are reported in Supplementary Table 2.
17. Dro¨gemu¨ller, C. et al. Genetic mapping of the belt pattern in Brown Swiss cattle to BTA3. Anim. Genet.40, 225–229 (2009).
18. Selzer, R. et al. Analysis of chromosome breakpoints in neuroblastoma at sub-kilobase resolution using fine-tiling oligonucleotide array CGH. Genes Chromosom. Cancer44, 305–319 (2005).
19. Workman, C. et al. A new non-linear normalization method for reducing variability in DNA microarray experiments. Genome Biol.3, 0048 (2002).
20. Olshen, A. et al. Circular binary segmentation for the analysis of array-based DNA copy number data. Biostatistics5, 557–572 (2004).
21. Li, H. & Durbin, R. Fast and accurate short read alignment with Burrows–Wheeler transform. Bioinformatics25, 1754–1760 (2009).
22. James, T. et al. Integrative genomics viewer. Nature Biotechnol.29, 24–26 (2011).