HAL Id: hal-01660806
https://hal-univ-rennes1.archives-ouvertes.fr/hal-01660806
Submitted on 11 Dec 2017HAL is a multi-disciplinary open access archive for the deposit and dissemination of sci-entific research documents, whether they are pub-lished or not. The documents may come from teaching and research institutions in France or abroad, or from public or private research centers.
L’archive ouverte pluridisciplinaire HAL, est destinée au dépôt et à la diffusion de documents scientifiques de niveau recherche, publiés ou non, émanant des établissements d’enseignement et de recherche français ou étrangers, des laboratoires publics ou privés.
Population pharmacokinetics of oxcarbazepine and its
monohydroxy derivative in epileptic children
Christelle Rodrigues, Catherine Chiron, Elisabeth Rey, Olivier Dulac,
Emmanuelle Comets, Gérard Pons, Vincent Jullien
To cite this version:
Christelle Rodrigues, Catherine Chiron, Elisabeth Rey, Olivier Dulac, Emmanuelle Comets, et al.. Population pharmacokinetics of oxcarbazepine and its monohydroxy derivative in epileptic children. British Journal of Clinical Pharmacology, Wiley, 2017, 83 (12), pp.2695 - 2708. �10.1111/bcp.13392�. �hal-01660806�
This article has been accepted for publication and undergone full peer review but has not been through the copyediting, typesetting, pagination and proofreading process which may lead to differences between this version and the Version of Record. Please cite this article as doi: 10.1111/bcp.13392
Title: Population pharmacokinetics of oxcarbazepine and its monohydroxy derivative in
epileptic children
Running head: Population pharmacokinetics of oxcarbazepine in epileptic children
Authors
Christelle Rodrigues1, Catherine Chiron1, Elisabeth Rey1, Olivier Dulac1, Emmanuelle
Comets2, 3, Gérard Pons1, Vincent Jullien1, 4
1
INSERM U1129, Paris, France; Paris Descartes University; CEA, Gif-sur-Yvette, France
2
INSERM, IAME, UMR1137, Université Paris Diderot, Sorbonne Paris Cité, Paris, France
3
INSERM, CIC 1414, Université Rennes 1, Rennes, France
4
Service de Pharmacologie, Hôpital Européen Georges Pompidou, 20 rue Leblanc, 75015
Paris, France
Submitting author: Christelle RODRIGUES, christelle.spr@gmail.com
Corresponding author: Vincent JULLIEN, Service de Pharmacologie, Hôpital européen
Georges Pompidou, 20 rue Leblanc, 75015 Paris, France. Tel : +33 1 56 09 39 77
vincent.jullien@aphp.fr
Keywords: Childhood epilepsy, oxcarbazepine, MHD, population pharmacokinetics
Word count: 5216
Number of tables: 6
Conflict of interest
All authors have completed the United Competing Interest form at
http://www.icmje.org/conflicts-of-interest/ and declare: CR reports personal fees from BIOCODEX,
outside the submitted work; CC reports personal fees and non-financial support from BIOCODEX, personal fees
from BRABANT, personal fees from UCB-PHARMA, personal fees from BIAL, personal fees from
ZOGENIX, personal fees from VIROPHARMA, outside the submitted work; ER, OD, EC and GP had nothing
to disclose; VJ reports grants from BIOCODEX, personal fees from ZOGENIX, outside the submitted work. A
Summary
Aims: Oxcarbazepine is an antiepileptic drug with an activity mostly due to its monohydroxy
derivative metabolite (MHD). A parent-metabolite population pharmacokinetic model in
children was developed in order to evaluate the consistency between the recommended
pediatric doses and the reference range for trough concentration (Ctrough) of MHD (3-35
mg/L).
Methods: A total of 279 plasma samples were obtained from 31 epileptic children (2-12y)
after a single dose of oxcarbazepine. Concentration-time data were analyzed with Monolix
4.3.2. The probability to obtain Ctrough between 3-35 mg/L was determined by Monte Carlo
simulations for doses ranging from 10 to 90 mg/kg/day.
Results: A parent-metabolite model with two compartments for oxcarbazepine and one
compartment for MHD best described the data. Typical values for oxcarbazepine clearance,
central and peripheral distribution volume and distribution clearance were 140 L/h/70kg, 337
L/70kg, 60.7 L, and 62.5 L/h respectively. Typical values for MHD clearance and distribution
volume were 4.11 L/h/70kg and 54.8 L/70kg respectively. Clearances and distribution
volumes of oxcarbazepine and MHD were related to body weight via empirical allometric
models. Enzyme-inducing antiepileptic drugs (EIAEDs) increased MHD clearance by 29.3%.
Fifty kg children without EIAEDs may need 20-30 mg/kg/day instead of the recommended
target maintenance dose (30-45 mg/kg/day) to obtain Ctrough within the reference range. By
contrast, 10kg children with EIAEDs would need 90 mg/kg/day instead of the maximum
Conclusion: This population pharmacokinetic model of oxcarbazepine supports current dose
recommendations, except for 10kg children with concomitant EIAEDS and 50kg children
without EIAEDs.
What is already known about this subject?
Oxcarbazepine is an antiepileptic compound with an activity mainly due to its monohydroxy metabolite (Monohydroxy Derivative: MHD).
Enzyme inducing antiepileptic drugs increase the metabolism of both oxcarbazepine and MHD.
Younger children present a higher weight-normalized MHD clearance than older children.
What this study adds?
A new parent-metabolite population model of oxcarbazepine was developed.
10 kg children may need higher doses than recommended if they are taking concomitant enzyme inducing antiepileptic drugs.
50 kg children not taking any inducing co-medication may need lower doses than recommended.
Introduction
Oxcarbazepine (OXC) is an antiepileptic drug (AED) indicated for the treatment of partial
onset seizures, with or without secondary generalization, as monotherapy or in combination,
in adults and children from 2 or 6 years of age (in the US and EU respectively). It acts by
blocking voltage-gated sodium channels in excitatory glutamatergic neurons. This stabilizes
hyper-excited neuronal membranes and inhibits repeated neuronal firing and its spread. OXC
also modulates potassium and calcium activities, and reduces glutamatergic transmission [1].
Administered orally, OXC is well absorbed and rapidly and almost completely transformed in
its monohydroxy derivative (MHD), by cytosolic arylcetone reductases [2]. The formation of
MHD is enantioselective with a predominance of the (S)-enantiomer [3,4]. Despite this
difference in exposition (the ratio of the area under the curve (AUC) values of (S)-MHD over
(R)-MHD is 3,8 when OXC is administered orally [4]), other pharmacokinetic (PK)
parameters of the two enantiomers, such as the half-lives, are similar and they both present a
similar pharmacological activity [3,4]. In fact, MHD, as the sum of the two enantiomers, is
the main responsible for oxcarbazepine antiepileptic action and exposure to MHD is about 15
times higher than exposure to OXC [5]. MHD is principally eliminated by glucuronidation
(about 45%), by renal clearance (about 28%), and minor amounts are eliminated by
dihydroxylation leading to the formation of its dihydroxy derivative (DHD) [4,6]. An
equilibrium between OXC and MHD is established with the back-transformation of the
metabolite in its oxidized form [4].
For 4-16 years old children, it is recommended to start oxcarbazepine at 8-10 mg/kg/day,
divided into two intakes, and to increase it by 5 mg/kg/day every third day until reaching the
target maintenance dose of 30-45 mg/kg/day (900 mg/day for 20-29 kg children, 1200
children, recommendations indicate to initiate the medication at 16-20 mg/kg/day, divided
into two intakes, achieving maintenance dose over two to four weeks, not to exceed 60
mg/kg/day [1].
Therapeutic drug monitoring can be a tool for physicians to adapt the dose for each of their
patients. In 2008, ILAE Commission on Therapeutic Strategies created guidelines for the
therapeutic drug monitoring of antiepileptic drugs [7]. They concluded that the reference
range of MHD trough (Ctrough) concentrations should be 3-35 mg/L, since it corresponded to
trough concentrations of responding patients [7]. Indeed, it is well established that toxic
concentrations begin between 35-40 mg/L [8–10], and some studies have shown data of
responding children with MHD trough concentrations below 5 mg/L [11,12].
Factors accounting for pharmacokinetic variability of oxcarbazepine in children are age and
association with enzyme-inducing antiepileptic drugs (EIAEDs) [13]. It was demonstrated
that young children (2 to 5 years) presented a higher MHD clearance, so a shorter half-life
(30% lower), and that they required a greater dose per body weight [11]. Co-medication with
EIAEDs, such as carbamazepine, phenobarbital and phenytoin, were intensively investigated
and it was established that these drugs were able to induce MHD metabolism [14–17].
To date, OXC and MHD pharmacokinetics in children have only been studied partially by
non-compartmental approaches, that did not consider the continuous effect of age or body
weight [3–5,14,18–20]. Some studies investigated population pharmacokinetics in children
[15–17,21–24], modeling MHD directly from OXC administration. This method does not
allow to distinguish pharmacokinetic changes related to OXC transformation to MHD from
those related to MHD clearance. Thus, it does not permit a correct estimation of MHD
The aim of the present study was to develop a parent-metabolite population pharmacokinetic
model and to use this model to evaluate whether the recommended pediatric doses allow to
obtain Ctrough of MHD within the reference range (3-35 mg/L) for therapeutic drug
monitoring.
Materials and methods
Patients
This population analysis was performed using data collected for a previously published
ancillary pharmacokinetic (PK) study with a non-compartmental analysis of oxcarbazepine
and MHD [11]. The study included pediatric patients aged 2 to 12 years. Because the main
objective of the clinical trial was to evaluate the efficacy of OXC as add-on medication, only
children with inadequately controlled partial-onset and/or generalized atonic, tonic, or
tonic-clonic seizures were included. Thus patients were only eligible if they experienced at least
one seizure per week despite being treated by one to three AEDs that remained unchanged for
at least one month before inclusion into the study.
The exclusion criteria were as follows : (1) contraindications to treatment with
oxcarbazepine, such as atrioventricular disorders, blood pressure disorders or hypersensitivity
to carbamazepine or tricyclic antidepressants; (2) conditions likely to modify OXC
pharmacokinetics, such as renal or hepatic failure, untreated known hypothyroidism,
congenital metabolic diseases, abnormal body weight (more than two standard deviations),
concomitant medication with an enzyme inducing or inhibiting drug (except for AEDs),
alcoholism or drug abuse; (3) previous or current use of oxcarbazepine; and (4) no
Study design
Children were randomized to receive a single OXC dose of 5 or 15 mg/kg, administered as an
oral suspension after an overnight fast. Blood samples of 1 mL were collected into
heparinized tubes at baseline (before administration) and, approximately, 1, 2, 4, 6, 8, 12, 24,
36 and 48 hours after administration. Times of dosing and sampling were recorded, as were
the investigated covariates (age, body weight, sex, comedications). The samples were
centrifuged and the separated plasma was stored at -80°C until analysis.
Ethics
The study was conducted in accordance with the Declaration of Helsinki and their protocol
was approved by the ethical committee of Cochin, Saint-Vincent de Paul, and Saint-Anne
hospitals. Written informed consent was provided by a parent or legal guardian for all
participating children.
Analytical method
Total MHD and OXC were assayed in plasma samples using a previously reported
non-enantioselective high-performance liquid chromatography method [25]. (S) and (R)
enantiomers were consequently not distinguished. Precision and inaccuracy were below 15%.
The lower limits of quantification (LOQ) for OXC and MHD were 0.05 mg/L and 0.1 mg/L,
respectively.
Population pharmacokinetic model development
The population pharmacokinetic analysis was performed using a non-linear mixed-effect
Model development
Population parameters for oxcarbazepine and MHD were estimated using the stochastic
approximation expectation maximization (SAEM) algorithm. Data below the limit of
quantification (BLQ) were handled as left-censored data, by an extended SAEM algorithm
which simulate BLQ data with a right-truncated Gaussian distribution [26]. For each patient,
only the first BLQ was kept in the dataset and was taken into account in the estimation via the
CENS item in the database, corresponding to the M3 method [27].
For OXC, the structural PK models evaluated were composed by one, two or three
compartments, and the absorption phases were evaluated with first- or zero-order models,
with or without lag time. Based on previous results evidencing a bioavailability of OXC of
0.99, this parameter was fixed to 1[4]. For racemic MHD one- and two-compartment models
were tested. Based on previous results showing that no OXC was found unchanged in the
urine [4,28], it was assumed that all the parent was converted into MHD. Pre-systemic
metabolite formation was investigated with a non-physiological model where the dose enters
both parent and metabolite compartments with two independent absorption rate constants,
with and without dose apportionment [29]. Elimination of OXC was tested with first- or
zero-order models. Due to the linearity of MHD pharmacokinetics [6], its elimination was
assumed to be ruled by a first-order process. A back-transformation of MHD into OXC was
also tested, as it was evidenced that the enantiomers can be oxidized into the parent
compound [4].
Exponential models were used to describe inter-individual variability, as illustrated bellow
(Eq. 1):
Where θi is the estimated value of a parameter in an individual i, θTV is the typical value of
this parameter in the population and ηi is the individual deviation from this typical value, i e,
the inter-individual variability, that is assumed to be normally distributed with a mean of 0
and a variance of ω².
Additive, proportional and mixed residual error models were tested for each dependent
variable.
Covariate analysis
Demographic variables (weight, age and sex) and co-medication with enzyme inducing
antiepileptic drugs (EIAEDs), such as carbamazepine, phenobarbital and phenytoin, were
tested as potential covariates. First, variables were added one by one and were selected if
their addition was able to cause a significant drop of the log-likelihood (LL). Because the
reduction in LL follows a chi-square distribution, a decrease of 3.84 was considered
significant at the 5% level (p < 0.05, one degree of freedom). Once all the covariates were
tested, the significant ones were added to the model, obtaining the full model, and a backward
elimination was performed. Covariates were retained if their elimination resulted in an
augmentation greater than 6.63 (p < 0.01, one degree of freedom) of the LL. After all
non-significant covariates were removed, the final model was obtained.
The continuous covariates were included in the model using a power function equation (Eq.
2):
(Eq. 2)
where cov is the value of the covariate, covmedian is its median and θcov is the factor describing
For body weight, covmedian was fixed to the standard adult value of 70kg and several models
were tested:
1. θcov was empirically estimated
2. θcov was fixed to the theoretical values of 0.75 for clearance and to 1 for volume
3. two independents θcov were empirically estimated for children > 6 years and children
< 6 years, for MHD clearance
4. the body-weight dependent exponent (BDE) model was also tested for MHD
clearance [30]. In this model the allometric exponent changes in a sigmoidal fashion
with respect to bodyweight:
(Eq.3)
Where k0 is the value of the exponent at a theoretical bodyweight of 0 kg, kmax is the
maximum decrease of the exponent, k50 is the bodyweight at which 50 % of the
maximum decrease of the exponent is attained, and γ is the Hill coefficient.
In the case of theoretical allometry, age was additionally tested as a covariate in two different
ways: with Eq.2 and with a maturation function (Eq. 4):
(Eq. 4)
where γ represents the Hill coefficient and Age50 the age at which half of the maturation is
reached.
Categorical covariates (sex and EIAEDs) were incorporated using a similar model (Eq. 5), as
illustrated bellow:
(Eq. 5) where cov is 1 or 0 in the presence or absence of the covariate.
Comparison of the tested models
The possible difference between the empirical allometry model and the theory-based
allometry model was assessed by normalized prediction distribution errors (NPDE) and
prediction and variability corrected visual predictive checks (pvcVPC) against body weight.
These NPDE were realized with an add-on package on R [31] using 1000 simulation of the
dataset. pvcVPC were also performed using 1000 simulations with the design of the original
dataset and the investigated model using Perl-speaks for NONMEM ® (PsN,version 4.4.8;
SourceForge) [32].
External evaluation of the tested models and comparison with previous models
In order to evaluate the reliability of the investigated models, the steady-state MHD trough
concentrations reported in children by Li et al. [33] were compared to the population trough
concentrations predicted by the models for similar doses and body weights. In their study, Li
and colleagues collected blood samples from 52 children aged from 0.58 to 15 years, and
provided age, weight-normalized doses and individual MHD steady-state trough
concentrations for each child [33]. Since their paper did not provide any, body weights were
estimated using the Advanced Paediatric Life Support (APLS) manual formulae [34], which
are (2 x age in years) + 8 for 1 to 5 years old patients and (3 x age in years) + 7 for 6 to 12
years old children. Patients without concomitant medication and whose age was not included
in the 2 to 12 years interval were excluded from the analysis. Using these calculated body
weights and the corresponding doses, trough MHD concentrations at steady-state were
calculated using the empirical model, the theory-based allometry model, as well as previously
published population PK models [15–17,22]. Adequacy between actual and predicted
concentrations was investigated by calculating precision (RMSE) and bias (MPE) using the
where, COBS is the observed concentration and CPRED is the predicted concentration of the
subject i and n is the total number of subjects.
Evaluation of the final model
Lack of bias of the final model was investigated by visual inspection of goodness of fit curves
(population prediction (PRED) versus observed concentration (DV), individual weighted
residuals (IWRES) and NPDE versus PRED or time after administration).
Prediction-corrected visual predictive checks (pcVPC), stratified by the categorical covariate EIAED or
not, were also performed using 500 simulations of the original dataset.
Dose evaluation
Monte Carlo simulations were performed with NONMEM 7.3 using the final model in order
to obtain steady-state areas under the curve (AUC0-12) and steady-state trough concentrations
(Ctrough) of MHD, at different daily doses in a bid regimen. One thousand children per body
weight, dose and co-treatment were simulated. Investigated body weights were 10, 20, 30, 40
and 50 kg. Investigated doses were 10, 20, 25, 30, 40, 50, 60 and 90 mg/kg per day, divided
into two intakes. The presence or absence of EIAEDs was also explored. Then, for each
combination dose/body weight/co-medication, the probabilities to obtain steady-state Ctrough
within the reference range (3-35 mg/L) and to reach the toxicity threshold (>35 mg/L) [7]
Nomenclature of Targets and Ligands
Key protein targets and ligands in this article are hyperlinked to corresponding entries in
http://www.guidetopharmacology.org, the common portal for data from the IUPHAR/BPS
Guide to PHARMACOLOGY [35], and are permanently archived in the Concise Guide to
PHARMACOLOGY 2015/16 [36].
Results
Patient characteristics
Thirty-one children (13 girls and 18 boys) were included in the study, having a median
(range) age of 8.08 (2.25 – 12.5) years and a median (range) body weight of 23 (12.7 – 56)
kg. Of these children, fourteen received a dose of 5 mg/kg and seventeen received a dose of
15 mg/kg. Six patients were co-treated with one AED, nineteen with two AEDs and six with
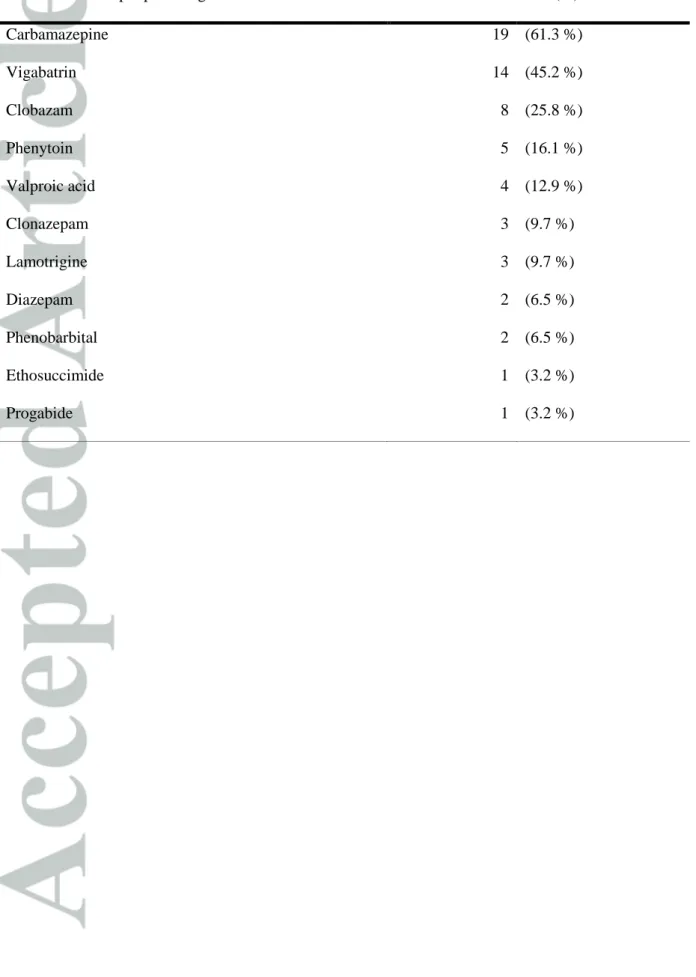
three AEDs. Concomitant AEDs are described in Table 1. Twenty-four of these patients were
co-medicated with at least one EIAED. These thirty-one patients provided 277 and 279
sampling points for OXC and MHD, respectively. Two OXC sampling points were discarded
because of analytical issues. Of these measured concentrations, 32% of OXC and 11.5% of
MHD observations were below the LOQ. After keeping only the first BLQ of each patient,
13.7% and 6.5% of the observations remained BLQ for OXC and MHD, respectively.
Population pharmacokinetic modelling
The best base model was a two-compartment model with first-order absorption (without
lag-time) and elimination for OXC, and a one compartment model with first-order elimination for
MHD. Taking into account the equilibrium between OXC and its metabolite MHD via a
constant representing the back-transformation of MHD into OXC improved the fit. The
structural parameters for this model were the absorption rate constant of OXC (Ka), the
bioavailability, and VpOXC/F), the apparent elimination and distribution clearances of OXC
(CLOXC/F, QOXC/F), the apparent elimination clearance of MHD (CLMHD/F), the apparent
volume of distribution of MHD (VcMHD/F), and the back-transformation constant rate (KBT)
of MHD into OXC. The fraction of oxcarbazepine metabolized to MHD (Fm) was fixed to 1
and it was assumed that OXC was completely eliminated via metabolic conversion to MHD.
The fraction of the dose that directly reached the metabolite compartment after oral
absorption was estimated to 5.4% with the first-pass effect model. However, this model was
not retained as it did not decrease significantly the LL. Inter-individual variability was
estimated for all the parameters, except Ka. The residual error model used was proportional
for OXC and combined for MHD.
The co-administration of EIAEDs was found to influence CLMHD/F but no influence was
found on CLOXC/F. Addition of body weight as a covariate on CLOXC/F, VcOXC/F, CLMHD/F
and VcMHD/F via an allometric function also significantly improved the fit with models 1 and
2. For model 3, where two separate allometric exponents for CLMHD depending on the child
age (over or under 6 years) were estimated, two very similar estimates were obtained for both
age range (0.498 for children >6y and 0.541 for children <6y) and both values were very
similar to the value obtained for the all population (0.549). The BDE model (model 4) on
CLMHD did not provide satisfying results (the -2LL increased and the parameters of the BDE
were poorly estimated). Estimated exponents (model 1) allowed a better fit of the data than
the theory-based allometric model (model 2), which was not improved by the addition of age
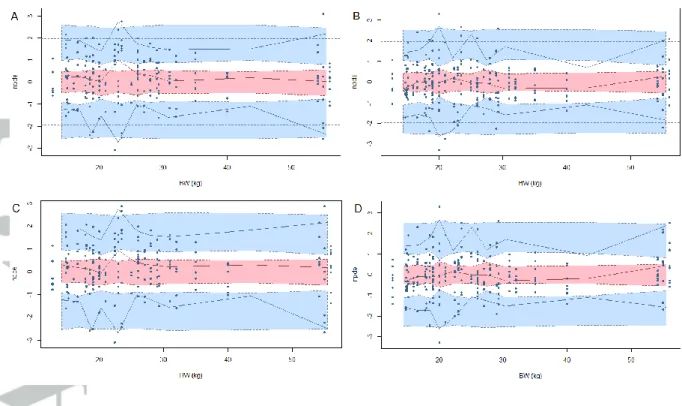
via an allometric function or a maturation function. NPDE versus body weight and pvcVPC
with body weight as the independent variable were performed for both models (with
empirical allometric exponents and with fixed theoretical allometric exponents) (Figures 1
and 2). No significant bias was observed for each model, showing that they both described
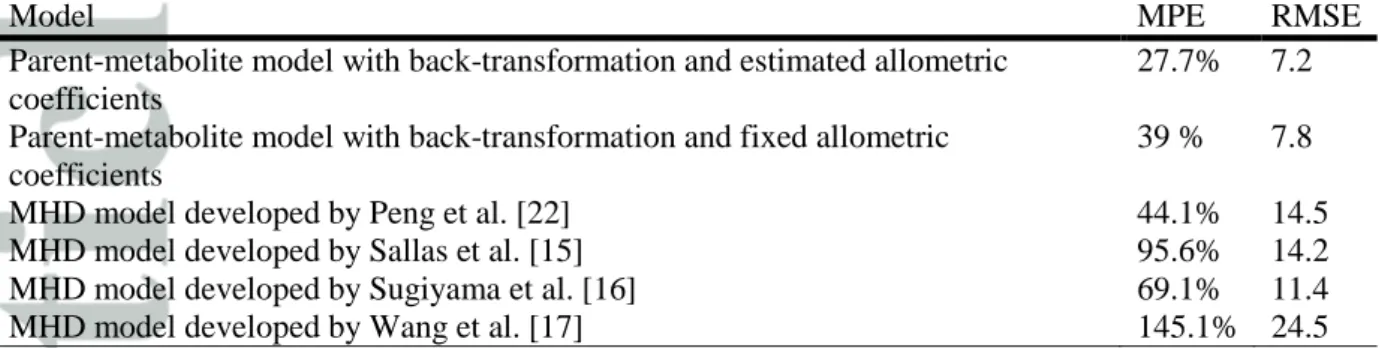
with estimated allometric exponents performed better on the external evaluation than the
model with fixed exponents, despite a slight over prediction of the concentrations. It also
performed better than formerly published models that included only MHD data (Table 2).
Thus, the empirical model was chosen as the final model and was considered reliable enough
to predict steady-state exposure of MHD.
The final model was then:
where MED is 0 or 1, if enzyme-inducing antiepileptic drugs were associated or not, and WT
is the patient body weight in kilograms.
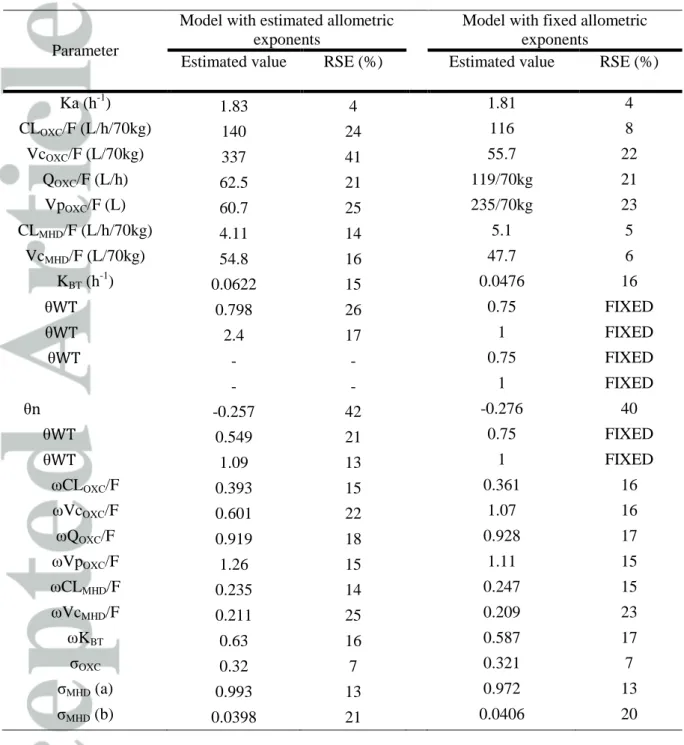
The estimated values of the parameters of the final model and of the theory-based allometry
model and their precisions are reported on Table 3.
No significant bias was observed on the plot of observed versus population prediction for
OXC and MHD (data not shown). For OXC, IWRES versus time or PRED did not present
any bias (data not shown), whereas a small bias was seen in NPDE versus time graph for time
intake is usually twice-a-day, it was considered that this bias would not penalize the
prediction of PK profiles, for a bid regimen, with the model. No bias was observed for all the
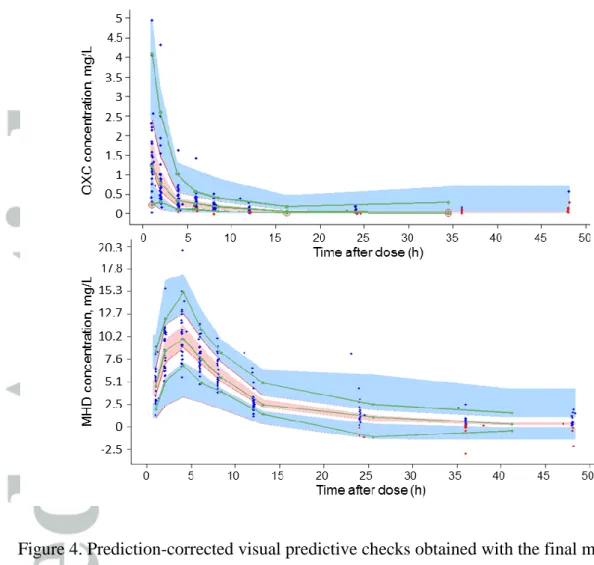
goodness of fit curves for MHD (Figure 3). pcVPC revealed no bias as the observed
concentrations were homogeneously distributed around the 50th percentile of simulated
concentrations (Figure 4). When stratified by the covariate EIAED, no bias was observed as
well (data no shown).
Dose Evaluation
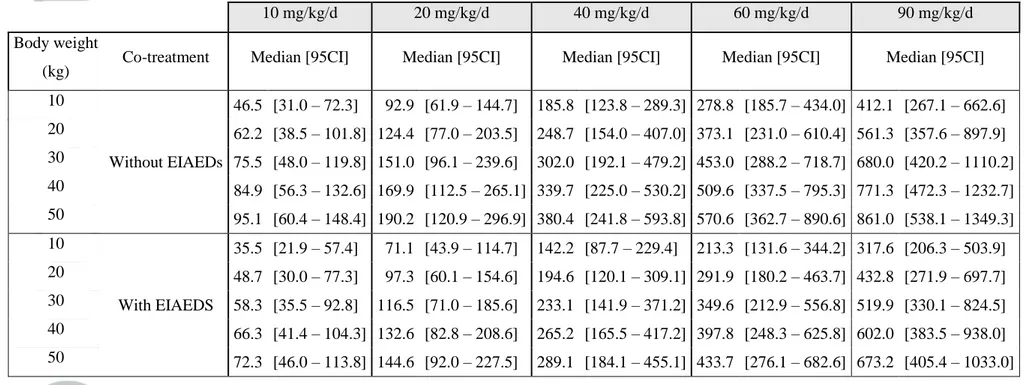
For a same dose, steady-state AUC0-12 of MHD increased with increasing body weight, and
was lower in patients taking EIAEDs than in those without concomitant EIAEDs (Table 4).
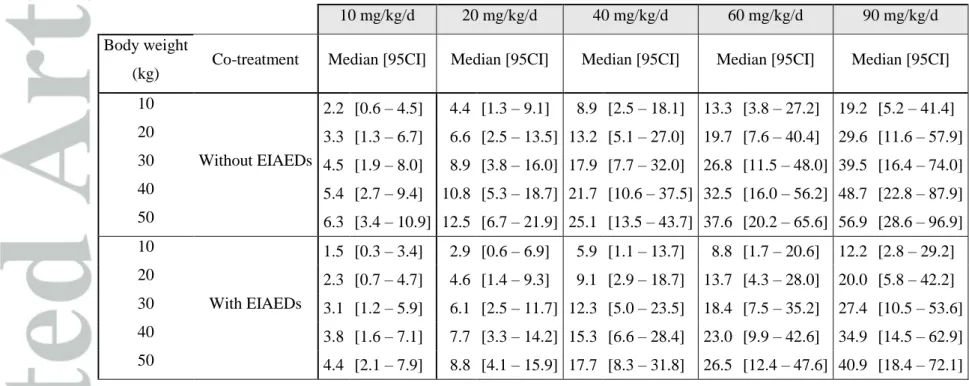
Similarly, MHD Ctrough increased too with body weight and dose, and its value was also lower
in patient co-treated with EIAEDs (Table 5).
For 10 kg children (i.e. children roughly 2 years old) without EIEADs, a probability > 95 %
to be within the 3-35 mg/L reference range for MHD Ctrough was obtained for 40-60 mg/kg
daily doses (Figure 5B), which is in agreement with current recommendations.
For children with body weights between 20 and 40 kg, and without EIAEDs, a probability >
95% was obtained with daily doses between 20 and 40 mg/kg (Figure 5B), which is also
consistent with current recommendations.
For 50 kg children without EIAEDs, a probability > 95% was obtained with daily doses
between 20 and 30 mg/kg (Figure 5B). Of note, these doses are inferior to the target
recommended maintenance dose of 30-45 mg/kg/day for 4-12 years old children. With such
doses, around 10 % of the patients would reach the 35 mg/L toxicity threshold (Figure 5D).
In case of combined treatment with EIAEDs, the probability of target attainment was lower,
children, who may need doses up to 90 mg/kg/day (Figure 5A), which is 50% above the
maximal recommended maintenance dose.
Discussion
This study was conducted with the aim to develop a parent-metabolite population model of
OXC and MHD in order to characterize the pharmacokinetic parameters of both compounds
and the covariates associated with their inter-individual variability. This model allows a
better understanding of MHD pharmacokinetics resulting from its formation from OXC and
its elimination and takes into account the back-transformation of MHD into its parent
compound. Previous population PK studies directly related OXC dose to MHD concentration,
without considering OXC concentration [15–17,21–24]. Such an approach can be supported
by the high bioavailability of OXC and the fact that OXC is almost completely converted into
MHD. However, since MHD concentration at a given time is the result of several
phenomenon (MHD formation from OXC, MHD elimination, and MHD back-transformation
to OXC), we believed a parent-metabolite model would allow a better prediction of the PK
profile of MHD. Based on the results of the external evaluation displayed on Table 2, it
appeared indeed that such a model provided a better prediction of MHD concentration at a
given time.
The present model could not take into account the pre-systemic transformation of OXC into
MHD [3], since the first-pass effect model investigated to describe this phenomenon [29] did
not improve the fit. In fact, estimating all PK parameters could not be possible with oral data
only and would require IV data as well [29,37]. However, a previous report determined that
the fraction of the administered oxcarbazepine dose pre-systemically converted to MHD was
only 6.5% (this fraction was estimated to 5.4% with our first-pass effect model), minimizing
A mean time to reach the maximum concentration (Tmax) of around 1h can be derived from
our mean PK estimates for OXC, which is in accordance with the value provided by Flesch et
al. [4]. OXC mean apparent weight-normalized clearance was 140 L/h/70kg. This value is in
accordance with the reported value of 170,1 L/h/70kg in adults after a single dose [39].
Concerning MHD, apparent weight-normalized clearances were 4.11 L/h/70kg for children
taking EIAEDs and 3.18 L/h/70kg for children not taking these medication. Those values are
in agreement with the results of Sallas et al. (3.2 L/h/70kg) [15]. Flesch et al. [4] reported an
absolute bioavailability of 99% after oral administration of OXC as well as a clearance of
3.5-5.5 L/h, for racemic MHD, in healthy volunteers after an intravenous administration of
MHD. Considering that the bioavailability is almost total, our estimates are in accordance
with these values.
MHD weight-normalized clearance decreased with increasing age (Figure 6). This was
already evidenced in the non-compartmental study from Rey et al. [10] and some population
approaches [15,16]. This phenomenon is frequent in children, and was already observed for
other antiepileptic drugs like clobazam [40], carbamazepine [41], phenobarbital [42],
felbamate [43] and valproic acid [44]. The main elimination route of MHD is
glucuronidation, and the maturation of the hepatic abundance/activity depends on the UGT
isoforms considered: it can sometimes reach adult levels two to three months after birth,
while it can be upregulated beyond two years of age in other cases [45]. Of note, UGT
isoform(s) responsible for MHD glucuronidation have not yet been identified. Renal
excretion has a minor contribution in MHD elimination (less than 20% of the MHD dose
administered intravenously was found unchanged in the urine [4]), nonetheless, as renal
clearance follows the same allometric principles as metabolic clearance, it may also explain
In the present study, OXC mean apparent volume of distribution was 397.7 L/70kg (5.7L/kg).
This value is in agreement with the adult values described in the literature which are 3.9-12.5
L/kg (273-875 L/70kg) [6]. MHD mean apparent weight-normalized volume was 54.8
L/70kg. It differed greatly from the values displayed in some former population
pharmacokinetic studies in children (285.6 L/70kg [16], 171.5 L/70kg [16] and 312.9 L/70kg
[23]). However, according to the allometric principles, weight normalized-volume should be
similar in all age groups [46]. Of note, the value we obtained in this study is similar to the
values observed in adults, after an IV administration of MHD, that were 54,7 L for (R)-MHD
and 45.9 L for (S)-MHD [4].
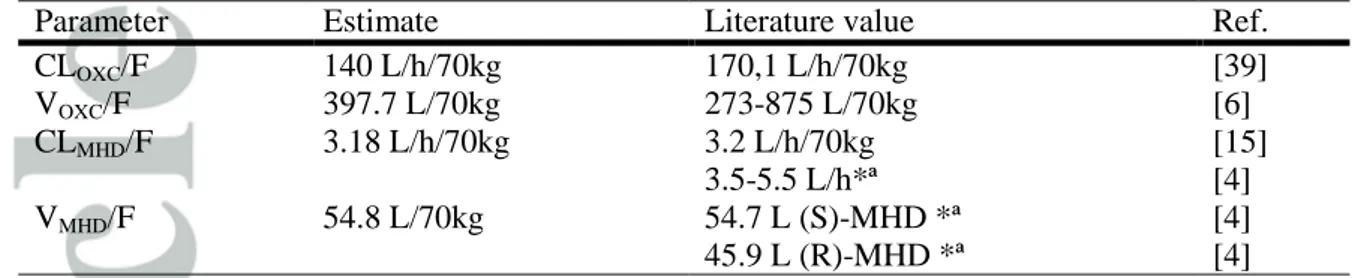
A summary of a size-standardized estimates and literature values is provided on Table 6.
In pediatric population pharmacokinetic studies, body weight is a factor reflecting changes in
body size, and is related to clearance and volume via an allometric model with theoretical
exponents of 0.75 or 0.67 for clearance and 1 for the volume [47]. Fixed and estimated
allometric exponents were both tested. For oxcarbazepine, the estimated exponents for
CLOXC/F and VcOXC/F were 0.798 and 2.4, respectively. For MHD, those values were 0.549
and 1.09 for CLMHD/F and VcMHD/F, respectively. Although the obtained values were not
exactly similar to the theoretical exponents (principally the 2.4 exponent related to VcOXC/F),
the model with estimated exponents performed better on the external evaluation (Table 2), as
evidenced by the lower Mean Prediction Error obtained with the empirical model. The reason
for this result is unclear to us. A possible explanation for the great difference between the
exponent of 2.4 that was estimated for VcOXC/F and the theoretical value of 1 may result from
the study design. Indeed, our PK parameters allow to calculate a distribution half-life of 0.53
h. It is therefore possible our study design did not include enough samples during the
distribution phase, which may have penalized the estimation of this allometric factor. The
exponent obtained by Sugiyama et al [16] in their population model of MHD (0.555). It was
previously demonstrated that the theory-based allometric exponent of 0.75 for CL could be
inaccurate in some situations [48–50]. Indeed, if this theory-based exponent accurately
predicts CL in all cases in adolescents (from 12 to 18 years) [51], it may not be relevant for
some drugs in younger children, especially < 5 years [48–50]. The fact that our population
included children between 2 and 12 years and that half of them were below 6 years of age
may explain the difference between the empirical allometric exponent of CLMHD/F and the
theoretical value of 0.75. Based on these results, we decided to use the empirical exponents to
perform the dose evaluation. Nonetheless, because of the inconsistency with the allometric
principles, we believe an important limitation of the present model is its inapplicability for
children under 2 years.
Monte Carlo simulations were performed with the aim to evaluate the consistency between
the recommended pediatric doses and the reference trough concentration of MHD (Ctrough) for
therapeutic drug monitoring. Older children, represented by higher body weights, achieved an
AUC about 104.5% higher than younger patients (Table 4). This is consistent with the
observation that weight-normalized clearance decreased with age. For 10 kg children, the
probability for their MHD Ctrough to be within the reference range increased from 23% to
98.3% with increasing doses (from 10 to 60 mg/kg/day) while, in 50 kg children, it decreased
from 98.7% to 40.6% with increasing doses (for 10 and 60 mg/kg/day), as more Ctrough
exceeded the limit of 35 mg/L and reached possibly toxic concentrations (Supplementary
data, Table 1). This confirms that older children need lower weight-normalized doses when
compared to younger children.
Association with enzyme inducing drugs is another factor accounting for oxcarbazepine
variability [13]. Most of the patients were on concomitant enzyme-inducing AEDs, so, MHD
absence of concomitant EIAEDs. Those AEDs increased MHD clearance by 29.3%. This
phenomenon is well known and has been verified in most population models [15–17,23,24].
The drugs involved are carbamazepine, phenobarbital and phenytoin and it was demonstrated
that they can reduce MHD concentration by 20 to 40% [14,52,53]. With our model, patients
medicated with concomitant enzyme-inducing antiepileptic drugs had about 24% lower
exposition to MHD than patients not co-treated with EIAEDs (Table 4). Therefore, it seems
that children taking EIAEDs require greater weight-normalized doses to reach similar
expositions. For these patients, probabilities to be within the reference range increased with
dose/kg and weight and it was less likely for them to reach the toxicity threshold
(Supplementary data, Table 2).
Figure 7 shows daily oxcarbazepine doses allowing the attainment of a maximum probability
(> 95%) for MHD Ctrough to be within the reference range with respect to body weight, with
and without associated enzyme-inducing antiepileptic drugs. Recommended doses seem
convenient, except for 50 kg children not co-medicated with EIAEDs, who would need less
than the recommended target dose of 30-45 mg/kg/day, since a maximum probability of
being within the reference range is attained between 20 and 30 mg/kg/day, and the risk of
toxicity increases with higher doses. On the other hand, 10 kg children receiving concomitant
EIAEDs would need more than the maximum recommendation of 60 mg/kg/day to have at
least 95% chance to be within the reference range. It is not uncommon for clinicians to
exceed the recommendations, as verified by Borusiak et al. in their retrospective study, where
epileptic children were given oxcarbazepine doses from 19 to 123 mg/kg/day [9].
Considering a narrower reference range of 15-35 mg/L, as proposed by May et al. [6], the
need for higher doses is, as expected, increased for 10kg children with EIAEDs who only
(Supplementary data, Tables 1 and 2). Nonetheless, despite smaller probabilities to reach
therapeutic trough concentrations, the risk of toxicity remains the same.
The present model is only applicable to 2 to 12 years old epileptic patients and was developed
based on oral suspension data. This formulation is optimal for young children (< 8 years) who
may have swallowing issues, but the tablet formulation is preferable for older children. In
adults, bioequivalence between the oral suspension and the film-coated tablet was evidenced
[54,55], allowing us to assume that our model is applicable to the use of tablets in children.
Due to exclusion criteria, this model cannot be applied neither to patients with body weights
differing more than 2 SDs from normal body weight such as obese and malnourished
children.
In conclusion, a parent-metabolite population pharmacokinetic model of oxcarbazepine and
its monohydroxy derivative was developed in epileptic children. It identified body weight and
concomitant enzyme-inducing antiepileptic drugs as important covariates explaining
inter-individual pharmacokinetic variability of these two compounds. This model also allowed to
evidence that the doses currently used by clinicians are appropriate to obtain trough
concentrations of MHD within the recommended reference range [7], except for 10 kg
children receiving concomitant enzyme-inducing antiepileptic drugs who could need doses
higher than recommended, and 50 kg children without concomitant enzyme inducing drugs
who may need doses lower than recommended. However, as this reference concentration
range is wide and the correlation between MHD plasma concentration and its antiepileptic
effect has not been well established [10], only clinical responsiveness and adverse events
occurrence can ultimately allow the clinicians to decide which dose their patient requires.
When the dose/effect relationship will be elucidated, this model could be useful to determine
Acknowledgment
References
1. Full Prescribing Information. Trileptal. 2014.
2. Flesch G. Overview of the Clinical Pharmacokinetics of Oxcarbazepine. Clin Drug Investig. 2004;24(4):185–203.
3. Volosov A, Xiaodong S, Perucca E, Yagen B, Sintov A, Bialer M. Enantioselective pharmacokinetics of 10-hydrocarbazepine after oral administration of oxcarbazepine to healthy Chinese subjects. Clin Pharmacol Ther. 1999;66(6):547–53.
4. Flesch G, Czendlik C, Renard D, Lloyd P. Pharmacokinetics of the Monohydroxy Derivative of Oxcarbazepine and Its Enantiomers after a Single Intravenous Dose Given as Racemate Compared with a Single Oral Dose of Oxcarbazepine. Drug Metab Dispos. 2011;39(6):1103– 10.
5. Kim DW, Gu N, Jang I, Chu K, Yu K, Cho JY, Yoon SH, Kim HS, Oh J, Lee SK. Efficacy, tolerability, and pharmacokinetics of oxcarbazepine oral loading in patients with epilepsy. Epilepsia. 2012;53(1):e9–12.
6. May TW, Korn-Merker E, Rambeck B. Clinical Pharmacokinetics of Oxcarbazepine. Clin Pharmacokinet. 2003;42(12):1023–42.
7. Patsalos PN, Berry DJ, Bourgeois BFD, Cloyd JC, Glauser TA, Johannessen SI, Leppik IE, Tomson T, Perucca E. Antiepileptic drugs - best practice guidelines for therapeutic drug monitoring : A position paper by the subcommission on therapeutic drug monitoring, ILAE Commission on Therapeutic Strategies. Epilepsia. 2008;49(7):1239–76.
8. Striano S, Striano P, Di Nocera P, Italiano D, Fasiello C, Ruosi P, Bilo L, Pisani F. Relationship between serum mono-hydroxy-carbazepine concentrations and adverse effects in patients with epilepsy on high-dose oxcarbazepine therapy. Epilepsy Res. 2006;69:170–6.
9. Borusiak P, Korn-merker E, Holert N, Boenigk HE. A Survey in Treatment of Childhood Epilepsy: of 46 Children and Adolescents. J Epilepsy. 1998;11(6):355–60.
10. Bring P, Ensom MH. Does Oxcarbazepine Warrant Therapeutic Drug Monitoring? A Critical Review. Clin Pharmacokinet. 2008;47(12):767–78.
11. Rey E, Bulteau C, Motte J, Tran A, Sturm Y, D’Souza J, Markabi S, Pons G, Dulac O. Oxcarbazepine Pharmacokinetics and Tolerability in Children With Inadequately Controlled Epilepsy. J Clin Pharmacol. 2004;44:1290–300.
12. Landmark CJ, Baftiu A, Tysse I, Valsø B, Larsson PG, Rytter E, Johannessen SI. Pharmacokinetic Variability of Four Newer Antiepileptic Drugs, Lamotrigine, Levetiracetam, Oxcarbazepine, and Topiramate: A Comparison of the Impact of Age and Comedication. Ther Drug Monit. 2012;34(4):440–5.
13. Johannessen SI, Tomson T. Pharmacokinetic Variability of Newer Antiepileptic Drugs: When is Monitoring Needed ? Clin Pharmacokinet. 2006;45(11):1061–75.
14. Tartara A, Galimberti CA, Manni R, Morini R, Limido G, Gatti G, Bartoli A, Strada G, Perucca E. The pharmacokinetics of oxcarbazepine and its active metabolite 10-hydroxy-carbazepine in healthy subjects and in epileptic patients treated with phenobarbitone or valproic acid. Br J Clin Pharmacol. 1993;36:366–8.
15. Sallas WM, Milosavljev S, D’Souza J, Hossain M. Pharmacokinetic drug interactions in children taking oxcarbazepine. Clin Pharmacol Ther. 2003;74:138–49.
16. Sugiyama I, Bouillon T, Yamaguchi M, Suzuki H, Hirota T, Fink M. Population pharmacokinetic analysis for 10-monohydroxy derivative of oxcarbazepine in pediatric epileptic patients shows no difference between Japanese and other ethnicities. Drug Metab Pharmacokinet. 2015;30(5):160–107.
17. Wang Y, Zhang H, Niu C, Gao P, Chen Y, Peng J, Liu M, Xu H. Population pharmacokinetics modeling of oxcarbazepine to characterize drug interactions in Chinese children with epilepsy. Acta Pharmacol Sin. 2014;35:1342–50.
Pharmacokinetics and tolerability of eslicarbazepine acetate and oxcarbazepine at steady state in healthy volunteers. Epilepsia. 2013;54(8):1453–61.
19. Kristensen O, Klitgaard NA, Jonsson B, Sindrup S. Pharmacokinetics of 10-OH-carbazepine, the main metabolite of the antiepileptic oxcarbazepine, from serum and saliva concentrations. Acta Neurol Scand. 1983;68:145–50.
20. Lloyd P, Flesch G, Dieterle W. Clinical Pharmacology and Pharmacokinetics of Oxcarbazepine. Epilepsia. 1994;35(3):10–3.
21. Yu Y, Zhang Q, Xu W, Lv C, Hao G. Population pharmacokinetic modeling of oxcarbazepine active metabolite in Chinese patients with epilepsy. Eur J Drug Metab Pharmacokinet. 2015;
22. Peng J, Zhang H, Liu Z, Xu H, Wang Y. Population pharmacokinetics of oxcarbazepine active metabolite in Chinese children with epilepsy. Int J Clin Pharmacol Ther. 2014;52(8):684–92.
23. Northam RS, Hernandez AW, Litzinger MJ, Minecan DN, Glauser TA, Mangat S, Zheng C, Souppart C, Sturm Y. Oxcarbazepine in Infants and Young Children With Partial Seizures. Pediatr Neurol. 2005;33(5):337–44.
24. Park K, Kim J, Joo EY, Seo DW, Hong SB, Ko J, Kim S, Huh W, Lee S. Drug Interaction and Pharmacokinetic Modeling of Oxcarbazepine in Korean Patients With Epilepsy. Clin Neuropharmacol. 2012;35(1):40–4.
25. Rouan MC, Decherf M, Le Clanche V, Lecaillon JB, Godbillon J. Automated microanalysis of oxcarbazepine and its monohydroxy ans transdiol metabolites in plasma by liquid chromatography. J Chromatogr B. 1994;658:167–72.
26. Samson A, Lavielle M, Mentré F. Extension of the SAEM algorithm to left-censored data in nonlinear mixed-effects model: Application to HIV dynamics model. Comput Stat Data Anal. 2006;51:1562–74.
27. Beal SL. Ways to Fit a PK Model with Some Data Below the Quantification Limit. J Pharmacokinet Pharmacodyn. 2001;28(5):481–504.
28. Schütz H, Feldmann KF, Faigle JW, Kriemler H-P, Winkler T. The metabolism of 14C-oxcarbazepine in man. Xenobiotica. 1986;16(8):769–78.
29. Bertrand J, Laffont CM, Mentré F, Chenel M, Comets E. Development of a Complex Parent-Metabolite Joint Population Pharmacokinetic Model. AAPS J. 2011;13(3):390–404.
30. Wang C, Peeters MYM, Allegaert K, van Oud-alblas HJB, Krekels EHJ, Tibboel D, Danhof M, Knibbe CAJ. A Bodyweight-Dependent Allometric Exponent for Scaling Clearance Across the Human Life-Span. Pharm Res. 2012;29(6):1570–81.
31. Comets E, Brendel K, Mentré F. Computing normalised prediction distribution errors to evaluate nonlinear mixed-effect models: the npde add-on package for R. Comput Methods Programs Biomed. 2008;90:154–66.
32. Bergstrand M, Hooker AC, Wallin JE, Karlsson MO. Prediction-Corrected Visual Predictive Checks for Diagnosing Nonlinear Mixed-Effects Models. AAPS J. 2011;13(2):143–51.
33. Li R, Sheng X, Ma L, Yao H, Cai L, Chen C, Zhu S, Zhou Y, Wu Y, Cui Y. Saliva and Plasma Monohydroxycarbamazepine Concentrations in Pediatric Patients with Epilepsy. Ther Drug Monit. 2016;38(8):365–70.
34. Samuels M, Wieteska S, Eds. Advanced Paediatric Life Support: The Practical Approach. John Wiley & Sons Ltd, editor. West Sussex, UK; 2011.
35. Southan C, Sharman JL, Benson HE, Faccenda E, Pawson AJ, Alexander SP, et al. The IUPHAR/BPS Guide to PHARMACOLOGY in 2016: Towards curated quantitative interactions between 1300 protein targets and 6000 ligands. Nucleic Acids Res. 2016;44:D1054–D1D68.
36. Alexander SPH, Catterall WA, Kelly E, Marrion N, Peters JA, Benson HE, Faccenda E, Pawson AJ, Sharman JL, Southan C, Davies JA, CGTP Collaborators. The concise guide to PHARMACOLOGY 2015/16 : Voltage-gated ion channels CatSper and Two-Pore channels. Br J Pharmacol. 2015;172:5904–41.
37. Cheng H, Juskot WJ. Pharmacokinetics of reversible metabolic systems. Biopharm Drug Dispos. 1993;14:721–66.
38. Brar S, Bhattaram A, Kumi K, Zhu H. Clinical Pharmacology Review [Internet]. 2011.
Available from:
http://www.fda.gov/downloads/Drugs/DevelopmentApprovalProcess/DevelopmentResources/ UCM328328.pdf
39. Dickinson RG, Hooper WD, Dunstan PR, Eadie MJ. First dose and steady-state pharmacokinetics of oxcarbazepine and its 10-hydroxy metabolite. Eur J Clin Pharmacol. 1989;37:69–74.
40. Jullien V, Chhun S, Rey E, Dulac O, Tod M, Chiron C, Pons G. Pharmacokinetics of Clobazam and N -Desmethylclobazam in Children with Dravet Syndrome Receiving Concomitant Stiripentol and Valproic Acid. Clin Pharmacokinet. 2015;54:527–36.
41. Delgado Iribarnegaray MF, Santo Bueldga D, Garcia Sanchez MJ, Otero MJ, Falcao A, Dominguez-Gil A. Carbamazepine population pharmacokinetics in children: mixed-effect models. Ther Drug Monit. 1997;19(2):132–9.
42. Yukawa E, Higuchi S, Aoyama T. Phenobarbitone population pharmacokinetics from routine clinical data: role of patient characteristics for estimating dosing regimens. J Pharm Pharmacol. 1992;44(9):755–60.
43. Banfield CR, Zhu GR, Jen JF, Jensen PK, Schumaker RC, Perhach JL, Affrime MB, Glue P. The effect of age on the apparent clearance of felbamate: a retrospective analysis using nonlinear mixed-effects modeling. Ther Drug Monit. 1996;18(1):19–29.
44. Cloyd JC, Fisher JH, Kriel RL, Kraus DM. Valproic acid pharmacokinetics in children. IV. Effects of age and antiepileptic drugs on protein binding and intrinsic clearance. Clin Pharmacol Ther. 1993;53(1):22–9.
Developmental aspects of human hepatic drug glucuronidation in young children and adults. Gut. 2002;50:259–65.
46. Holford N, Heo Y-A, Anderson B. A Pharmacokinetic Standard for Babies and Adults. J Pharm Sci. 2013;102(9):2941–52.
47. Anderson BJ, Holford NHG. Mechanism-Based Concepts of Size and Maturity in Pharmacokinetics. Annu Rev Pharmacol Toxicol. 2008;48:303–32.
48. Calvier EAM, Krekels EHJ, Välitalo PAJ, Rostami-Hodjegan A, Tibboel D, Danhof M, Knibbe CAJ. Allometric Scaling of Clearance in Paediatric Patients : When Does the Magic of 0.75 Fade ? Clin Pharmacokinet. 2017;56:273–85.
49. Mahmood I. Dosing in Children: A Critical Review of the Pharmacokinetic Allometric Scaling and Modelling Approaches in Paediatric Drug Development and Clinical Settings. Clin Pharmacokinet. 2014;53:327–46.
50. Mahmood I. Prediction of drug clearance in children from adults: a comparison of several allometric methods. Br J Clin Pharmacol. 2006;61(5):545–57.
51. Momper JD, Mulugeta Y, Green DJ, Karesh A, Krudys KM, Sachs HC, Yao LP, Burckart GJ. Adolescent Dosing and Labeling Since the Food and Drug Administration Amendments Act of 2007. JAMA Pediatr. 2013;167(10):926–32.
52. McKee P, Blacklaw J, Forrest G, Gillham R, Walker S, Connelly D, Brodie M. A double-blind, placebo-controlled interaction study between oxcarbazepine and carbamazepine, sodium valproate and phenytoin in epileptic patients. Br J Clin Pharmacol. 1994;37(1):27–32.
53. Armijo J, Vega-Gil N, Shushtarian M, Adin J, Herranz J. 10-Hydroxycarbazepine serum concentration-to-oxcarbazepine dose ratio: influence of age and concomitant antiepileptic drugs. Ther Drug Monit. 2005;27(2):199–204.
54. Souppart C, Yin Q, Merz M, Hu P, Jiang J, Appel-Dingemanse S. Bioequivalence of oxcarbazepine oral suspension vs . film-coated tablet in healthy Chinese male subjects. Int J
Clin Pharmacol Ther. 2008;46(10):538–44.
55. Flesch G, Tudor D, Denouel J, Bonner J, Camisasca R. Assessment of the bioequivalence of two oxcarbazepine oral suspensions versus a film-coated tablet in healthy subjects. Int J Clin Pharmacol Ther. 2003;41(7):299–308.
Table 1. Concomitant antiepileptic drugs
Associated Antiepileptic Drug Patients (%)
Carbamazepine 19 (61.3 %) Vigabatrin 14 (45.2 %) Clobazam 8 (25.8 %) Phenytoin 5 (16.1 %) Valproic acid 4 (12.9 %) Clonazepam 3 (9.7 %) Lamotrigine 3 (9.7 %) Diazepam 2 (6.5 %) Phenobarbital 2 (6.5 %) Ethosuccimide 1 (3.2 %) Progabide 1 (3.2 %)
Table 2. Comparison between MHD steady-state trough concentrations obtained in therapeutic drug monitoring by Li et al. [29] and predicted by different models
Model MPE RMSE
Parent-metabolite model with back-transformation and estimated allometric coefficients
27.7% 7.2 Parent-metabolite model with back-transformation and fixed allometric
coefficients
39 % 7.8
MHD model developed by Peng et al. [22] 44.1% 14.5
MHD model developed by Sallas et al. [15] 95.6% 14.2
MHD model developed by Sugiyama et al. [16] 69.1% 11.4
Table 3. Values and precision of the parameters of the estimated allometric exponent and fixed allometric exponent models
Parameter
Model with estimated allometric exponents
Model with fixed allometric exponents
Estimated value RSE (%) Estimated value RSE (%)
Ka (h-1) 1.83 4 1.81 4 CLOXC/F (L/h/70kg) 140 24 116 8 VcOXC/F (L/70kg) 337 41 55.7 22 QOXC/F (L/h) 62.5 21 119/70kg 21 VpOXC/F (L) 60.7 25 235/70kg 23 CLMHD/F (L/h/70kg) 4.11 14 5.1 5 VcMHD/F (L/70kg) 54.8 16 47.7 6 KBT (h-1) 0.0622 15 0.0476 16 θ 0.798 26 0.75 FIXED θ 2.4 17 1 FIXED θ - - 0.75 FIXED - - 1 FIXED θ -0.257 42 -0.276 40 θ 0.549 21 0.75 FIXED θ 1.09 13 1 FIXED ωCLOXC/F 0.393 15 0.361 16 ωVcOXC/F 0.601 22 1.07 16 ωQOXC/F 0.919 18 0.928 17 ωVpOXC/F 1.26 15 1.11 15 ωCLMHD/F 0.235 14 0.247 15 ωVcMHD/F 0.211 25 0.209 23 ωKBT 0.63 16 0.587 17 σOXC 0.32 7 0.321 7 σMHD (a) 0.993 13 0.972 13 σMHD (b) 0.0398 21 0.0406 20
RSE relative standard error, Ka absorption rate constant, F bioavailability, VcOXC central
volume of distribution of OXC, CLOXC elimination clearance of OXC, QOXC
intercompartmental clearance of OXC, VpOXC peripheral volume of distribution of OXC,
CLMHD elimination clearance of MHD, VcMHD central volume of distribution of MHD, KBT
back-transformation constant, θ factor describing the relationship between the covariate and the parameter, WT body weight, nEIAEDs absence of enzyme-inducing antiepileptic drug, ω inter-individual variability, σ residual error, (a) additive, (b) proportional, OXC
Table 4. Median and non-parametric 95% confidence interval (95CI) of simulated steady-state AUC0-12 of MHD according to the daily dose of
oxcarbazepine administered as a bid regimen
10 mg/kg/d 20 mg/kg/d 40 mg/kg/d 60 mg/kg/d 90 mg/kg/d
Body weight
(kg) Co-treatment Median [95CI] Median [95CI] Median [95CI] Median [95CI] Median [95CI]
10 Without EIAEDs 46.5 [31.0 – 72.3] 92.9 [61.9 – 144.7] 185.8 [123.8 – 289.3] 278.8 [185.7 – 434.0] 412.1 [267.1 – 662.6] 20 62.2 [38.5 – 101.8] 124.4 [77.0 – 203.5] 248.7 [154.0 – 407.0] 373.1 [231.0 – 610.4] 561.3 [357.6 – 897.9] 30 75.5 [48.0 – 119.8] 151.0 [96.1 – 239.6] 302.0 [192.1 – 479.2] 453.0 [288.2 – 718.7] 680.0 [420.2 – 1110.2] 40 84.9 [56.3 – 132.6] 169.9 [112.5 – 265.1] 339.7 [225.0 – 530.2] 509.6 [337.5 – 795.3] 771.3 [472.3 – 1232.7] 50 95.1 [60.4 – 148.4] 190.2 [120.9 – 296.9] 380.4 [241.8 – 593.8] 570.6 [362.7 – 890.6] 861.0 [538.1 – 1349.3] 10 With EIAEDS 35.5 [21.9 – 57.4] 71.1 [43.9 – 114.7] 142.2 [87.7 – 229.4] 213.3 [131.6 – 344.2] 317.6 [206.3 – 503.9] 20 48.7 [30.0 – 77.3] 97.3 [60.1 – 154.6] 194.6 [120.1 – 309.1] 291.9 [180.2 – 463.7] 432.8 [271.9 – 697.7] 30 58.3 [35.5 – 92.8] 116.5 [71.0 – 185.6] 233.1 [141.9 – 371.2] 349.6 [212.9 – 556.8] 519.9 [330.1 – 824.5] 40 66.3 [41.4 – 104.3] 132.6 [82.8 – 208.6] 265.2 [165.5 – 417.2] 397.8 [248.3 – 625.8] 602.0 [383.5 – 938.0] 50 72.3 [46.0 – 113.8] 144.6 [92.0 – 227.5] 289.1 [184.1 – 455.1] 433.7 [276.1 – 682.6] 673.2 [405.4 – 1033.0]
Table 5. Median and non-parametric 95% confidence interval (95CI) of simulated steady-state MHD trough concentrations according to the daily dose of oxcarbazepine administered as a bid regimen
10 mg/kg/d 20 mg/kg/d 40 mg/kg/d 60 mg/kg/d 90 mg/kg/d
Body weight
(kg) Co-treatment Median [95CI] Median [95CI] Median [95CI] Median [95CI] Median [95CI] 10 Without EIAEDs 2.2 [0.6 – 4.5] 4.4 [1.3 – 9.1] 8.9 [2.5 – 18.1] 13.3 [3.8 – 27.2] 19.2 [5.2 – 41.4] 20 3.3 [1.3 – 6.7] 6.6 [2.5 – 13.5] 13.2 [5.1 – 27.0] 19.7 [7.6 – 40.4] 29.6 [11.6 – 57.9] 30 4.5 [1.9 – 8.0] 8.9 [3.8 – 16.0] 17.9 [7.7 – 32.0] 26.8 [11.5 – 48.0] 39.5 [16.4 – 74.0] 40 5.4 [2.7 – 9.4] 10.8 [5.3 – 18.7] 21.7 [10.6 – 37.5] 32.5 [16.0 – 56.2] 48.7 [22.8 – 87.9] 50 6.3 [3.4 – 10.9] 12.5 [6.7 – 21.9] 25.1 [13.5 – 43.7] 37.6 [20.2 – 65.6] 56.9 [28.6 – 96.9] 10 With EIAEDs 1.5 [0.3 – 3.4] 2.9 [0.6 – 6.9] 5.9 [1.1 – 13.7] 8.8 [1.7 – 20.6] 12.2 [2.8 – 29.2] 20 2.3 [0.7 – 4.7] 4.6 [1.4 – 9.3] 9.1 [2.9 – 18.7] 13.7 [4.3 – 28.0] 20.0 [5.8 – 42.2] 30 3.1 [1.2 – 5.9] 6.1 [2.5 – 11.7] 12.3 [5.0 – 23.5] 18.4 [7.5 – 35.2] 27.4 [10.5 – 53.6] 40 3.8 [1.6 – 7.1] 7.7 [3.3 – 14.2] 15.3 [6.6 – 28.4] 23.0 [9.9 – 42.6] 34.9 [14.5 – 62.9] 50 4.4 [2.1 – 7.9] 8.8 [4.1 – 15.9] 17.7 [8.3 – 31.8] 26.5 [12.4 – 47.6] 40.9 [18.4 – 72.1]
Table 6. Comparison of size-standardized estimates and values reported in the literature.
Parameter Estimate Literature value Ref.
CLOXC/F 140 L/h/70kg 170,1 L/h/70kg [39] VOXC/F 397.7 L/70kg 273-875 L/70kg [6] CLMHD/F 3.18 L/h/70kg 3.2 L/h/70kg 3.5-5.5 L/h*ª [15] [4] VMHD/F 54.8 L/70kg 54.7 L (S)-MHD *ª 45.9 L (R)-MHD *ª [4] [4]
* obtained from IV data
Figure 1. NPDE versus body weight (BW) of oxcarbazepine (A) and its monohydroxy
derivative (MHD) (B) for the empirical model and of oxcarbazepine (C) and MHD (D) for
the allometry theory based model. Upper blue area represents the simulation-based 95%
confidence interval of the 95th percentile; pink area represents the simulation-based 95%
confidence interval of the 50th percentile; lower blue area represents the simulation-based
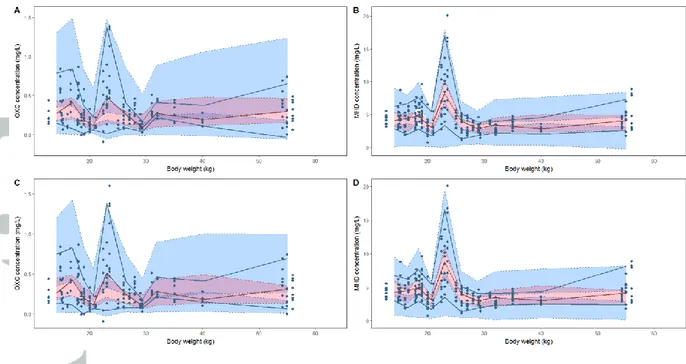
Figure 2. Prediction and variability corrected visual predictive checks against body weight
obtained with the empirical model for oxcarbazepine (OXC) (A) and monohydroxy
derivative (MHD) (B) and obtained for the theory-based allometry model for OXC (C) and
MHD (D). Blue dots represent the predicted and variability corrected observed
concentrations; upper blue area represents the simulation-based 95% confidence interval of
the 95th percentile; pink area represents the simulation-based 95% confidence interval of the
50th percentile; lower blue area represents the simulation-based 95% confidence interval of
the 5th percentile; upper and lower blue solid lines represent the 5th and 95th empirical
percentiles of the observations; red solid line represents the 50th empirical percentile of the
Figure 3. NPDE versus time (top) and population predictions (below) of oxcarbazepine (left)
and its monohydroxy derivative (MHD) (right). Blue dots are observed data; red dots are
BLQ data (sampled from the conditional distribution , where and are the estimated individual and population parameters, respectively); upper blue area
represents the simulation-based 90% confidence interval of the 90th percentile; pink area
represents the simulation-based 90% confidence interval of the 50th percentile; lower blue
Figure 4. Prediction-corrected visual predictive checks obtained with the final model.
Oxcarbazepine (OXC) on top, monohydrody derivative (MHD) below. Blue dots represent
the observed concentrations; red dots represent the BLQ data (sampled from the conditional
distribution); green lines represent 5th, 50th and 95th empirical percentiles of the observations;
upper blue area represents the simulation-based 95% confidence interval of the 95th
percentile; pink area represents the simulation-based 95% confidence interval of the 50th
percentile; lower blue area represents the simulation-based 95% confidence interval of the 5th
Figure 5. Probability of steady-state MHD trough concentration to be within reference range
(3-35 mg/L) depending on dose and body weight when enzyme-inducing antiepileptic drugs
are associated (A) or not (B); Probability of steady-state MHD trough concentration to reach
toxicity threshold (>35 mg/L) depending on dose and body weight when enzyme-inducing
Figure 6. Relationship of monohydroxy derivative (MHD) weight-normalized clearance with
respect to age. Orange circles represent children taking concomitant enzyme-inducing
antiepileptic drugs; green crosses represent children not taking enzyme-inducing antiepileptic
Figure 7. Daily doses to obtain a maximum probability (> 95%) to be within the reference
range. Orange line represents doses for children taking concomitant enzyme-inducing
antiepileptic drugs; green line represents doses for children not taking concomitant
List of Hyperlinks for Crosschecking Oxcarbazepine :
http://www.guidetopharmacology.org/GRAC/LigandDisplayForward?ligandId=7254. Voltage-gated sodium channels :
http://www.guidetopharmacology.org/GRAC/FamilyDisplayForward?familyId=82 Potassium:
http://www.guidetopharmacology.org/GRAC/FamilyDisplayForward?familyId=81