HAL Id: hal-01427809
https://hal.sorbonne-universite.fr/hal-01427809
Submitted on 6 Jan 2017HAL is a multi-disciplinary open access archive for the deposit and dissemination of sci-entific research documents, whether they are pub-lished or not. The documents may come from teaching and research institutions in France or abroad, or from public or private research centers.
L’archive ouverte pluridisciplinaire HAL, est destinée au dépôt et à la diffusion de documents scientifiques de niveau recherche, publiés ou non, émanant des établissements d’enseignement et de recherche français ou étrangers, des laboratoires publics ou privés.
properties and in vivo studies
Jeremy Malinge, Bastien Géraudie, Paul Savel, Valerie Nataf, Aurelie Prignon,
Claire Provost, Yongmin Zhang, Phalla Ou, Khaldoun Kerrou, Jean-Noel
Talbot, et al.
To cite this version:
Jeremy Malinge, Bastien Géraudie, Paul Savel, Valerie Nataf, Aurelie Prignon, et al.. Liposomes for PET and MR imaging and for dual targeting (magnetic field/glucose moiety): synthesis, properties and in vivo studies. Molecular Pharmaceutics, American Chemical Society, 2016, 14 (2), pp.406-414. �10.1021/acs.molpharmaceut.6b00794�. �hal-01427809�
Molecular Pharmaceutics is published by the American Chemical Society. 1155 Sixteenth Street N.W., Washington, DC 20036
Published by American Chemical Society. Copyright © American Chemical Society.
Liposomes for PET and MR imaging and for dual targeting (magnetic
field/glucose moiety): synthesis, properties and in vivo studies
Jeremy Malinge, Bastien Géraudie, Paul SAVEL, Valerie Nataf, Aurelie Prignon, Claire Provost, Yongmin Zhang, Phalla Ou, Khaldoun Kerrou, Jean-Noel Talbot, Jean-Michel Siaugue, Matthieu Sollogoub, and Christine Menager
Mol. Pharmaceutics, Just Accepted Manuscript • DOI: 10.1021/acs.molpharmaceut.6b00794 • Publication Date (Web): 28 Dec 2016
Downloaded from http://pubs.acs.org on January 3, 2017
Just Accepted
“Just Accepted” manuscripts have been peer-reviewed and accepted for publication. They are posted online prior to technical editing, formatting for publication and author proofing. The American Chemical Society provides “Just Accepted” as a free service to the research community to expedite the dissemination of scientific material as soon as possible after acceptance. “Just Accepted” manuscripts appear in full in PDF format accompanied by an HTML abstract. “Just Accepted” manuscripts have been fully peer reviewed, but should not be considered the official version of record. They are accessible to all readers and citable by the Digital Object Identifier (DOI®). “Just Accepted” is an optional service offered to authors. Therefore, the “Just Accepted” Web site may not include all articles that will be published in the journal. After a manuscript is technically edited and formatted, it will be removed from the “Just Accepted” Web site and published as an ASAP article. Note that technical editing may introduce minor changes to the manuscript text and/or graphics which could affect content, and all legal disclaimers and ethical guidelines that apply to the journal pertain. ACS cannot be held responsible for errors or consequences arising from the use of information contained in these “Just Accepted” manuscripts.
Liposomes for PET and MR imaging and for dual targeting (magnetic field/glucose moiety): synthesis, properties, and in vivo studies
Jérémy Malinge1,2, Bastien Géraudie3,4, Paul Savel1,2, Valérie Nataf 4 , Aurélie Prignon3, Claire Provost3, Yongmin Zhang2, Phalla Ou5 , Khaldoun Kerrou4, Jean-Noël Talbot3,4, Jean-Michel Siaugue1, Matthieu Sollogoub* 2, Christine Ménager* 1
1 Sorbonne Universités, UPMC Univ Paris 06, CNRS, UMR 8234, PHENIX, F-75005, Paris, France
2 Sorbonne Universités, UPMC Univ Paris 06, CNRS, UMR 8232, IPCM, F-75005, Paris, France
3 Laboratoire d’Imagerie Moléculaire Positonique (LIMP), UMS028 Phénotypage du petit animal, UPMC Univ Paris 06, Paris, France
4 Médecine nucléaire et radiopharmacie, Hôpital Tenon, AP-HP, Paris, France
5 Université Paris Diderot, Plateforme de recherche préclinique FRIM, 46 rue Henri Huchard 75018 Paris, France
* corresponding authors : christine.menager@upmc.fr, matthieu.sollogoub@upmc.fr
Abstract
We describe the potentiality of a new liposomal formulation enabling PET and MR imaging. The bimodality is achieved by coupling a 68Ga-based radiotracer on the bilayer of magnetic liposomes. In order to enhance the targeting properties obtained under a permanent magnetic field, a sugar moiety was added in the lipid formulation. Two new phospholipids were synthesized, one with a specific chelator of 68Ga (DSPE-PEG-NODAGA) and one with a glucose moiety (DSPE-PEG-Glucose). The liposomes were produced according to a fast and safe process, with a high radiolabeling yield. MR and PET imaging were performed on mice bearing human glioblastoma tumors (U87MG) after iv injection. The accumulation of the liposomes in solid tumor is evidenced by MR imaging and the amount is evaluated in vivo and ex vivo according to PET imaging. An efficient magnetic targeting is achieved with these new magnetic liposomes.
Keywords: PET, MRI, gallium, magnetic nanoparticles, liposomes, magnetic targeting, Warburg effect
The combination of positron emission tomography (PET) and magnetic resonance imaging (MRI) into a single hybrid imaging modality using a common radiopharmaceutical and contrast agent has attracted the interest of many research groups, worldwide, for addressing
2 3 4 5 6 7 8 9 10 11 12 13 14 15 16 17 18 19 20 21 22 23 24 25 26 27 28 29 30 31 32 33 34 35 36 37 38 39 40 41 42 43 44 45 46 47 48 49 50 51 52 53 54 55 56 57 58
major medical needs[1–5]. Such an imaging tool combines the advantages of both imaging techniques, thus minimizing their respective limitations. For instance, MRI provides a high spatial resolution and great insight into the functions of surrounding organs. However, this technique only provides relative quantitative evaluation. In contrast, PET radiotracers allow absolute quantification of the uptake of the positron emitting radiopharmaceuticals with a detection limit in the pico-molar range. Such a bimodal imaging probe could offer complementary information and could be a very interesting tool for the development of theranostic platform[6].
The most widely used contrast agents for T2 pondered sequences in MRI are based on iron oxides,[7] appearing as hyposignal areas on images. In this context, the encapsulation of magnetic nanoparticles (MNPs), for example, maghemite γ-Fe2O3 nanoparticles (NPs), in the
aqueous core of liposomes provides ultra magnetic liposomes (UMLs) as an efficient material for MRI imaging. From the encapsulation of superparamagnetic NPs inside liposomes arises an increase of their intrinsic relaxivities, thus allowing a more accurate diagnosis in vivo[8]. Moreover, due to their high magnetic payload, UMLs are able to accumulate in solid tumors as well as in healthy tissue via the application of an external magnet[9].
Incorporation of positron emitters into liposomes has, simultaneously, attracted much attention. Many strategies have already been employed[10]. Many of them are based on the incorporation of a specific chelator inside, or on the surface of, the liposomes[11–13]. Some more exotic strategies involve the incorporation of radionuclides inside magnetic particles[14]. However, most of these systems suffer from demanding protocols, especially in terms of purification (use of column chromatography or centrifugation), hence they are not competitive with existing clinical protocols[15–17].
The choice of the radionuclide is also crucial. There is a compromise between the radionuclide half-life (t1/2) and the chemistry involved in the labeling process. For instance, 18F
is used to label the glucose moiety to provide 18F-FDG, which is widely used in clinical protocols[18]. However, incorporation of radioactive fluorine into liposomes is often difficult to achieve as it requires several, often complex, synthetic steps[19,20]. Other radionuclides, for example, 99mTc or 64Cu, are often used in liposome formulations.
However, the use of 68Ga as positron emitter is appealing. Its physical half-life (t1/2 = 68
min) is compatible with clinical protocols and the chemistry involved in its chelation is well described. Furthermore, its on-site availability (68Ga generators are commercially available) make this radiotracer a suitable candidate for liposome-based PET tracers[21].
Herein we report an original liposomal formulation involving coupling of a 68Ga-based
2 3 4 5 6 7 8 9 10 11 12 13 14 15 16 17 18 19 20 21 22 23 24 25 26 27 28 29 30 31 32 33 34 35 36 37 38 39 40 41 42 43 44 45 46 47 48 49 50 51 52 53 54 55 56 57 58 59
radiotracer on the surface of UMLs (68Ga@UMLs), allowing PET and MR imaging.
The magnetic properties of such a platform enable a rapid purification process (≈10 min), using a magnetic column, and can be used to target solid tumors in vivo via the effect of an external magnet on the tumor (magnetic accumulation)[8]. In addition to investigating the magnetic accumulation strategy, we also envisioned amplifying the vectorization potential of our platform by grafting glucose moieties onto the surface of the liposomes, thus taking advantage of the Warburg effect[22]. The combination of the two targeting strategies may actually increase the performance of the system, eventually offering an efficient theranostic probe.
Materials and Methods
Synthesis of magnetic nanoparticles. NPs of maghemite (γ-Fe2O3) were synthesized by
alkaline coprecipitation of FeCl2 and FeCl3 salts, according to the procedure described by
Massart[23]. After synthesis, the NPs were stabilized at pH 7 with citrate molecules. The typical size of MNPs was 9 nm (polydispersity index σ = 0.35). For the preparation of magnetic liposomes, MNPs were dispersed in a buffer (0.108 M NaCl, 0.02 M sodium citrate, 0.01 M HEPES, pH = 7.4) to achieve a total concentration of 313 mg mL–1 MNPs.
Phospholipids. The following commercially available phospholipids were used for the preparation of liposomes: dipalmitoyl-sn-glycero-3-phosphocholine (DPPC); 1,2-distearoyl-sn-glycero-3-phosphocholine (DSPC); and 1,2-distearoyl-sn-glycero-3-phosphoethanolamine-n-[(carboxy(polyethyleneglycol)2000](ammonium salt) (DSPE-PEG2000). All were purchased from Avanti Polar Lipids, Inc (Birmingham, AL) and used in chloroform solutions.
Synthesis of DSPE-PEG2000-NODA and DSPE-PEG2000-Glu. Reactants were purchased from commercial sources and used without further purification. HRMS were recorded on a Bruker micrOTOF spectrometer, using Agilent ESI-L Low Concentration Tuning-Mix as reference.
Liposome preparation. The preparation of magnetic liposomes is described in the literature[8]. Briefly, a mixture of the different phospholipids in chloroform (total amount of phospholipids was typically 3.57 µmol) was diluted in 3 mL of diethyl ether and 1 mL of chloroform. Then 1
2 3 4 5 6 7 8 9 10 11 12 13 14 15 16 17 18 19 20 21 22 23 24 25 26 27 28 29 30 31 32 33 34 35 36 37 38 39 40 41 42 43 44 45 46 47 48 49 50 51 52 53 54 55 56 57 58
mL of MNPs dispersed in water was introduced and sonication was carried out at room temperature for 30 min to yield a water-in-oil emulsion. This emulsion was immediately transferred to a 50 mL round bottom flask and the remaining organic solvent evaporated in a rotary evaporator (Rotavapor R-210, Buchi) at 25 °C until the gel phase disappeared. Liposomes were filtered through a 450 nm filter and subsequently purified by magnetic sorting. The solution containing UMLs was conditioned in syringes and placed on the edge of a strong magnet (Fe-Nd-B, 150 • 100 • 25 mm; Supermagnete Inc.). Due to their high magnetic content the liposomes stuck to the magnet. The supernatant containing the free magnetic nanoparticles was then eliminated by removing the piston of the syringe. The operation was repeated three times to eliminate free MNPs.
The size of the liposomes was determined using a Zetasizer Nano ZS (Malvern, UK) at 90° scattering angle. Samples of liposomes were diluted in an appropriate buffer. Diameters were deduced from the Stokes–Einstein law for spherical particles (d = kBT/3πηD, where D is the
translational diffusion coefficient, kB is the Boltzmann constant, and η is the dispersant
viscosity). Liposomes were also characterized by TEM (JEOL 100-CX transmission electron microscope) at 60 keV
In this study, three sets of liposomes were prepared: NODA@UML, Glu@UML and Glu-NODA@UML (see Table 1 in the Results part).
Radiolabeling. 68Ga was eluted from a 68Ge/68Ga generator system (Eckert and Ziegler, Germany) with HCl (0.1 M). The pH of the peak fraction eluate (1900 µL, 0.1 M, 343 MBq) was adjusted to 3/3.5 with sodium acetate (200 µL, 1 M) and ultrapure water (550 µL). A suspension of NODA@UML (250 µL in buffer solution 0.108 M NaCl, 0.02 M sodium citrate, 0.01 M HEPES, pH = 7.4) was added and the resulting mixture was stirred at 80 °C for 15 min to obtain 68Ga@UML.
Purification. The resulting labeled liposomes 68Ga@UML were separated from unchelated radioactive nuclei with a magnetic column (MACS® columns, Miltenyi Biotec) (See Scheme 1 in the Results part). The column was wetted with 500 µL of buffer prior to use. Then 500 µL of the reaction medium (F1) was introduced in the magnetic column and eluted. After collection of the first fraction, the column was rinsed twice with buffer (2 × 500 µL buffer solution 0.108 M NaCl, 0.02 M sodium citrate, 0.01 M HEPES, pH = 7.4, F2-F3). The magnet was removed and the column was eluted with 500 µL of buffer solution in order to collect the radiolabeled
2 3 4 5 6 7 8 9 10 11 12 13 14 15 16 17 18 19 20 21 22 23 24 25 26 27 28 29 30 31 32 33 34 35 36 37 38 39 40 41 42 43 44 45 46 47 48 49 50 51 52 53 54 55 56 57 58 59
liposomes 68Ga@UML (F4). To ensure their radiochemical purity (no free 68Ga3+), the activities from the aliquots and the column after purification were measured.
Stability of 68Ga@UML in buffer. To determine stability, 3 × 100 µL of 68Ga@UML from F4 were mixed with 3 × 1 mL of buffer solution (0.108 M NaCl, 0.02 M sodium citrate, 0.01 M HEPES, pH = 7.4). After 30 min, 1 h, and 2 h at room temperature, 500 µL of each sample was introduced in the Miltenyi column previously wetted with 500 µL of buffer. After collection of the first fraction (A1), the column was rinsed twice with buffer (2 × 500 µL buffer solution 0.108 M NaCl, 0.02 M sodium citrate, 0.01 M HEPES, pH = 7.4, A2-A3). The magnet was removed and the column was eluted with 500 µL of buffer solution in order to collect the magnetic liposomes (A4). Activity of the fractions was measured in an activimeter and activity from the column was measured in a gamma counter (Wallac Wizard, Perkin Elmer).
Relaxation. Relaxation times were measured at 0.9 T using a Minispec MQ20 spectrometer (Bruker, France) at 25 °C. T1 and T2 were determined three times for each sample. Standard deviations were 2% and 5%, respectively. Samples were diluted in buffer.
Transmission electron microscopy. After synthesis, liposomes were diluted 2000 times. A droplet was then deposited on a carbon-coated copper grid and dried. Liposomes were characterized with a JEOL 100-CX transmission electron microscope at 60 keV.
Cell culture and tumor-bearing mice. All animal experiments were carried out in compliance with current French legislation relating to the conduct of animal experimentation. Human glioblastoma U87MG cells (ATCC, Rockville, MD) were grown routinely in RPMI-1640 medium (Sigma-Aldrich), enriched with 10% fetal bovine serum, 5% L-glutamine, and 5% penicillin-streptomycin. Female Swiss nude mice (6 weeks old; Charles River, France) were subcutaneously inoculated into the right and left posterior legs with U87MG cells (1 × 10⁶) suspended in a 1:1 mixture of matrigel (BD Biosciences) and PBS, under the control of 1.5% isoflurane in oxygen (Minerve). Four weeks after inoculation, the mice were enrolled in small animal PET and MRI imaging. The tumor volume (Vcalliper) was estimated from the volume of
an ellipsoid: Vcalliper = π/6 × Dlong × Dshort2, where Dlong and Dshort were the longest and shortest
diameters measured with a calliper.
2 3 4 5 6 7 8 9 10 11 12 13 14 15 16 17 18 19 20 21 22 23 24 25 26 27 28 29 30 31 32 33 34 35 36 37 38 39 40 41 42 43 44 45 46 47 48 49 50 51 52 53 54 55 56 57 58
Magnetic resonance imaging. MRI imaging was performed with nonradioactive UML on U87MG tumor-bearing mice. Mice were divided into four groups. Groups 1 and 2 (n = 2) were injected with NODA@UML and groups 3 and 4 (n = 2) were injected with Glu-NODA@UML. A Nd-Fe-B disc magnet (5 mm diameter, 3 mm height, Supermagnet Inc.) was strapped on the tumors of mice from groups 1 and 3 to test the magnetic accumulation strategy. In vivo MRI experiments were conducted on a preclinical 7T system (PharmaScan 70/16, Bruker), operating on the Paravision software platform (Brucker). Animals were installed in supine position in a mouse body volume coil (inner diameter 40 mm) and maintained under general anesthesia with a 1.5% isoflurane/oxygen gas mixture inhalation (100 cm3 min–1 constant dose) delivered through a nose cone. Animals were scanned following standardized protocols, under respiratory-gated control. First a rapid sequence was performed for localizing the tumor site and after axial slices passing through the tumor site were acquired using high-resolution T2-weighted sequences (repetition time/echo time TR/TE 3560/36 ms, flip angle 180°, 1-mm slice thickness; matrix 384 × 384, field of view 40 mm). The animals were then removed from the machine, underwent retro-orbital injection of the venous sinus with 20 µM of iron (17 µL of UML in 100 µL of buffer). The magnet was maintained 1 h after iv injection (Groups 1 and 3) and removed before MRI imaging. Finally, the animals were placed in the animal holder and underwent follow-up scanning using exactly the same acquisition parameters. All images on T2-weighted sequence were performed with a very long echo time, the aim of which was to be sensitive to iron oxide detection and not to optimize for assessing blood-to-tissue contrast.
Positron emission tomography imaging. PET imaging was performed with the Mosaic animal PET system (Philips Medical Systems, Cleveland, OH). Mice were anesthetized with a mixture of 1.5% isoflurane and oxygen, and maintained on a heating pad during biodistribution of the different tracers. First, U87MG tumor-bearing mice (n = 10) were injected with 18F-FDG (CisBio, France) to ensure the homogeneous metabolic activities of the tumors. After a fasting period of 5 h, mice were injected in the retro-orbital sinus with 3 ± 1.1 MBq of 18F-FDG and underwent imaging 1 h later. Static acquisitions were performed during an exposure time of 10 min. Three days after 18F-FDG injection, comparative PET imaging was performed with
68
Ga@UML and Glu-68Ga@UML. Mice were divided into two groups, the first group (n = 5) was injected with 68Ga@UML and the second (n = 5) was injected with Glu-68Ga@UML. After a fasting period of 5 h, animals were injected (150–200 µL, 3 ± 1 MBq) and were imaged
2 3 4 5 6 7 8 9 10 11 12 13 14 15 16 17 18 19 20 21 22 23 24 25 26 27 28 29 30 31 32 33 34 35 36 37 38 39 40 41 42 43 44 45 46 47 48 49 50 51 52 53 54 55 56 57 58 59
within an optimal time of 30 min after injection during static acquisition of 10 min. A Nd-Fe-B disc magnet (5 mm diameter, 3 mm height, Supermagnet Inc.) was placed on the right tumors (Tright) just after injection and removed before PET imaging.
Images were reconstructed and data were analyzed using PETView and Syntegra software (Philips Medical Systems). Regions of interest (ROI) were drawn around tumors and whole mouse and tracer uptake was quantified using radioactivity concentration in ROI, reported to the whole mouse, and expressed as percentage of injected activity (% IA).
Ex vivo tumor uptake. After imaging, 40 min after injection of 68Ga@UMLs and Glu-68Ga- @UMLs, the U87MG tumor-bearing mice (n = 10) were sacrificed and tumors were dissected, weighed, and counted in a gamma counter (Wallac Wizard, Perkin Elmer). Tumor uptake was expressed as percentage of injected dose/gram of tissue (% ID/g), and corrected for decay.
Biodistribution. A microPET imaging study was performed in mice (n=6) bearing only one U87MG tumor on one posterior leg. A first group of mice (n = 3) was injected with
68
Ga@UML and a second (n = 3) was injected with 68Ga-Glu@UML and imaged 30 min post injection during 10 min. A small Nd-Fe-B magnetic disc (5 mm diameter, height 3 mm) was placed on the tumor of two mice / group just after injection. Ex vivo biodistribution was performed just after PET imaging.
Statistical analysis
Statistical analysis was performed using GraphPad 6 (GraphPad Software, CA). Results are presented as the mean ± SD (standard deviation). Comparison between volumes was performed using Student’s t test. Analysis of data from PET imaging and ex vivo tumor uptake was performed using one-way ANOVA variance analysis with Holm–Sidak’s test for multiple comparisons. A p-value < 0.05 was considered statistically significant for all tests.
Results and discussion
Synthesis of PEG2000-NODA. This new phospholipid consists of a classical DSPE-PEG backbone terminated by a chelator NODAGA. Its synthesis can be achieved in one step, by coupling the commercially available DSPE-PEG2000 with NODAGA-NHS activated ester (CheMatech Inc.) (Scheme 1). Practically, both DSPE-PEG2000 (30 mg, 0.009 mmol) and
2 3 4 5 6 7 8 9 10 11 12 13 14 15 16 17 18 19 20 21 22 23 24 25 26 27 28 29 30 31 32 33 34 35 36 37 38 39 40 41 42 43 44 45 46 47 48 49 50 51 52 53 54 55 56 57 58
NODAGA-NHS (7 mg, 0.009 mmol) were dissolved in CHCl3 (3 mL), then triethylamine
(0.09 mL) was added. The solution was stirred at room temperature. After, 12h thin layer chromatography (TLC) using a mixture of CHCl3 and MeOH (4:1) as eluent and mass
spectrometry both indicated consumption of starting material and formation of a new product. The reaction mixture was thus evaporated under vacuum and dialyzed (2500 cut-off) three times against water to afford the expected phospholipid DSPE-PEG2000-NODA (16 mg, 0.005 mmol) in 63% yield as confirmed by mass spectrometry (see SI, figures 1-2) and by NMR (see SI, figures 3-5)
Scheme 1. Synthesis of DSPE-PEG2000-NODA
Synthesis of DSPE-PEG2000-Glu. This new phospholipid consists of a classical DSPE-PEG backbone functionalized with a glucose derivative via a peptide coupling. The synthesis of the carboxymethylglucoside is based on a four-step synthesis, starting from commercially available D-glucose adapted from the literature.1 DSPE-PEG2000-Glu was then synthesized via a peptidic coupling. Carboxymethylglucoside (20 mg, 0.09 mmol) was dissolved in DMSO (1mL) together with DSPE-PEG2000-NH2 (2 mL, 50 mg, 0.018 mmol) and pyridine (0.2 mL).
N,N’-Dicyclohexylcarbodiimide (DCC) (37 mg, 0.18 mmol) was then added to the reaction mixture (Scheme 2). The reaction mixture was stirred at room temperature for 2 h, and TLC using a mixture of CHCl3 and MeOH (4:1) indicated that the reaction was not complete,
another portion of DCC (10 mg, 0.05 mmol) was added. After another 2 h of stirring, TLC indicated the completion of the reaction and disappearance of the starting material. The resulting mixture was centrifuged, the supernatant dialyzed (2500 cut-off) against water. The expected DSPE-PEG2000-Glu (23 mg, 7.7mmol) was obtained in 43% yield as confirmed by 2 3 4 5 6 7 8 9 10 11 12 13 14 15 16 17 18 19 20 21 22 23 24 25 26 27 28 29 30 31 32 33 34 35 36 37 38 39 40 41 42 43 44 45 46 47 48 49 50 51 52 53 54 55 56 57 58 59
mass spectroscopy (see SI, figure 6) and NMR (see SI, figures 7-8).
Scheme 2. Synthesis of DSPE-PEG2000-Glu
Liposome formulation
Maghemite γ-Fe2O3 nanoparticles (9 nm) coated with citrate ligands and dispersed in a buffer
(0.01 M HEPES, 0.108 M NaCl, 0.02 M sodium citrate, pH = 7.4) were used for the preparation of liposomes. The liposome formulation comprised NMPs, commercially available phospholipids (DSPE-PEG, DPPC, and DSPC) and the new chemically modified phospholipids, gathered into a single liposome. Two new phospholipids were synthesized from a DSPE-PEG2000 backbone to incorporate a glucose moiety DSPE-PEG2000-Glu and a NODAGA specific chelator into the lipid bilayer of the liposomes DSPE-PEG2000-NODA.
Liposomes were synthesized according to a reverse-phase evaporation method involving the evaporation of a water-in-oil emulsion. After collapse of the droplets during the evaporation step, bilayers formed, and liposomes were recovered using magnetic separation[8]. In this study, three sets of liposomes were prepared: NODA@UML, Glu@UML, Glu-NODA@UML (Table 1).
Table 1. Phospholipids composition (mol%) for the three sets of UMLs.
mol % DPPC DSPC DSPE-PEG
DSPE-PEG-NODA DSPE-PEG-Glu NODA@UML 75 5 5 5 0 Glu@UML 75 5 10 0 10 Glu-NODA@ UML 75 5 5 5 10
As the ratio of PEG chains was kept constant (20%) for all the formulations, no change in size was observed by TEM. Electron-dense spherical aggregates due to the presence of iron oxide nanoparticles were observed (Figure 1A). High magnification views confirmed the presence of
2 3 4 5 6 7 8 9 10 11 12 13 14 15 16 17 18 19 20 21 22 23 24 25 26 27 28 29 30 31 32 33 34 35 36 37 38 39 40 41 42 43 44 45 46 47 48 49 50 51 52 53 54 55 56 57 58
nanoparticles trapped into these aggregates (Figure 1B and Figure 9 SI). The spherical shape corresponds to liposomes, the presence of the bilayer around was confirmed by cryo-TEM.[8] The liposome diameters were measured by dynamic light scattering (DLS) and plotted with the intensity as a function of diameter (Figure 1C). Vesicles of 217 nm (polydispersity index σ = 0.27) and 238 nm (polydispersity index σ = 0.18) in diameter were recorded for NODA@UML (black) and Glu-NODA@UML (grey).
Typical size of liposomes may vary between 100 and 300 nm depending on the method of preparation. As expected, the hydrodynamic diameter measured by DLS increased after glucose grafting. For in vivo application this typical size is responsible of their short half-life that is why it is necessary to add PEG molecules in the bilayer formulation in order to avoid their rapid phagocytosis.
However for magnetic accumulation, it is the balance between the size and the magnetic force, which is the relevant parameter. The relative big size of the UML allows the encapsulation of a large amount of MNP yielding an efficient response to a magnetic field gradient.
The iron concentration on completion of the synthesis was measured by AAS and was almost constant (≈1 mol/L). After synthesis, in order to avoid osmotic stress, the liposomes were dispersed in the same buffer as that used for the dispersion of the MNPs.
Figure 1. TEM images of NODA@UML: (A) overall view, (B) isolated liposome. The contrast is due to the presence of MNPs inside the core. (C) DLS data of NODA@UML (black) and Glu-NODA@UML (grey).
Radiolabeling and purification 500 nm
A
B
Diameter (nm)C
In te n si ty ( % ) 2 3 4 5 6 7 8 9 10 11 12 13 14 15 16 17 18 19 20 21 22 23 24 25 26 27 28 29 30 31 32 33 34 35 36 37 38 39 40 41 42 43 44 45 46 47 48 49 50 51 52 53 54 55 56 57 58 59Initial attempts to chelate 68Ga3+ onto the liposomes at room temperature hardly reached 10% yield. The statistical distribution of the NODAGA inside and outside the liposomes, combined with the sterically demanding environment caused by the surrounding phospholipids, seemed to drastically restrict the labeling yield. However, after increasing the temperature, the liposomes became more permeable (no Fe2O3 NP leakage), allowing the chelation of the
NODAGA located inside the liposomes. When the reaction was performed at 80 °C for 15 min, 80% yield of radiolabeling was achieved (see Table 2). The reaction conditions were compatible with clinical protocols. They are fully detailed in the supporting material.
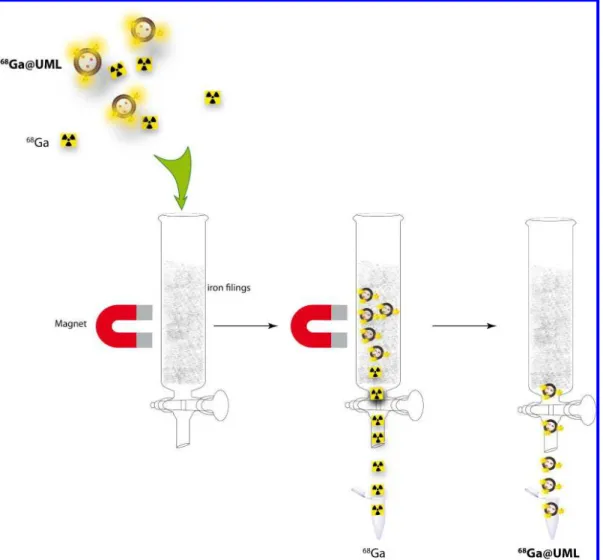
Briefly, magnetic liposomes were added to a buffered mixture of water, sodium acetate, HCl, and radioactive Ga3+, and reacted at 80 °C for 15 min. To purify the material from free Ga3+, the crude reaction mixture was injected into a magnetized column (MACS® column, Miltenyi Biotec), which allowed the retention of the magnetic liposomes while free radioactive species were eluted (Figure 2). Once all the free Ga3+ was removed (control of the activity of the eluted solutions F1, F2, F3), the column was removed from the magnet, and the pure radioactive liposomes, 68Ga@UML (F4), were released. To ensure the purity of the liposomes (no free Ga3+), the activity from the aliquots and the column after purification was measured (Table 2). The same protocol was used for the radiolabeling of Glu-NODA@UML (Table 2).
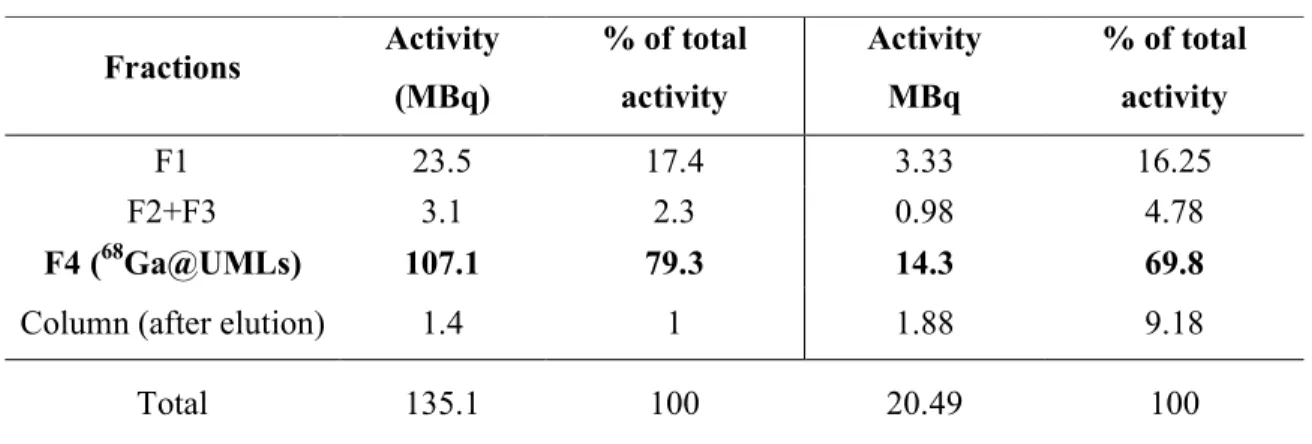
Table 2. Activity of the aliquots during the purification process. The percentage of total activity is calculated as the ratio of the activity of the purified fractions of liposomes over the total activity of the crude reaction medium
NODA@UML Glu-NODA@UML Fractions Activity (MBq) % of total activity Activity MBq % of total activity F1 23.5 17.4 3.33 16.25 F2+F3 3.1 2.3 0.98 4.78 F4 (68Ga@UMLs) 107.1 79.3 14.3 69.8
Column (after elution) 1.4 1 1.88 9.18
Total 135.1 100 20.49 100 2 3 4 5 6 7 8 9 10 11 12 13 14 15 16 17 18 19 20 21 22 23 24 25 26 27 28 29 30 31 32 33 34 35 36 37 38 39 40 41 42 43 44 45 46 47 48 49 50 51 52 53 54 55 56 57 58
Figure 2. Purification step of 68 Ga@UML using a magnetized column (MACS® column, Miltenyi Biotec).
The stability over time of the 68Ga@UML was evaluated in a buffer solution by measuring the corrected activity 30 min, 1 h, and 2 h after labeling. Table 3 summarizes the activity measured in each aliquot after magnetic purification. We observed very good stability of the radiochemical purity after 2 h (85%), meaning that no release of gallium occurs during storage in buffer.
Table 3. Stability of the Ga@UMLs over time.
Fractions 30 min (%) 1 h (%) 2 h (%) A1 8.04 10.16 12.25 A2+A3 1.52 1.92 2.20 A4 (68Ga@UML) 90.44 87.92 85.56 2 3 4 5 6 7 8 9 10 11 12 13 14 15 16 17 18 19 20 21 22 23 24 25 26 27 28 29 30 31 32 33 34 35 36 37 38 39 40 41 42 43 44 45 46 47 48 49 50 51 52 53 54 55 56 57 58 59
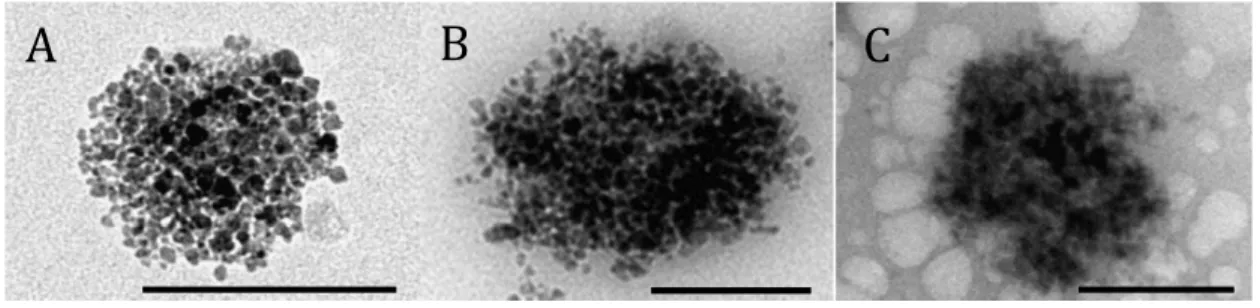
The integrity of the 68Ga@UMLs after radiolabeling and purification was also checked. The liposome structure might be altered by the temperature (80 °C), pH < 4, and the magnetic separation. Monitoring of the different stages involved in liposome preparation was carried out with TEM. Radiolabeling was performed with a stable isotope of Ga (69Ga). TEM images before and after complexation with 69Ga (Figures 3A and 3B) and after magnetic separation (Figure 2C) show a nonmodified structure of the UML. The white structure observed in the background of Figure 3C is due to the presence of salt.
Figure 3. TEM images of magnetic liposomes: (A) before complexation, (B) after complexation with 69Ga, and (C) after magnetic separation. Bar scale: 200 µm.
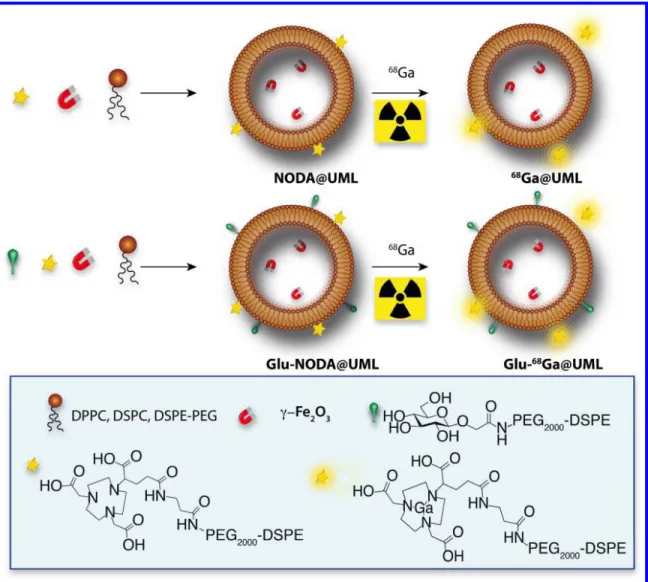
Compared to other protocols described in the literature [14,17,25,26], this process is rapid and simple to use in clinical and preclinical laboratories. It takes advantage of the magnetic properties of the liposomes, making purification simple (no chromatography or centrifugation required) and safe (no radiation outside the hood). From the radiolabeling reaction to the completion of the purification, this protocol can be carried out in < 30 min (15 min for labeling + 10 min for purification). This is competitive with clinical protocols and compatible with the physical half-life of the radionucleide 68Ga (T1/2 = 68 min). The different steps of the liposomes
formulation are summarized on figure 4.
A
B
C
2 3 4 5 6 7 8 9 10 11 12 13 14 15 16 17 18 19 20 21 22 23 24 25 26 27 28 29 30 31 32 33 34 35 36 37 38 39 40 41 42 43 44 45 46 47 48 49 50 51 52 53 54 55 56 57 58Figure 4. Ultra magnetic liposome (UML) formulations with the commercially available phospholipids (DPPC, DSPC, PEG), the two phospholipids synthesized from DSPE-PEG backbone DSPE-DSPE-PEG-Glu and DSPE-DSPE-PEG-NODA, and the magnetic nanoparticles (γFe2O3). After synthesis NODA@UML and Glu-NODA@UML were radiolabeled with
68
Ga.
Relaxivity measurements
Longitudinal (r1) and transversal (r2) relaxivities of magnetic liposomes as a function of lipid
composition were measured and compared to values from free MNPs. Relaxivities were calculated from linear regression of the variation of the inverse of the relaxation time T1 or T2
versus Fe(III) concentration in the 0.01–0.1 mM range (correlation coefficient > 0.99). Results are tabulated in Table 4.
2 3 4 5 6 7 8 9 10 11 12 13 14 15 16 17 18 19 20 21 22 23 24 25 26 27 28 29 30 31 32 33 34 35 36 37 38 39 40 41 42 43 44 45 46 47 48 49 50 51 52 53 54 55 56 57 58 59
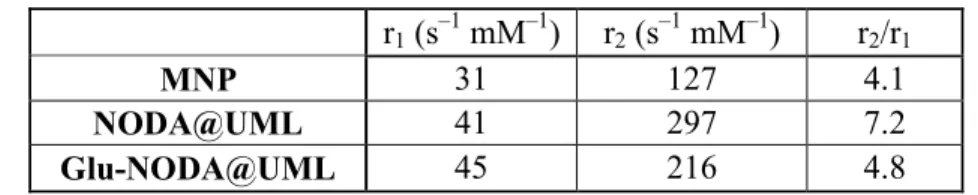
Table 4. Relaxivities r1 and r2 of free MNP compared to the same particles encapsulated inside
liposomes NODA@UML and Glu-NODA@UML r1 (s –1 mM–1) r2 (s –1 mM–1) r2/r1 MNP 31 127 4.1 NODA@UML 41 297 7.2 Glu-NODA@UML 45 216 4.8
Experimentally, the transversal relaxivity r2 (spin–spin relaxation process) was found to be
enhanced after encapsulation into liposomes (Table 4), confirming the efficiency of these systems as T2 contrast agents. Actually, the core of densely packed MNPs generates high r2
values due to the resulting high magnetic moment of the UMLs. It is well known that the higher the local iron concentration, the higher the r2 value is. The lipid bilayer is also likely to
play a role as a barrier to the exchange of water molecules between the interior and the exterior of the liposomes. That is why we observed, experimentally, an increase of the r1 after
encapsulation.
Hence, NODA@UML demonstrated a better MRI efficiency than free NPs. The r2/r1 ratio
increased from 4.1 to 7.2 for MNPs when they became trapped (Table 4). This increase was less pronounced in the case of Glu-NODA@UML, probably due to the lower efficiency in encapsulation of the NPs in the core of the liposomes, as illustrated by their lower r2 values.
This evolution of relaxivity profile favors the efficient detection of UMLs by T2-weighted spin echo sequences and, furthermore, by T2*-weighted gradient echo sequences, which are sensitive to local changes in susceptibility, as used during in vivo imaging of UML accumulation in tumors.
Magnetic resonance imaging
A hyposignal corresponding to dark zones (highlighted with white arrows) appears in the case of magnetic vectorization (Figure 5B) as well as glucose targeting (Warburg effect) (Figure 5D). The combined targeting (magnet + glucose, Figure 5F) also induced a hyposignal in the tumor. Hence, each of the targeting strategies seems to function individually. Whether their effects are additional is difficult to quantify with MRI experiments. This MRI study could not provide quantitative information on tumor uptake.
To demonstrate the ability of 68Ga@UMLs to act as a PET/MRI tracer in vivo and to quantify the amount of tracer in a tumor, a suspension of 68Ga@UMLs was injected into female nude mice bearing two xenografted tumors of glioblastoma.
2 3 4 5 6 7 8 9 10 11 12 13 14 15 16 17 18 19 20 21 22 23 24 25 26 27 28 29 30 31 32 33 34 35 36 37 38 39 40 41 42 43 44 45 46 47 48 49 50 51 52 53 54 55 56 57 58
Figure 5. High-resolution T2-weighted sequence MRI images of solid tumors before injection (A), (C), and (E); and after injection of NODA@UML with magnet (B), Glu-NODA@UML without magnet (D), and Glu-NODA@UML with magnet (F). Tumors are highlighted by the red circles and white arrows show hyposignal pixels.
In vivo PET imaging
At the time of 18F-FDG PET imaging, 3 days before 68Ga@UMLs injection, Vcalliper of tumors
were compared: the right tumor (Tright) volume was no different from the left tumor (Tleft)
volume (418 ± 139 mm3 and 517 ± 220 mm3, respectively, p = n.s.).
18
F-FDG PET imaging, as shown on representative coronal PET images, showed a physiological biodistribution of 18F-FDG (Figures 6A (a ; c). All tumors were clearly visualized with high contrast to background close to the tumor area, indicating high glucose metabolism. PET tumor volume was no different between Tright tumors (335 ± 95 mm3) and
Tleft tumors (334 ± 108 mm3) (p = n.s.). PET imaging analysis demonstrated a similar FDG
uptake in right (Tr; 1.24 ± 0.48 % of IA) and left tumors (Tl; 1.28 ± 0.52 % of IA) (n = 10, p = n.s.) (Figure 6C).
A
B
C
D
E
F
2 3 4 5 6 7 8 9 10 11 12 13 14 15 16 17 18 19 20 21 22 23 24 25 26 27 28 29 30 31 32 33 34 35 36 37 38 39 40 41 42 43 44 45 46 47 48 49 50 51 52 53 54 55 56 57 58 59The magnetic targeting is able to accumulate 68Ga@UML and Glu-68Ga@UML (Figures 6A and B) in the Tright tumor, compared to the non-vectorized contralateral tumor (Tleft). A
statistically significant difference was observed between tumors with magnetic targeting (0.31 ± 0.03 % of IA) and tumors without magnetic targeting (0.13 ± 0.08 % of IA) for 68Ga@UML (*p = 0.001, n = 5) (Figure 6B). However, quantitative analysis shows a trend which was not statistically significant, between tumors with magnet (0.19 ± 0.13 % of IA) and tumors without magnet (0.10 ± 0.03 % of IA) for the glycosylated Glu-68Ga @UML, (p = 0.284, n = 5). (Figure 6B)
Ex vivo biodistribution performed on mice (see SI figure 10) injected with 68Ga-UML liposomes with (w/) or without (w/o) magnet showed high radioactivity accumulation in the liver (around 40 to 50% of ID/g 40 min pot injection) and spleen (10 to 20% of ID/g), which is one of the characteristics in liposome biodistribution. [26]
Ex vivo quantification (Figure 6C) confirmed the positive effect of the magnetic targeting. Without magnetic targeting, the amount of 68Ga@UML accumulated in the tumor was 0.59 ± 0.07 %ID/g, whereas in the presence of magnet the signal reached 1.38 ± 0.16 %ID/g. Such an increase represents a gain of 134% on the targeting efficiency. In the case of Glu-68Ga @UML, only a slight enhancement of 32% of the targeting efficiency was obtained by magnetic targeting (0.78 ± 0.19 %ID/g and 0.54 ± 0.08 %ID/g with and without the magnet, respectively) (Figure 6C). This could be due to the formulation itself as we can see in figure 6A, after the injection of Glu-68Ga@UML (d), a high proportion of the dose remained at the injection point in contrary to what happened after 68Ga@UML injection (b). In fact, the formulation of the liposomes with the glucose derivative probably induces an increase of the viscosity, leading to difficult injection and loss of a fair amount of the radiotracer.
2 3 4 5 6 7 8 9 10 11 12 13 14 15 16 17 18 19 20 21 22 23 24 25 26 27 28 29 30 31 32 33 34 35 36 37 38 39 40 41 42 43 44 45 46 47 48 49 50 51 52 53 54 55 56 57 58
Figure 6. (A) Representative PET images (coronal slices) of mice bearing U87MG tumor on all posterior legs. Acquisitions (10 min static) started 60 min post injection for 18F-FDG and 30 min for 68Ga@UML or 68Ga-Glu@UML. Comparative images of two mice injected with 18 F-FDG (a;c) and, 3 days after, the same mice injected with 68Ga@UML (b) or 68Ga-Glu@UML (d). The magnets were placed only on Tright tumors for UML tracers. The arrows show tumors,
IP: injection point, K: kidneys, L: liver, Spl: spleen, Bl: bladder, M: magnet, Tright and Tleft:
tumors.
(B) PET imaging analysis in tumors expressed as mean % of injected activity (%IA) ± SD. (n = 10/group for 18F-FDG and n = 5 for UML tracers.)
(C) Ex vivo quantification of UML tracers in tumors. Data are expressed as mean %ID/g ± SD. * p < 0.05. 2 3 4 5 6 7 8 9 10 11 12 13 14 15 16 17 18 19 20 21 22 23 24 25 26 27 28 29 30 31 32 33 34 35 36 37 38 39 40 41 42 43 44 45 46 47 48 49 50 51 52 53 54 55 56 57 58 59
Conclusion
In conclusion, we succeed in the synthesis of a new generation of liposomal formulations in which a 68Ga-based radiotracer is attached on the surface of ultra magnetic liposomes, allowing PET and MR imaging to localize and quantify the uptake of the liposomes in the target lesions. The technology developed for the purification of the radiolabeled liposomes is simple and easy to handle in the context of preclinical or clinical studies, with a very high labeling yield and a rapid magnetic purification. The ability of our platform to act as a PET tracer and a MRI contrast agent and to target solid tumors in mice (glioblastoma) was evaluated in vivo. Statistical image analysis shows preferential uptake of the liposome formulation in the tumor bearing the magnet. For the first time, we have been able to quantify the magnetic targeting efficiency ex vivo with a significant gain in tumor targeting. However, the effect of glucose targeting showed contradictory results: positive with MRI, but quantitatively inconclusive with PET. This may be due to the formulation itself that probably needs further optimization. Nonetheless, we have shown that it is possible to associate two targeting agents on this functional, and easy to handle platform. Moreover a drug could be added in the formulation leading to an interesting theranostic platform.
Acknowledgments. This work was supported by the LabEx MiChem part of French state funds managed by the ANR within Le Programme Investissements d'Avenir under reference ANR-11-IDEX-0004-02.
Supporting Information. Mass and NMR spectra of DSPE-PEG-NODA and DSPE-PEG-Glu molecules. High magnification TEM picture of UML. Biodistribution of UMLs.
References
[1] M. Ter-Pogossian, M. Phelps, E. Hoffman, N. Mullani, Radiology 1975, 114, 89–98. A positron-emission transaxial tomograph for nuclear imaging (PETT).
[2] C. Catana, D. Procissi, Y. Wu, M. S. Judenhofer, J. Qi, B. J. Pichler, R. E. Jacobs, S. R. Cherry, Proc. Natl. Acad. Sci. 2008, 105, 3705–3710. Simultaneous in vivo positron emission tomography and magnetic resonance imaging
2 3 4 5 6 7 8 9 10 11 12 13 14 15 16 17 18 19 20 21 22 23 24 25 26 27 28 29 30 31 32 33 34 35 36 37 38 39 40 41 42 43 44 45 46 47 48 49 50 51 52 53 54 55 56 57 58
[3] M. S. Judenhofer, H. F. Wehrl, D. F. Newport, C. Catana, S. B. Siegel, M. Becker, A. Thielscher, M. Kneilling, M. P. Lichy, M. Eichner, et al., Nat. Med. 2008, 14, 459–465. Simultaneous PET-MRI: a new approach for functional and morphological imaging
[4] J. Choi, J. C. Park, H. Nah, S. Woo, J. Oh, K. M. Kim, G. J. Cheon, Y. Chang, J. Yoo, J. Cheon, Angew. Chem. Int. Ed. 2008, 47, 6259–6262. A Hybrid Nanoparticle Probe for Dual-Modality Positron Emission Tomography and Magnetic Resonance Imaging
[5] R. Torres Martin de Rosales, R. Tavaré, R. L. Paul, M. Jauregui-Osoro, A. Protti, A. Glaria, G. Varma, I. Szanda, P. J. Blower, Angew. Chem. Int. Ed. 2011, 50, 5509–5513. Synthesis of 64CuII–Bis(dithiocarbamatebisphosphonate) and Its Conjugation with
Superparamagnetic Iron Oxide Nanoparticles: In Vivo Evaluation as Dual-Modality PET–MRI Agent**
[6] B. J. Pichler, A. Kolb, T. Nägele, H.-P. Schlemmer, J. Nucl. Med. 2010, 51, 333–336. Focus on molecular imaging pet/mri: Paving the Way for the Next Generation of Clinical Multimodality Imaging Applications
[7] G. Strijkers, W. M. Mulder, G. F. van Tilborg, K. Nicolay, Anticancer Agents Med. Chem. 2007, 7, 291–305. MRI contrast agents: current status and future perspectives. [8] G. Béalle, R. Di Corato, J. Kolosnjaj-Tabi, V. Dupuis, O. Clément, F. Gazeau, C. Wilhelm, C. Ménager, Langmuir 2012, 28, 11834–11842. Ultra Magnetic Liposomes for MR Imaging, Targeting, and Hyperthermia
[9] M.-E Fernández Sánchez, S. Barbier, J. Whitehead, G. Béalle, A. Michel, H. Latorre-Ossa, C. Rey, L. Fouassier, A. Claperon, L. Brullé, et al., Nature, 2015, 523, 92–95.
Mechanical induction of the tumorigenic b-catenin pathway by tumour growth pressure [10] B. S. Pattni, V. V. Chupin, V. P. Torchilin, Chem. Rev., 2015, 115 (19), 10938–10966. New Developments in Liposomal Drug Delivery
[11] J. W. Seo, H. Zhang, D. L. Kukis, C. F. Meares, K. W. Ferrara, Bioconjug. Chem. 2008, 19, 2577–2584. A Novel Method to Label Preformed Liposomes with 64Cu for Positron
Emission Tomography (PET) Imaging
[12] A. L. Petersen, T. Binderup, P. Rasmussen, J. R. Henriksen, D. R. Elema, A. Kjær, T. L. Andresen, Biomaterials 2011, 32, 2334–2341. 64Cu loaded liposomes as positron emission tomography imaging agents.
[13] W. T. Phillips, B. A. Goins, A. Bao, Wiley Interdiscip. Rev. Nanomedicine Nanobiotechnology 2009, 1, 69–83. Radioactive liposomes
[14] F. Chen, P. A. Ellison, C. M. Lewis, H. Hong, Y. Zhang, S. Shi, R. Hernandez, M. E. Meyerand, T. E. Barnhart, W. Cai, Angew. Chem. Int. Ed. 2013, 52, 13319–13323. Chelator-Free Synthesis of a Dual-Modality PET/MRI Agent†
[15] B. R. Jarrett, B. Gustafsson, D. L. Kukis, A. Y. Louie, Bioconjug. Chem. 2008, 19, 1496–1504. Synthesis of 64Cu-Labeled Magnetic Nanoparticles for Multimodal Imaging [16] H.-Y. Lee, Z. Li, K. Chen, A. R. Hsu, C. Xu, J. Xie, S. Sun, X. Chen, J. Nucl. Med. 2008, 49, 1371–1379. PET/MRI dual-modality tumor imaging using arginine-glycine-aspartic (RGD)-conjugated radiolabeled iron oxide nanoparticles.
2 3 4 5 6 7 8 9 10 11 12 13 14 15 16 17 18 19 20 21 22 23 24 25 26 27 28 29 30 31 32 33 34 35 36 37 38 39 40 41 42 43 44 45 46 47 48 49 50 51 52 53 54 55 56 57 58 59
[17] C. Glaus, R. Rossin, M. J. Welch, G. Bao, Bioconjug. Chem. 2010, 21, 715–722. In Vivo Evaluation of 64Cu-Labeled Magnetic Nanoparticles as a Dual-Modality PET/MR Imaging Agent
[18] L. K. Shankar, J. M. Hoffman, S. Bacharach, M. M. Graham, J. Karp, A. A.
Lammertsma, S. Larson, D. A. Mankoff, B. A. Siegel, A. V. den Abbeele, et al., J. Nucl. Med. 2006, 47, 1059–1066. Consensus Recommendations for the Use of 18F-FDG PET as an Indicator of Therapeutic Response in Patients in National Cancer Institute Trials [19] A. Hoehne, D. Behera, W. H. Parsons, M. L. James, B. Shen, P. Borgohain, D. Bodapati, A. Prabhakar, S. S. Gambhir, D. C. Yeomans, et al., J. Am. Chem. Soc. 2013, 135 (48), pp 18012–18015 A 18F-Labeled Saxitoxin Derivative for in Vivo PET-MR Imaging of Voltage-Gated Sodium Channel Expression Following Nerve Injury
[20] F. Emmetiere, C. Irwin, N. T. Viola-Villegas, V. Longo, S. M. Cheal, P. Zanzonico, N. Pillarsetty, W. A. Weber, J. S. Lewis, T. Reiner, Bioconjug. Chem. 2013, 24, 1784–1789.18 F-Labeled-Bioorthogonal Liposomes for In Vivo Targeting
[21] R. P. Baum, Theranostics 2012, 2, 437–447. Theranostics: From Molecular Imaging Using Ga-68 Labeled Tracers and PET/CT to Personalized Radionuclide Therapy - The Bad Berka Experience
[22] E. C. Calvaresi, P. J. Hergenrother, Chem. Sci. 2013, 4, 2319–2333. Glucose conjugation for the specific targeting and treatment of cancer.
[23] R. Massart, IEEE Trans. Magn. 1981, 17, 1247–1248. Preparation of aqueous magnetic liquids in alkaline and acidic media.
[24] A. Listkowski, P. Ing, R. Cheaib, S. Chambert, A. Doutheau, Y. Queneau, Tetrahedron: Asymm. 2007, 18, 2201–2210, Carboxymethylglycoside lactones (CMGLs): structural variations on the carbohydrate moiety.
[25] J. Zhu, F. Yan, Z. Guo, R. E. Marchant, J. Colloid Interface Sci. 2005, 289, 542–550. Surface modification of liposomes by saccharides: Vesicle size and stability of lactosyl liposomes studied by photon correlation spectroscopy.
[26] Y.H. Bae, K. Park, J. Control Release, 2011, 153(3), 198-205. Targeted drug delivery to tumors: myths, reality and possibility.
2 3 4 5 6 7 8 9 10 11 12 13 14 15 16 17 18 19 20 21 22 23 24 25 26 27 28 29 30 31 32 33 34 35 36 37 38 39 40 41 42 43 44 45 46 47 48 49 50 51 52 53 54 55 56 57 58
2 3 4 5 6 7 8 9 10 11 12 13 14 15 16 17 18 19 20 21 22 23 24 25 26 27 28 29 30 31 32 33 34 35 36 37 38 39 40 41 42 43 44 45 46 47 48 49 50 51 52 53 54 55 56 57 58 59
TOC 2 3 4 5 6 7 8 9 10 11 12 13 14 15 16 17 18 19 20 21 22 23 24 25 26 27 28 29 30 31 32 33 34 35 36 37 38 39 40 41 42 43 44 45 46 47 48 49 50 51 52 53 54 55 56 57 58