HAL Id: cea-02389534
https://hal-cea.archives-ouvertes.fr/cea-02389534
Submitted on 2 Dec 2019HAL is a multi-disciplinary open access archive for the deposit and dissemination of sci-entific research documents, whether they are pub-lished or not. The documents may come from teaching and research institutions in France or abroad, or from public or private research centers.
L’archive ouverte pluridisciplinaire HAL, est destinée au dépôt et à la diffusion de documents scientifiques de niveau recherche, publiés ou non, émanant des établissements d’enseignement et de recherche français ou étrangers, des laboratoires publics ou privés.
Effect of composition and aging on the porous structure
of metakaolin-based geopolymers
Virginie Benavent, Fabien Frizon, Arnaud Poulesquen
To cite this version:
Virginie Benavent, Fabien Frizon, Arnaud Poulesquen. Effect of composition and aging on the porous structure of metakaolin-based geopolymers. Journal of Applied Crystallography, International Union of Crystallography, 2016, 49 (6), pp.2116-2128. �10.1107/S1600576716014618�. �cea-02389534�
Effect of composition and aging on the porous structure of metakaolin-based
geopolymers
Virginie Benavent1, Fabien Frizon1, Arnaud Poulesquen1,*
1 – CEA, DEN, DTCD, SPDE, LP2C, F-30207 Bagnols-sur-Cèze, France. *Corresponding author: arnaud.poulesquen@cea.fr
Abstract
A combination of intrusive and small-angle scattering techniques is used to characterize the porous structure of metakaolin-based geopolymers. The influence of the geopolymer paste composition and the aging time in a 100% relative humidity environment at 20°C are studied. The effect of the alkali activator, the water amount and the silica amount were investigated. The results show a strong “ink-bottle” effect indicating a two-level pore structure: a meso- and macroporous network. Both alkali activator and water amount have a significant impact on porosity and microstructure in the studied formulation range. After a period of one month, the pore structure is stable over a period of one year except for a small closure of porosity, revealed by nitrogen sorption and small-angle neutron scattering (SANS). These results highlight the geopolymer stability in the curing conditions. For the first time, SANS combined with the contrast matching technique was used to determine a fraction of closed porosity in geopolymer pastes. It was found that the geopolymer porosity is mainly open, the closed porosity representing less than 5% of the pore volume after six months of aging.
Keywords: Geopolymer, porosity, aging
1. Introduction
Geopolymers are aluminosilicate materials having an amorphous structure, obtained by alkali activation of an aluminosilicate source (here metakaolin) at room temperature1. The geopolymer formation takes place according to a well-accepted mechanism of dissolution/restructuring/polycondensation, called geopolymerization, which leads to a solid material with water trapped in the pores2, 3. Many studies highlighted their potential applications in several fields, such as civil engineering or waste management1, 4-9.
According to literature, geopolymers are mesoporous materials10, 11, with a wide pore size distribution and a non-well defined pore form12. Several authors report a pore volume between 30% and 50%13-15. Moreover, the porous network characteristics are highly dependent on the alkali activator (NaOH or KOH), on the alkali solution composition and on the aluminosilicate source. Typically, when potassium is used instead of sodium as the alkali activator, the pore size
decreases and leads to higher specific areas13, 16. It has also been proven that variations in the Si/Al ratio in the alkali solution has a strong influence on the geopolymer microstructure10 and the amount of water initially introduced in the mixture has a huge impact on pore volume, which increases when the amount of water increases17, 18. The porosity controls a lot of properties, such as mechanical and transport properties19, 20, directly linked to the material durability. The evolution of the pore structure has already been investigated at early age21, 22 while only a few studies focused on the long-term evolution of geopolymer materials16, 23.
The aims of this work are to characterize the porous structure of metakaolin-based geopolymer and study the influence of aging, by the means of a multi-technique approach. Similarly to a previous study16, nitrogen sorption, small-angle X-ray scattering (SAXS) and small-angle neutron scattering (SANS) were used. In addition, mercury intrusion porosimetry (MIP) and water porosimetry were performed in order to determine the pore volume and the geopolymer microstructure was observed directly by scanning electron microscopy (SEM). Difficulties have been reported about porosity characterization by intrusive techniques such as nitrogen sorption or MIP. Large mesopores cannot be probed by nitrogen sorption. Significant errors can be obtained on materials having random porosity or when large-diameter pores are accessible only via smaller-diameter pores: this is known as the “ink-bottle effect”. SAXS and SANS are commonly used to characterize porous materials24, 25, including geopolymers22, 23. Contrary to nitrogen sorption, they present the advantage of being non-intrusive techniques and the sample preparation does not require any special treatment which could damage the structure. Both techniques can be used to found the mean pore size. However, the information provided by SAXS and SANS are limited by the range of the scattering vector. In the present study, a combination of these techniques is used to get a full description of the geopolymer porous network. The influence of aging time and of the activation solution chemistry on the porosity is also deeply investigated: nature of the alkali activator, Si/Al ratio and water H2O/Na2O molar ratio are considered. Finally, the proportions of
open and closed porosity were estimated by SANS using the contrast matching technique, which consists in exchanging the pore solution by the geopolymer solid network extinction mixture made of water H2O and heavy water D2O. The pore solution composition was analysed as a function of
time and the porosity evolution was followed for a period of one year by nitrogen sorption.
2. Materials and methods
2.1 Geopolymer synthesis and curing.
Metakaolin-based geopolymers were prepared from the Pieri Premix MK from Grace Construction, which composition can be found elsewhere16 (d10 = 1.8 µm, d50 = 10.3 µm, d90 =
331, Rhodia, purity > 98%), and a sodium silicate solution (Betol 52T, Woellner; 30.2 wt % SiO2,
14.7 wt % Na2O and 55.1 wt % H2O).
Nine geopolymer pastes were prepared by mechanically mixing at 800 rpm metakaolin with a sodium or a potassium silicate solution. A molar ratio Al/M of 1 (M = Na or K) and molar ratios H2O/M2O of 10, 11.5, 13, 15 or 20 and SiO2/M2O of 3.6 or 4 (corresponding to Si/Al of 1.8 and 2,
respectively) were studied. The alkali silicate solution had the nominal composition 𝑥SiO2M2O𝑤H2O, with 𝑥 equal to 1.2 or 1.4 and 𝑤 equal to 10, 11.5, 13, 15 or 20. Below, we
denote for example Na-4-13 the sodium geopolymer formulation with a molar ratio SiO2/Na2O of
4 and H2O/Na2O of 13.
Samples were stored at 298 K and 100% relative humidity during all the curing period to prevent them from drying.
2.2 Pore solution characterization.
A high-pressure device similar to the one of Cyr et al.26 was used to extract the pore solution. At different aging times (1, 7, 14, 30, 90, 180 and 365 days), about 200 g of geopolymer paste were crushed into fragments of 2-5 cm each and were introduced in the extraction device. A loading rate of 0.6 kN.s-1 was applied up to a pressure of 300 MPa. This pressure was maintained for three minutes. About 5-10 mL of pore solution was collected this way, depending of the water molar ratio of the geopolymer paste. The pH value was measured with a dedicated high pH electrode calibrated with buffer solutions between 9 and 13. Part of the pore solution was kept under N2
atmosphere to prevent from further carbonation, while the other part was acidified with nitric acid (2% v/v) for cation chemical analysis by Inductively Coupled Plasma (ICP). Chemical analyses of the anions were performed by anionic chromatography.
2.3 Scanning Electron Microscopy.
SEM imaging was performed on polished sections with a Supra 55 microscope (ZEISS, UK). Prior to analysis, carbon coating was performed to prevent the accumulation of charge at the sample surface. The analysis was performed with 15kV acceleration voltage.
2.4 Porous network characterization by intrusive techniques.
Water porosimetry gives an estimation of the pore volume, for pore sizes from 2 nm up to 2 mm. Samples were saturated in water and under vacuum for at least 72 hours. After complete saturation, the underwater weight and the saturated sample mass were measured. Then, the samples were dried in an oven at 80°C until equilibrium (mass loss less than 0.05% in 24 consecutive hours) and weighted again. Porosity 𝛷 was finally estimated according equation (1):
(1) 𝛷 (%) = 𝑚𝑠𝑎𝑡−𝑚𝑑𝑟𝑦
𝑚𝑠𝑎𝑡−𝑚𝑤𝑎𝑡∗ 100
where 𝑚𝑠𝑎𝑡 is the mass after saturation, 𝑚𝑑𝑟𝑦 the mass after drying and 𝑚𝑤𝑎𝑡 the underwater weight.
To determine the pore size distribution, mercury intrusion porosimetry (MIP) and nitrogen sorption porosimetry were performed, allowing the characterization of pore radius ranging from 3 nm to 400 µm and from 2 to 400 nm, respectively. Before the tests, the samples were freeze-dried, this technique supposing to be less damageable for the microstructure than another drying method in the case of cementitious materials27.
Nitrogen sorption measurements were performed on a Micromeritics ASAP 2020 instrument at 77 K in the relative pressure range P/P0 of 5.10-6-0.99. Because the water in the materials was not fully eliminated by the freeze-drying, all samples were degassed for 2 hours at 90°C and for 10 hours at 350°C under vacuum prior to analysis in order to eliminate the impurities at the material surface. The specific area was determined using the Brunauer-Emmet-Teller (BET) method, and the pore size distribution was calculated on the basis of the desorption branch of the isotherm using the Barret-Joyner-Halenda (BJH) model, which implies a strong approximation on the pore form supposed cylindrical. Pore volumes were calculated from the amount of adsorbed nitrogen at the relative pressure P/P0 of 0.99.
A Micromeritics Autopore IV 9500 was used for the MIP experiments. Pore size distribution was calculated using the Washburn law with a contact angle of 130° and surface tension of 0.485 N/m. First, a low pressure test is practiced to evacuate the gases and fill the sample holder with mercury, and the high pressure test reaches pressures up to 414 MPa.
2.5 Small-angle neutron scattering and Small-angle X-ray scattering.
Porosity was also investigated by the means of scattering techniques, allowing the estimation of the average pore size, the pore volume and the specific area.
SAXS measurements were carried out at the laboratory LIONS (Laboratoire Interdisciplinaire sur l’Organisation Nanométrique et Supramoléculaire, CEA Saclay, France) on thin geopolymer plates of about 500 µm. The X-ray radiation was generated by a Cu rotating anode (λKα-1 = 0.154
nm) and the covered q range was between 0.7 × 10⁻³ and 0.4 Å-1. On some samples, complementary SAXS experiments were made at the ESRF (European synchrotron facility, Grenoble, France) using a USAXS instrument in order to extend the covered q range from 2 × 10⁻⁴ to 1 Å-1. The radiation wavelength was 0.995 Å and the sample-detector distance was 0.76 m and 30.7 m for SAXS and USAXS, respectively.
SANS measurements were performed on the PACE spectrometer at the Laboratoire Léon Brillouin (Orphée Nuclear Reactor, Saclay, France), using two configurations (wavelength λ = 6 Å
and sample-detector distance = 4.7 m, or λ = 17 Å and sample-detector distance = 3 m) to cover the q range between 2.4.10-3 and 1.1.10-1 Å-1. Thin geopolymer plates of about 1 mm were placed between two quartz windows in a sealed cell and the measurements were realized at room temperature on saturated samples with solvents. The data treatment was carried out using the software Pasinet developed at the LLB28. Typically, the obtained signal was corrected for the sample transmission and thickness, the contribution of the empty cell, and normalized by the water scattering to correct for the inhomogeneity of the detector response. At the higher wave vectors, incoherent diffusion due to the solvent was observed and a correction was applied to the diffusion profile in region III in order to get a q-4 evolution, considering the Porod regime observed in SAXS experiments, shown in Fig.1. Further details on the data treatment are given in the Supporting Information in section SI.1.
Corrected SANS and SAXS diffusion profiles can be divided in three regions:
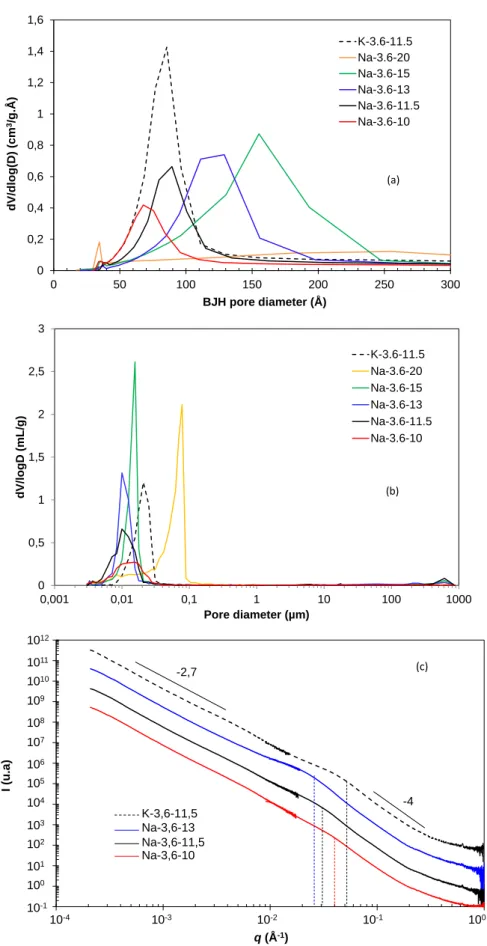
(I) At low q, the first region where the intensity decreases as a function of q-D, and where the exponent D represents the mass fractal dimension of the solid network structure. D is close to 2.7 in USAXS. This fractal dimension is actually very similar to the one of the metakaolin16. Differences in D value obtained with SANS are explained in the section SI.1 of the supporting information.
(II) A transition region between region I and region III, corresponding to the diffusion of the mesoporous network.
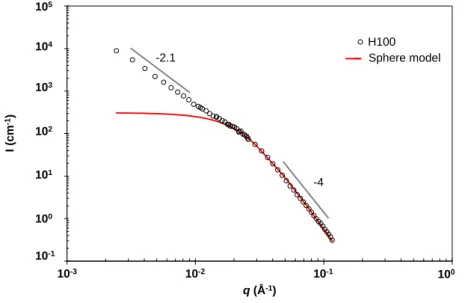
(III) At higher q, the intensity varies as q-4 (Porod regime29), which is characteristic of a smooth interface between the solid network and the pores containing the pore solution.
From SAXS and SANS measurements, a characteristic size of the porous network can be estimated using a strong approximation on the pore form, i.e. a sphere model convoluted with a lognormal distribution of radii. The form factor 𝑃(𝑞) for a sphere of radius 𝑅 is given by equation (2).
(2) 𝑃(𝑞) = {3[sin(𝑞𝑅)−𝑞𝑅𝑐𝑜𝑠(𝑞𝑅)](𝑞𝑅)3 }2
The function 𝑓(𝑅, 𝑅0,𝑞) of a lognormal distribution for polydisperse spheres of radius 𝑅, with a median radius 𝑅0, and a standard deviation 𝜎, is given by equation (3).
(3) 𝑓(𝑅, 𝑅0, 𝑞) = 𝑁𝑜𝑟𝑚1 𝑒{−2𝜎21 [ln ( 𝑅
𝑅0)]
2 }
Pore volume and specific area were estimated only from SANS data because it was not possible to control the sample saturation in the SAXS experiments. This can induce errors in the intensity level and false the data analysis. The quantity of interface Σ (m-1) is given by the Porod limit (4):
(4) 𝛴𝑝𝑜𝑟𝑒𝑠= lim𝑞 →∞𝐼(𝑞)𝑞4 2𝜋𝛥𝜌2
where 𝛥𝜌2 is the contrast between the scattering length densities of the solid network and of the pore fluid. The specific area was obtained from the quantity of interface by dividing by the volume fraction of solid 𝛷𝑠 and by the solid density d, which has been measured with the helium pycnometer Micromeritics AccuPyc II 1340 (dNa-geo = 2.3 ± 0.05 g.cm-3 and dK-geo = 2.4 ± 0.05
g.cm-3). 𝛷𝑠have been calculated from the water porosimetry measurement by:
(5) 𝛷𝑠 = 1 − 𝛷
SANS experiments were also realised to found out the proportions of closed and open porosity in the geopolymer pastes, using the contrast matching method. The principle of the experiment is illustrated in Fig.3 and explained below.
Prior to analysis, the pore solution of the samples have been exchanged by immersing the geopolymer plates for at least 72h in pure water (Fig.3a) or in the extinction mixture (Fig.3b), which is an isotopic mixture of H2O and D2O corresponding to the extinction in terms of the
contrast of the geopolymer solid network. The volumetric composition of the extinction mix H2O/D2O was found in a previous study16: 29.3/70.7 (v/v) and 34.8/65.2 (v/v) for sodium and
potassium geopolymers, respectively. After the geopolymer synthesis, both open and closed porosities are filled with an aqueous solution, and the contrast 𝛥𝜌2 between the solid network and
the solvent inside the porosity leads to the diffusion signal, as described by equation (6): (6) 𝐼(𝑞) = 𝜑𝑉𝛥𝜌2𝑃(𝑞)𝑆(𝑞)
where 𝜑 is the volume fraction of the solute, 𝑉 the volume fraction of the diffusing entities, 𝛥𝜌 the difference in scattering length densities, 𝑃(𝑞) is the form factor describing the size and shape of the diffusing entities, and 𝑆(𝑞) is the structure factor describing the interactions between entities. The extinction mixture penetrates only in the open porosity, the closed porosity remaining inaccessible. Since it has the same scattering length density as the geopolymer solid network, there is no contrast between the open porosity and the solid. As a consequence, the diffusion profile results only from the contrast between the solid network and the closed porosity.
3. Results and discussion
3.1 Effect of the alkali activator.
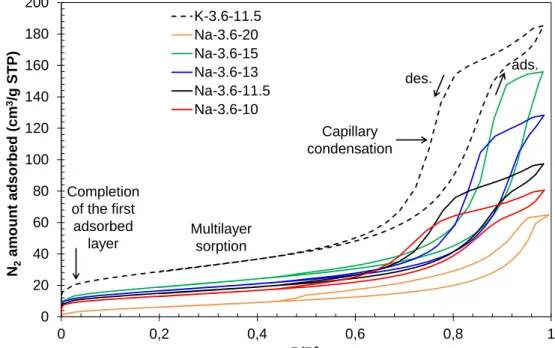
Nitrogen sorption isotherms obtained on different geopolymer pastes are shown in Fig.4. The isotherms of the geopolymer pastes Na-3.6-11.5 and K-3.6-11.5 are type IV isotherms according
to the IUPAC classification30, attributed to mesoporous materials and characterized by: an inflexion point at low P/P0 corresponding to the completion of the first adsorbed layer and the beginning of multi-layer sorption, and a rapid increase of nitrogen sorption, attributed to capillary condensation in the mesopores at higher P/P0.
The pore volume and the specific area of the potassium geopolymer are higher than the ones of the sodium geopolymer with the same nominal composition, whatever the experimental technique employed as reported in Table 1 and Table 2. These results are in agreement with Steins et al.16, who showed that the use of the potassium activator leads to higher porosity and smaller pore sizes, when the alkali silicate solution is prepared with the same silicate source, i.e. in both cases with precipitated silica or with a commercial silicate solution.
In our case, Fig.5a shows that the sodium and the potassium geopolymer have about the same pore size distribution. The very first peak between 30 and 40 Å is an artifact31. However, the potassium activating solution have been prepared from amorphous silica and KOH pellets, while the sodium geopolymer have been prepared from a ready-to-use commercial sodium silicate solution, in which NaOH pellets and water were added to obtain the desired composition. This demonstrates that bigger pore sizes are obtained by making the silicate solution from amorphous silica, probably because the dissolution of silica particles was not complete, leading to a lower condensation degree in the aluminosilicate network of the final material. This result highlights the importance of the raw materials in the composition of the alkali silicate solution to control the pore sizes.
3.2 Effect of the formulation molar ratios.
The formulation molar ratios of the geopolymer pastes have an impact on pore volume, pore size distribution, and specific area. The effect of the H2O/M2O ratio is significant on both pore volume
and pore size, while the impact of the SiO2/M2O ratio is less important.
An increase in the water ratio H2O/M2O from 10 to 15 leads to an increase in the geopolymer
paste porosity and in the mean pore size. The pore volume increases whatever the experimental technique, as reported in Table 1. BJH calculations on nitrogen sorption isotherms presented in Fig.5a show that the pore size distribution broadened and was centered on higher pore sizes. In the SANS experiments, the position of the transition region is characteristic of the mean size the pores. This position is roughly designated in Fig.5 by a dotted line and is shifted towards lower q values, meaning the mean pore size increases by increasing the amount of water in the geopolymer pastes. Results obtained from the sphere model are reported in Table 2 together with the results from the other techniques. All techniques show the same trend, but as expected MIP was less appropriate to differentiate the geopolymer paste mesoporosity for low water contents, i.e. for
small pore sizes. Although in most cases the specific area was increasing slightly with water content, this trend was not confirmed by SANS results.
These results show that the water initially introduced in the mixture during the geopolymerization reactions plays an important role in the formation of the porous network. As water remains trapped in the final material, it is responsible for the geopolymer pore volume and mean pore size. Increasing the water ratio H2O/M2O up to 20 leads to a macroporous geopolymer, as it can be seen
in Fig.5b. This geopolymer nitrogen sorption isotherm was attributed to a type II isotherm according to the IUPAC classification (see Fig.4) and the BJH calculation in Fig.5a does not have any meaning.
The SiO2/Na2O ratio had only a small influence on pore volume and pore sizes, which decrease
slightly by increasing SiO2/Na2O from 3.6 to 4. The highest impact was observed on the nitrogen
sorption isotherms in Fig.6, when H2O/Na2O was equal to 10.
3.3 Open and closed porosity.
The fractions of closed and open porosity of the solid geopolymer were estimated using the contrast variation technique on seven formulations.
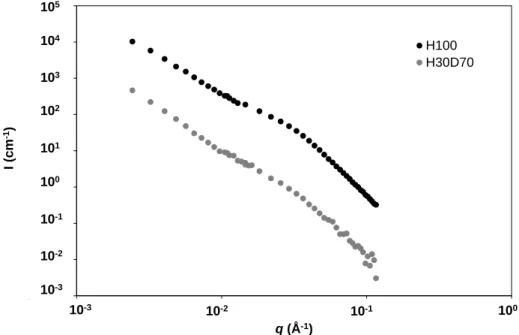
The scattering patterns of the one-month geopolymer Na-3.6-11.5 in water (H100) and in the extinction mixture (H30D70) in Fig.7 are an example of results. In the case of the sample in the isotopic mixture, the scattered intensity is more than one order of magnitude lower, because of the extinction of the open porosity. The pore volume 𝑉𝐻30𝐷70 found by fitting with a sphere model the scattering pattern of the geopolymer paste immersed in the extinction mixture (H30D70) is attributed to closed porosity, while the pore volume 𝑉𝐻100 estimated from the scattering pattern of
the same geopolymer paste in water (H100) is attributed to the total pore volume.
The fraction of closed porosity 𝛷𝑐𝑙𝑜𝑠𝑒𝑑 is the ratio between the two pore volumes 𝑉𝐻30𝐷70/𝑉𝐻100. 𝛷𝑐𝑙𝑜𝑠𝑒𝑑 (%) is reported in Table 3 for all the samples. At the age of one month, the porous network of all the geopolymer pastes is mainly connected, since only a small proportion of closed porosity was determined, representing less than 5 % of the total pore volume.
3.4 Evidence regarding a two-level pore structure: a meso- and macroporous network.
Contrary to materials with a well-defined pore structure (MCM-4132-34 and SBA-1535 mesoporous silica, etc..), no clear saturation plateau was observed on the nitrogen isotherms in Fig.4, after the capillary condensation had happened in the mesopores, probably because of the so-called “ink-bottle effect”36
happening when large-diameter pores are accessible via small-diameter pores. Moreover, the values of total porosity evaluated from neutron scattering were much smaller than the porosity determined from the other characterization techniques (see Table 1). However, in the
SANS experiments, the probed pore volume is the one whose characteristic pore size is located in the available wave vector range: that is to say mesoporosity. If the geopolymer pastes had another characteristic pore size not detectable in this q range, then the pore volume have been underestimated from the experiments. This “missing” pore volume could be either microporosity or macroporosity. The hypothesis of microporosity is ruled out in section SI.2 of the Supporting Information after t-plot calculations. Thus, the difference in pore volume between SANS and the other technique is attributed to macroporosity.
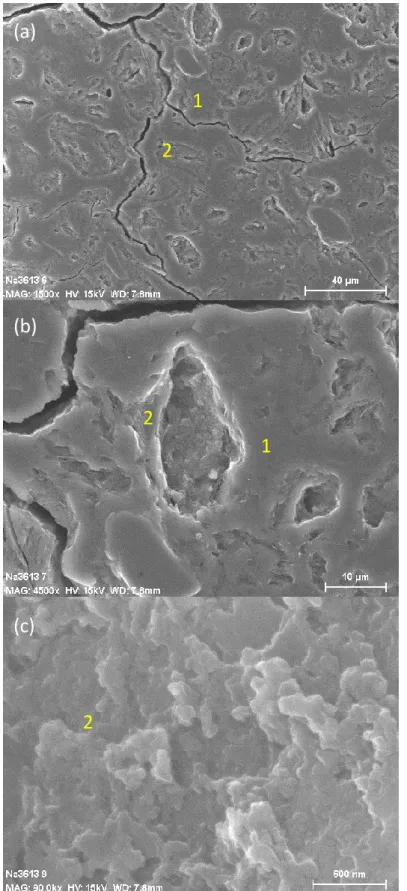
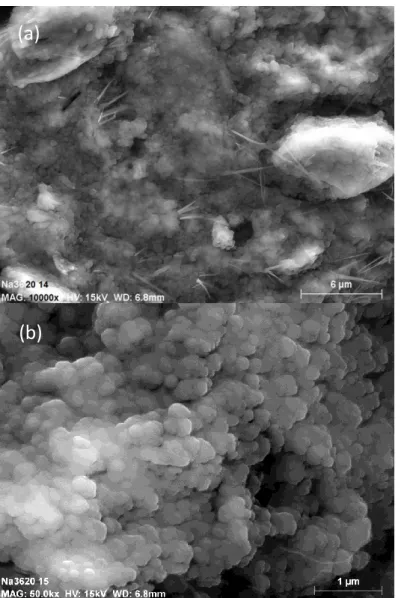
These observations are in agreement with literature17, 37. Provis et al.37 conducted X-ray microtomography with a resolution of 0.75 µm on alkali activated binders and reported a pore volume between 25% and 35%. Such big porosity should be observable by SEM and two zones are clearly identified on the micrographs of a polished section of the geopolymer paste Na-3.6-13 in Fig.8. The microcracks are probably due to the under vacuum drying during the carbon coating phase. The first smooth-looking zone is the dense amorphous and mesoporous geopolymer paste, while the second one is attributed to a porous region resulting from the partial dissolution of metakaolin, which leaves the print of metakaolin grains in the microstructure. The size of these pores can reach several tenths of micrometers, similarly to metakaolin grains. Fig.8c is a picture of the inside of a pore, which shows the irregular pore surface. Macropores are not connected together, which could explain that the MIP data did not show any macroporosity. They would be connected by the means of the mesoporous network. A similar conclusion was drawn by Lloyd et al.17 on observations made on alkali activated fly ashes. They suggested that a large part of the pore volume exists in the cavities left by the dissolution of fly ash particles. Contrary to all the other formulations, SEM observations on the geopolymer paste Na-3.6-20 in Fig.9 show a porous microstructure fully made of agglomerated entities, and the two different zones cannot be identified anymore. Some carbonation was observed on the sample surface.
3.5 Geopolymer paste evolution.
Both nitrogen sorption and SANS highlighted the great stability of the geopolymer pastes kept at 20°C in a 100% relative humidity environment for a period of one year.
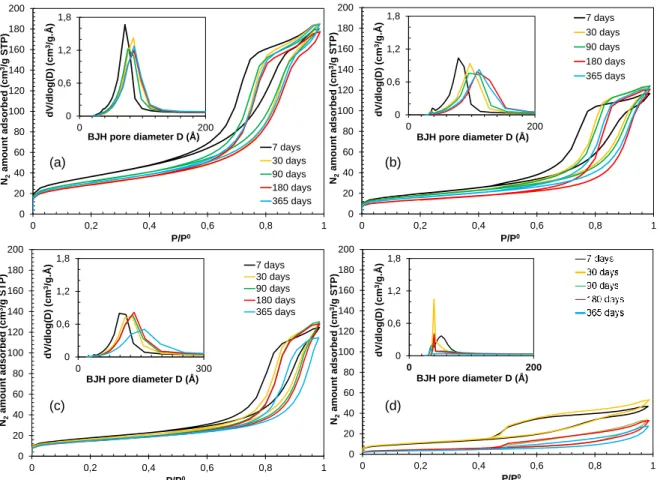
Nitrogen sorption was performed at different aging time (7, 30, 90, 180 and 365 days) and the isotherms obtained on four formulations are shown in Fig.10. A significant evolution is observed between 7 and 30 days, showing that the porous network formation was not completed even 7 days after the macroscopic setting time of the material. After 30 days of aging time, there is only a slow evolution of the geopolymer pastes. For some samples, like K-3.6-11.5 in Fig.10a, there is almost no evolution. For other samples, in Fig.10b and Fig.10c, the pore volume becomes slightly
lower and the capillary condensation phenomenon shifts towards higher P/P0. As a consequence, the pore size distribution calculated with BJH method moves towards bigger pore sizes. These small evolutions are attributed to the partial closure of porosity over time. The strongest evolution is observed for the geopolymer Na-4-10 in Fig.10d.
To confirm the closure of the porosity and to quantify it, SANS experiments were performed again on the geopolymer pastes aged of six months, and the results were compared with the ones previously obtained at one month. The results, reported in Table 3, show a slight increase in closed porosity after six months, for all the sodium geopolymers, but not for the potassium geopolymer. Still, it is important to notice that in the nitrogen sorption experiments, the variation in the pore volume was sometimes visible only after a period of one year, and that there was no evolution for the potassium geopolymer. This can explain there is no difference for the potassium geopolymer in the SANS experiments either. In all cases, the closure phenomenon is small and the geopolymer paste porosity remains mainly opened after a period of six months.
The mechanism responsible for the closure of porosity is still unknown but four assumptions can be formulated:
(1) The geopolymerization reactions are still ongoing after 30 days and there is consumption of ionic species in the pore solution.
(2) There is a phase precipitation in the pore solution at the pore surface. (3) There is a densification of the solid network.
(4) A dissolution-reprecipitation mechanism occurs at the pore wall/pore solution interface. The two first assumptions could explain the closure of the smallest pores but not the enlargement of the biggest pores observed by nitrogen sorption. Moreover, the extraction and the chemical analysis of the pore solution at different times have been realized. The results are shown in Fig.11 for the geopolymer pastes Na-3.6-11.5 and K-3.6-11.5 and no significant change in the pore solution composition or in the pH value is observed after 7 days. The pore solution composition evolves clearly only between 1 and 7 days. No densification of the solid network has been highlighted. However, porosity evolution due to a dissolution-reprecipitation process has been previously observed in porous silica MCM-4125 filled with water, causing similar consequences on nitrogen sorption results: decrease in pore volume and modification of the pore size distribution. Although confirmation is needed, it is possible that this kind of mechanism happens in the geopolymer porosity. Dissolution would happen in the larger part of the pores and precipitation in the smaller pores, causing pore clogging.
This study concerns the impact of the geopolymer paste chemistry on porosity and on their evolution at 20°C in a 100% relative humidity environment.
In agreement with previous literature data, the alkali activator choice has an impact on pore volume and specific area, but the raw materials have an impact on the pore size distribution. The effect of the molar ratio H2O/M2O is significant on both pore volume and pore size, while the
SiO2/M2O ratio has almost no impact in the studied range. Increasing the water ratio up to a
certain point can lead to a macroporous geopolymer. Besides, a significant part of the pore volume is due to cavities of several micrometers left by the partial dissolution of metakaolin particles. From SEM observations, these macropores do not seem connected together, which implies a strong “ink-bottle effect” on the nitrogen sorption isotherms and on MIP results.
Between seven days and one month of aging, the nitrogen sorption results show a strong evolution of the porous network. It was clear that the geopolymer network is not completely formed even one week after the macroscopic setting time. After a period of one month, the evolution is much lower. The results highlight the durability of the geopolymer pastes in terms of their evolution in a 100% relative humidity environment for a period of one year. In most cases, the pore size distribution remains unchanged or is slightly shifted towards bigger pore size. In addition, a slight decrease in the open pore volume is observed, attributed to a small closure of the porosity with time. SANS results confirmed those results but showed that the geopolymer porosity is widely open at 1 month and remains mainly open after a period of six months. At this stage of the study, a dissolution-reprecipipation mechanism occurring at the pore wall interface is supposed to explain theses evolutions.
Acknowledgments
This work benefited from SasView software, originally developed by the DANSE project under NSF award DMR-0520547. The authors thank Olivier Diat (ICSM), Olivier Tache (LIONS), Sylvain Prevost (ESRF) and Jacques Jestin (LLB) for their help with angle X-ray and small-angle neutron scattering measurements, Karine Ressayre for ionic chromatography and Adrien Gerenton for MIP experiments.
Figures
Figure 1 – Ultra Small-angle X-ray scattering and Small-angle X-ray scattering intensity versus scattering vector modulus for the geopolymer formulation Na-3.6-11.5 aged of one month.
Figure 2 - Small-angle neutron scattering profile of the geopolymer paste Na-3.6-11.5 saturated in water (H100) fitted by a sphere model.
1,E-03 1,E-02 1,E-01 1,E+00 1,E+01 1,E+02 1,E+03 1,E+04 1,E+05 1,E+06 1,E+07 1,E+08 1,E+09 1,E+10 1,E+11 0,001 0,01 0,1 1 10 100 I (c m -1) q (Å-1) -2.7 -4 Porod regime I II III USAXS SAXS 10-3 10-2 10-1 100 101 102 103 104 105 106 107 108 109 1010 1011 10-4 10-3 10-2 10-1 100 101 1,00E-01 1,00E+00 1,00E+01 1,00E+02 1,00E+03 1,00E+04 1,00E+05
1,00E-03 1,00E-02 1,00E-01 1,00E+00
I (c m -1) q (Å-1) H100 Série4 10-1 100 101 102 103 104 105 10-3 10-2 10-1 100 Sphere model -2.1 -4
Figure 3 –Schematic diagram illustrating the measurement of closed porosity by small-angle neutron scattering with the contrast matching method.
Figure 4- Effect of the water ratio H2O/M2O and alkali activator on the nitrogen
sorption isotherms of geopolymer pastes.
(a) (b) 0 20 40 60 80 100 120 140 160 180 200 0 0,2 0,4 0,6 0,8 1 N2 am ou nt ads orbed (cm 3/g STP) P/P0 K-3.6-11.5 Na-3.6-20 Na-3.6-15 Na-3.6-13 Na-3.6-11.5 Na-3.6-10 Completion of the first adsorbed layer Multilayer sorption Capillary condensation ads. des.
Figure 5 - Effect of water ratio H2O/M2O and alkali activator on the pore size
distribution of different geopolymer pastes obtained by (a) nitrogen sorption porosimetry, (b) MIP, and (c) SAXS.
0 0,2 0,4 0,6 0,8 1 1,2 1,4 1,6 0 50 100 150 200 250 300 dV /dlog (D) (cm 3/g.Å ) BJH pore diameter (Å) K-3.6-11.5 Na-3.6-20 Na-3.6-15 Na-3.6-13 Na-3.6-11.5 Na-3.6-10 (a) 0 0,5 1 1,5 2 2,5 3 0,001 0,01 0,1 1 10 100 1000 dV/ lo gD (mL/g ) Pore diameter (µm) K-3.6-11.5 Na-3.6-20 Na-3.6-15 Na-3.6-13 Na-3.6-11.5 Na-3.6-10 (b) 1,00E-01 1,00E+00 1,00E+01 1,00E+02 1,00E+03 1,00E+04 1,00E+05 1,00E+06 1,00E+07 1,00E+08 1,00E+09 1,00E+10 1,00E+11 1,00E+12 0,001 0,01 0,1 1 10 q (Å-1) -2,7 -4 K-3,6-11,5 Na-3,6-13 Na-3,6-11,5 Na-3,6-10 (c) 10-1 100 101 102 103 104 105 106 107 108 109 1010 1011 1012 I (u.a) 10-1 10-2 10-3 10-4 100
Figure 6 - Effect of the silica ratio SiO2/M2O on the nitrogen sorption isotherms of
one-month aged geopolymer pastes and H2O/Na2O = 13, 11.5 or 10.
Figure 7 - Small-Angle Neutron Scattering patterns of the one-month geopolymer paste Na-3.6-11.5. The black points stand for the sample in water (H100), and the grey points stand for the sample in the extinction mix (H30D70).
0 20 40 60 80 100 120 140 0 0,2 0,4 0,6 0,8 1 N2 am ou nt a dsorbed (cm 3/g STP) P/P0 Na-4-13 Na-3.6-13 0 20 40 60 80 100 120 0 0,2 0,4 0,6 0,8 1 N2 am ou nt ads orbed (cm 3/g STP) P/P0 Na-4-11.5 Na-3.6-11.5 0 10 20 30 40 50 60 70 80 90 100 0 0,2 0,4 0,6 0,8 1 N2 am ou nt a dsorbed (cm 3/g STP) P/P0 Na-4-10 Na-3.6-10 1,00E-03 1,00E-02 1,00E-01 1,00E+00 1,00E+01 1,00E+02 1,00E+03 1,00E+04 1,00E+05
1,00E-03 1,00E-02 1,00E-01 1,00E+00
I (c m -1) q (Å-1) H100 H30D70 10-3 10-2 10-1 100 101 102 103 104 105 10-3 10-2 10-1 100
Figure 8 – SEM micrographs of the one-month aged geopolymer paste Na-3.6-13 at different scales.
(a)
(b)
(c)
1
2
1
2
2
Figure 9 – SEM micrographs of the one-month aged geopolymer paste Na-3.6-20.
(a)
Figure 10 - Effect of aging time on the nitrogen sorption isotherms and pore size distribution of the geopolymer pastes (a) K-3.6-11.5, (b) Na-4-13, (c) Na-3.6-13 and (d) Na-4-10.
Figure 11 – Evolution of the pore solution chemical composition and pH value of the geopolymer paste (a) Na-3.6-11.5 and (b) K-3.6-11.5.
0 20 40 60 80 100 120 140 160 180 200 0 0,2 0,4 0,6 0,8 1 N2 am ou nt a dsorbed (cm 3/g STP) P/P0 7 days 30 days 90 days 180 days 365 days 0 0,6 1,2 1,8 0 200 dV/ dl og (D) (cm 3/g .Å) BJH pore diameter D (Å) 0 20 40 60 80 100 120 140 160 180 200 0 0,2 0,4 0,6 0,8 1 N2 am ou nt a dsorbed (cm 3/g STP) P/P0 7 days 30 days 90 days 180 days 365 days 0 0,6 1,2 1,8 0 200 dV/ dl og (D) (cm 3/g .Å) BJH pore diameter D (Å) (a) (b) 0 20 40 60 80 100 120 140 160 180 200 0 0,2 0,4 0,6 0,8 1 N2 am ou nt ads orbed (cm 3/g ST P) P/P0 0 0,6 1,2 1,8 0 200 dV /dlog (D ) (cm 3/g.Å ) BJH pore diameter D (Å) (d) 0 20 40 60 80 100 120 140 160 180 200 0 0,2 0,4 0,6 0,8 1 N2 amou n t adso rbed (cm 3/g ST P) P/P0 7 days 30 days 90 days 180 days 365 days 0 0,6 1,2 1,8 0 300 dV /dlog (D) (cm 3/g.Å ) BJH pore diameter D (Å) (c) 0 200 400 600 800 1000 1 7 14 30 90 180 365 Con cent ration (mmo l/L) Age (days) (b) 0 5 10 15 20 25 1 7 14 30 90 180 365 Con cent ration (m mo l/L) Age (days) (a) 0 200 400 600 800 1000 1 7 14 30 90 180 365 Con cent ration (m mo l/L) Age (days) 0 30 60 90 120 150 1 7 14 30 90 180 365 Con cent ration (m mo l/L) Age (days) pH = 13 13 13 13 13 13 13 13 13 13 13 13 pH = 13
Tables
Table 1 – Volumic percent porosity of one-month aged geopolymers obtained with different techniques.
Water porosimetry (%) Mercury
intrusion (%) Nitrogen sorption (%) SANS (%) Na-3.6-20 - 54 - - Na-3.6-15 - 45 36 - Na-3.6-13 46 43 32 6.2 Na-3.6-11.5 43 37 28 5.9 Na-3.6-10 41 24 23 5.3 Na-4-13 45 40 30 6.1 Na-4-11.5 42 32 28 5.4 Na-4-10 39 18 17 4.3 K-3.6-11.5 46 43 41 7.0
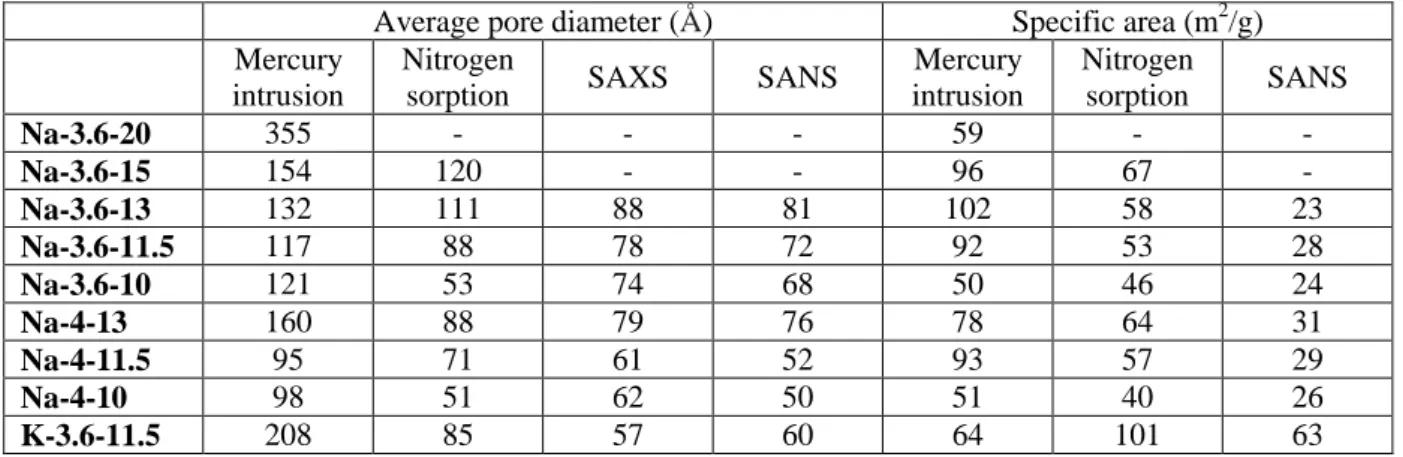
Table 2 - Average pore diameter and specific area of one-month geopolymer pastes determined by different techniques.
Average pore diameter (Å) Specific area (m2/g)
Mercury intrusion
Nitrogen
sorption SAXS SANS
Mercury intrusion Nitrogen sorption SANS Na-3.6-20 355 - - - 59 - - Na-3.6-15 154 120 - - 96 67 - Na-3.6-13 132 111 88 81 102 58 23 Na-3.6-11.5 117 88 78 72 92 53 28 Na-3.6-10 121 53 74 68 50 46 24 Na-4-13 160 88 79 76 78 64 31 Na-4-11.5 95 71 61 52 93 57 29 Na-4-10 98 51 62 50 51 40 26 K-3.6-11.5 208 85 57 60 64 101 63
Table 3 - Volumetric percent of closed porosity found by small-angle neutron scattering.
𝛷𝑐𝑙𝑜𝑠𝑒𝑑 (%) 𝛷𝑐𝑙𝑜𝑠𝑒𝑑 (%) 1 month 6 months Na-3.6-13 2.7 4.1 Na-3.6-11.5 1.5 2.5 Na-3.6-10 2.0 3.2 Na-4-13 1.8 2.8 Na-4-11.5 1.9 2.5 Na-4-10 1.5 2.8 K-3.6-11.5 0.7 0.5 References
(1) Duxson, P.; Fernández-Jiménez, A.; Provis, J.; Lukey, G.; Palomo, A.; Van Deventer, J. Geopolymer technology: the current state of the art. J. Mater. Sci. 2007, 42, 2917-2933.
(2) Xu, H.; Van Deventer, J.S.J. The geopolymerisation of alumino-silicate minerals. Int. J. Miner. Process. 2000, 59, 247-266.
(3) Dimas, D.; Giannopoulou, I.; Panias, D. Polymerization in sodium silicate solutions: a fundamental process in geopolymerization technology. J. Mater. Sci. 2009, 44, 3719-3730.
(4) Provis, J.L.; Van Deventer, J.S.J. Geopolymers: structures, processing, properties and industrial applications, Woodhead Publishing, Abingdon UK. 2009.
(5) Palomo, A.; Lopez de la Fuente, J.I. Alkali-activated cementitous materials: Alternative matrices for the immobilisation of hazardous wastes: Part I. Stabilisation of boron. Cem. Concr. Res. 2003, 33, 281-288.
(6) Palomo, A.; Palacios, M. Alkali-activated cementitious materials: Alternative matrices for the immobilisation of hazardous wastes: Part II. Stabilisation of chromium and lead. Cem. Concr. Res. 2003, 33, 289-295.
(7) Rooses, A.; Steins, P.; Dannoux-Papin, A.; Lambertin, D.; Poulesquen, A.; Frizon, F. Encapsulation of Mg–Zr alloy in metakaolin-based geopolymer. Appl. Clay Sci. 2013, 73, 86-92.
(8) Roy, D.M. Alkali-activated cements Opportunities and challenges. Cem. Concr. Res. 1999, 29, 249-254.
(9) Cantarel, V.; Nouaille, F.; Rooses, A.; Lambertin, D.; Poulesquen, A.; Frizon, F. Solidification/stabilisation of liquid oil waste in metakaolin-based geopolymer. J. Nucl. Mater. 2015, 464, 16-19.
(10) Duxson, P.; Provis, J.L.; Lukey, G.C.; Mallicoat, S.W.; Kriven, W.M.; Van Deventer, J.S.J. Understanding the relationship between geopolymer composition, microstructure and mechanical properties. Colloids Surf., A. 2005, 269, 47-58.
(11) Glad, B.E.; Kriven, W.M. Optimization of Gas Adsorption Porosimetry for Geopolymer Analysis. J. Am. Ceram. Soc. 2013, 96, 3643-3649.
(12) Maitland, C.F.; Buckley, C.E.; O'Connor, B.H.; Butler, P.D.; Hart, R.D.
Characterization of the pore structure of metakaolin-derived geopolymers by neutron scattering and electron microscopy. J. Appl. Crystallogr., 44, 697-707.
(13) Bell, J.L.; Kriven, W.M. Nanoporosity in Aluminosilicate, Geopolymeric Cements. Microscopy and Microanalysis 2004, 10, 590-591.
(14) Fernandez-Jimenez, A.; Macphee, D.E.; Lachowski, E.E.; Palomo, A. Immobilization of cesium in alkaline activated fly ash matrix. J. Nucl. Mater. 2005, 346, 185-193. (15) Skvara, F.; Kopecky, L.; Nemecek, J.; Bittnar, Z. Microstructure of geopolymer
materials based on fly ash. Ceramics-Silikaty 2006, 50, 208-215.
(16) Steins, P.; Poulesquen, A.; Frizon, F.; Diat, O.; Jestin, J.; Causse, J.; Lambertin, D.; Rossignol, S. Effect of aging and alkali activator on the porous structure of a
geopolymer. J. Appl. Crystallogr. 2014, 47, 316-324.
(17) Lloyd, R.R.; Provis, J.L.; Smeaton, K.J.; van Deventer, J.S.J. Spatial distribution of pores in fly ash-based inorganic polymer gels visualised by Wood’s metal intrusion. Microporous and Mesoporous Materials 2009, 126, 32-39.
(18) Steveson, M.; Sagoe-Crentsil, K. Relationships between composition, structure and strength of inorganic polymers. J. Mater. Sci. 2005, 40, 2023-2036.
(19) Boher, C.; Frizon, F.; Lorente, S.; Bart, F. Influence of the pore network on hydrogen diffusion through blended cement pastes. Cem. Concr. Compos. 2013, 37, 30-36. (20) Boher, C.; Martin, I.; Lorente, S.; Frizon, F. Experimental investigation of gas
diffusion through monomodal materials. Application to geopolymers and Vycor® glasses. Microporous and Mesoporous Materials 2014, 184, 28-36.
(21) Rovnaník, P. Effect of curing temperature on the development of hard structure of metakaolin-based geopolymer. Construction and Building Materials 2010, 24, 1176-1183.
(22) Steins, P.; Poulesquen, A.; Diat, O.; Frizon, F. Structural Evolution during
Geopolymerization from an Early Age to Consolidated Material. Langmuir 2012, 28, 8502-8510.
(23) Melar, J.; Renaudin, G.; Leroux, F.; Hardy-Dessources, A.; Nedelec, J.-M.; Taviot-Gueho, C.; Petit, E.; Steins, P.; Poulesquen, A.; Frizon, F. The Porous Network and its Interface inside Geopolymers as a Function of Alkali Cation and Aging. J. Phys. Chem. C 2015, 119, 17619-17632.
(24) Ramsay, J.D.F. Surface and pore structure characterisation by neutron scattering techniques. Adv. Colloid Interface Sci. 1998, 76–77, 13-37.
(25) Gouze, B.; Cambedouzou, J.; Parrès-Maynadié, S.; Rébiscoul, D. How hexagonal mesoporous silica evolves in water on short and long term: Role of pore size and silica wall porosity. Microporous and Mesoporous Materials 2014, 183, 168-176.
(26) Cyr, M.; Rivard, P.; Labrecque, F.; Daidie, A. High Pressure Device for Fluid Extraction from Porous Materials: Application to Cement Based Materials. J. Am. Ceram. Soc. 2008, 91, 2653-2658.
(27) Gallé, C. Effect of drying on cement-based materials pore structure as identified by mercury intrusion porosimetry: A comparative study between oven-, vacuum-, and freeze-drying. Cem. Concr. Res. 2001, 31, 1467-1477.
(28) Brûlet, A.; Lairez, D.; Lapp, A.; Cotton, J.-P. Improvement of data treatment in small-angle neutron scattering. J. Appl. Crystallogr. 2007, 40, 165-177.
(29) Porod, G. Kolloid-Z. 1952, 124, 108.
(30) Rouquerol, J.; Avnir, D.; Fairbridge, C.W.; Everet, D.H.; Pernicone, N.; Ramsay, J.D.F.; Sing, K.S.W.; Unger, K.K. Recommendations for the characterization of porous solids (Technical Report). Pure Appl. Chem. 1994, 66, 1739-1758.
(31) Lu, G.Q.; Zhao, X.S. Nanoporous materials: science and engineering, World Scientific. Vol. 4. 2004.
(32) Naono, H.; Hakuman, M.; Tanaka, T.; Tamura, N.; Nakai, K. Porous Texture and Surface Character of Dehydroxylated and Rehydroxylated MCM-41 Mesoporous Silicas-Analysis of Adsorption Isotherms of Nitrogen Gas and Water Vapor. J. Colloid Interface Sci. 2000, 225, 411-420.
(33) Neimark, A.V.; Ravikovitch, P.I.; Grün, M.; Schüth, F.; Unger, K.K. Pore Size Analysis of MCM-41 Type Adsorbents by Means of Nitrogen and Argon Adsorption. J. Colloid Interface Sci. 1998, 207, 159-169.
(34) Kruk, M.; Jaroniec, M.; Kim, J.M.; Ryoo, R. Characterization of Highly Ordered MCM-41 Silicas Using X-ray Diffraction and Nitrogen Adsorption. Langmuir 1999, 15, 5279-5284.
(35) Ravikovitch, P.I.; Neimark, A.V. Characterization of Micro- and Mesoporosity in SBA-15 Materials from Adsorption Data by the NLDFT Method. J. Phys. Chem. B 2001, 105, 6817-6823.
(36) León y León, C.A. New perspectives in mercury porosimetry. Adv. Colloid Interface Sci. 1998, 76–77, 341-372.
(37) Provis, J.L.; Myers, R.J.; White, C.E.; Rose, V.; van Deventer, J.S.J. X-ray
microtomography shows pore structure and tortuosity in alkali-activated binders. Cem. Concr. Res. 2012, 42, 855-864.