HAL Id: hal-00499073
https://hal.archives-ouvertes.fr/hal-00499073
Submitted on 9 Jul 2010HAL is a multi-disciplinary open access archive for the deposit and dissemination of sci-entific research documents, whether they are pub-lished or not. The documents may come from teaching and research institutions in France or
L’archive ouverte pluridisciplinaire HAL, est destinée au dépôt et à la diffusion de documents scientifiques de niveau recherche, publiés ou non, émanant des établissements d’enseignement et de recherche français ou étrangers, des laboratoires
To cite this version:
S. Fornasier, E. Dotto, O. Hainaut, F. Marzari, H. Boehnhardt, et al.. Visible spectroscopic and photometric survey of Jupiter Trojans: final results on dynamical families.. Icarus, Elsevier, 2007, 190 (2), pp.622. �10.1016/j.icarus.2007.03.033�. �hal-00499073�
S. Fornasier, E. Dotto, O. Hainaut, F. Marzari, H. Boehnhardt, F. De Luise, M.A. Barucci
PII: S0019-1035(07)00143-1 DOI: 10.1016/j.icarus.2007.03.033
Reference: YICAR 8239 To appear in: Icarus
Received date: 2 December 2006 Revised date: 20 March 2007 Accepted date: 27 March 2007
Please cite this article as: S. Fornasier, E. Dotto, O. Hainaut, F. Marzari, H. Boehnhardt, F. De Luise, M.A. Barucci, Visible spectroscopic and photometric survey of Jupiter Trojans: final results on dynamical families., Icarus (2007), doi: 10.1016/j.icarus.2007.03.033
This is a PDF file of an unedited manuscript that has been accepted for publication. As a service to our customers we are providing this early version of the manuscript. The manuscript will undergo copyediting, typesetting, and review of the resulting proof before it is published in its final form. Please note that during the production process errors may be discovered which could affect the content, and all legal disclaimers that apply to the journal pertain.
ACCEPTED MANUSCRIPT
Visible spectroscopic and photometric survey
of Jupiter Trojans: final results on dynamical
families.
∗
Fornasier S.
1,2, Dotto E.
3, Hainaut O.
4, Marzari F.
5,
Boehnhardt H.
6, De Luise F.
3, Barucci M.A.
2April 27, 2007
1 University of Paris 7, France
2 LESIA – Paris Observatory, France.
3 INAF – Osservatorio Astronomico di Roma, Italy; 4 European Southern Observatory, Chile;
5 Dipartimento di Fisica, Universit`a di Padova, Italy;
6 Max-Planck Institute for Solar System Research, Katlenburg-Lindau, Germany
Submitted to Icarus: December 2006 e-mail: sonia.fornasier@obspm.fr
fax: +33145077144, phone: +33145077746 Manuscript pages: 69; Figures: 14; Tables: 8
∗Based on observations carried out at the European Southern Observatory (ESO), La
Silla, Chile, ESO proposals 71.C-0650, 73.C-0622, 74.C-0577
ACCEPTED MANUSCRIPT
Running head: Investigation of Dynamical Families of Jupiter Trojans
Send correspondence to:
Sonia Fornasier
LESIA-Observatoire de Paris Batiment 17
5, Place Jules Janssen 92195 Meudon Cedex France
e-mail: sonia.fornasier@obspm.fr fax: +33145077144
ACCEPTED MANUSCRIPT
Abstract
We present the results of a visible spectroscopic and photometric survey of Jupiter Trojans belonging to different dynamical families. The survey was carried out at the 3.5m New Technology Telescope (NTT) of the European Southern Observatory (La Silla, Chile) in April 2003, May 2004 and January 2005. We obtained data on 47 objects, 23 belonging to the L5 swarm and 24 to the L4 one. These data together with those already published by Fornasier et al. (2004a) and Dotto et al. (2006), acquired since November 2002, constitute a total sample of visible spectra for 80 objects.
The survey allows us to investigate six families (Aneas, Anchises, Mis-enus, Phereclos, Sarpedon, Panthoos) in the L5 cloud and four L4 fam-ilies (Eurybates, Menelaus, 1986 WD and 1986 TS6). The sample that we measured is dominated by D–type asteroids, with the exception of the Eurybates family in the L4 swarm, where there is a dominance of C– and P–type asteroids.
All the spectra that we obtained are featureless with the exception of some Eurybates members, where a drop–off of the reflectance is detected shortward of 5200 ˚A. Similar features are seen in main belt C–type asteroids and commonly attributed to the intervalence charge transfer transition in oxidized iron.
Our sample comprises fainter and smaller Trojans as compared to the literature’s data and allows us to investigate the properties of objects with estimated diameter smaller than 40–50 km. The analysis of the spectral slopes and colors versus the estimated diameters shows that the blue and red objects have indistinguishable size distribution, so any relationship between size and spectral slopes has been found. To fully investigate the Trojans population, we include in our anal-ysis 62 spectra of Trojans available in literature, resulting in a total sample of 142 objects. Although the mean spectral behavior of L4 and L5 Trojans is indistinguishable within the uncertainties, we find that the L4 population is more heterogeneous and that it has a higher abundance of bluish objects as compared to the L5 swarm.
Finally, we perform a statistical investigation of the Trojans’s spectra property distributions as a function of their orbital and physical pa-rameters, and in comparison with other classes of minor bodies in the outer Solar System. Trojans at lower inclination appear significantly bluer than those at higher inclination, but this effect is strongly driven by the Eurybates family. The mean colors of the Trojans are similar to those of short period comets and neutral Centaurs, but their color distributions are different.
ACCEPTED MANUSCRIPT
ACCEPTED MANUSCRIPT
1
Introduction
Jupiter Trojans are small bodies of the Solar System located in the Jupiter Lagrangian points L4 and L5. Up to now more than 2000 Trojans have been discovered, ∼ 1150 belonging to the L4 cloud and ∼ 950 to the L5 one. The number of L4 Trojans with radius greater than 1 km is estimated to be around 1.6 ×10⁵ (Jewitt et al., 2000), comparable with the estimated main belt population of similar size.
The debate about the origin of Jupiter Trojans and how they were trapped in librating orbits around the Lagrangian points is still open to several possi-bilities. Considering that Trojans have orbits stable over the age of the Solar System (Levison et al, 1997, Marzari et al. 2003) their origin must date back to the early phase of the solar system formation. Some authors (Marzari & Scholl, 1998a,b; Marzari et al., 2002) suggested that they formed very close to their present location and were trapped during the growth of Jupiter. Morbidelli et al. (2005) suggested that Trojans formed in the Kuiper belt and were subsequently captured in the Jupiter L4 and L5 Lagrangian points during planetary migration, just after Jupiter and Saturn crossed their mu-tual 1:2 resonances. In this scenario, Jupiter Troians would give important clues on the composition and accretion of bodies in the outer regions of the solar nebula.
Several theoretical studies conclude that Jupiter Trojan clouds are at least as collisionally evolved as main belt asteroids (Shoemaker et al., 1989; Binzel & Sauter, 1992; Marzari et al., 1997; Dell’Oro et al., 1998). This
ACCEPTED MANUSCRIPT
result is supported by the identification of several dynamical families, both in the L4 and L5 swarm (Shoemaker et al., 1989, Milani, 1993, Beaug´e and Roig, 2001).
Whatever the Trojan origin is, it is plausible to assume that they formed be-yond the frost line and that they are primitive bodies, are possibly composed of anhydrous silicates and organic compounds, and possibly still contain ices in their interior. Several observations of Trojans in the near infrared region (0.8-2.5 μm) have failed to clearly detect any absorption features indicative of water ice (Barucci et al, 1994; Dumas et al, 1998; Emery & Brown, 2003, 2004; Dotto et al., 2006). Also in the visible range Trojan spectra appear featureless (Jewitt & Luu, 1990; Fornasier et al., 2004a, Bendjoya et al., 2004; Dotto et al., 2006). Up to now only 2 objects (1988 BY1 and 1870 Glaukos) show the possible presence of faint bands (Jewitt & Luu, 1990). However, these bands are comparable to the peak to peak noise and are not yet confirmed.
Recently, mineralogical features have been detected in emissivity spectra of three Trojan asteroids measured by the Spitzer Space Telescope. These fea-tures are interpreted as indicating the presence of fine-grained silicates on the surfaces (Emery et al. 2006).
Several questions about Jupiter Trojans’ dynamical origin, physical prop-erties, composition and link with other groups of minor bodies such as outer main belt asteroids, cometary nuclei, Centaurs and KBOs are still open. In order to shed some light on these questions, we have carried out a spectro-scopic and photometric survey of Jupiter Trojans at the 3.5m New
Technol-ACCEPTED MANUSCRIPT
ogy Telescope (NTT) of the European Southern Observatory (La Silla, Chile) and at the 3.5m Telescopio Nazionale Galileo (TNG), La Palma, Spain. In this paper we present new visible spectroscopic and photometric data, ob-tained during 7 observing nights, carried out at ESO-NTT on April 2003, May 2004, and January 2005, for a total of 47 objects belonging to the L5 (23 objects) and L4 (24 objects) swarms. Considering also the results already published in Fornasier et al. (2004a) and Dotto et al. (2006), obtained in the framework of the same project, we collected a total sample of 80 Jupiter Trojan visible spectra, 47 belonging to the L5 clouds and 33 to the L4. This is the largest homogeneous data set available up to now on these primitive asteroids.
The principal aim of our survey was the investigation of Jupiter Trojans belonging to different dynamical families. In fact, since dynamical families are supposed to be formed from the collisional disruption of parent bodies, the investigation of the surface properties of small and large family members can help in understanding the nature of these dynamical groups and might provide a glimpse of the interior structure of the larger primordial parent bodies.
We also present an analysis of the visible spectral slopes for all the data in our survey along with those available in the literature, for a total sample of 142 Trojans.
This enlarged sample allowed us to carry out a significant statistical investi-gation of the Trojans’ spectral property distributions, as a function of their orbital and physical parameters, and in comparison with other classes of
mi-ACCEPTED MANUSCRIPT
nor bodies in the outer Solar System. We also discuss the spectral slope distribution within the Trojan families.
2
Observations and data reduction
[HERE TABLE 1 AND 2]
The data were obtained in the visible range during 3 different observing runs at ESO-NTT: 10 and 11 April 2003 for the spectroscopic and pho-tometric investigation of 6 members of the 4035 1986 WD and 1 member of 1986 TS6 families; 25 and 26 May 2004 for a spectroscopic survey of L4 Eurybates family; 17, 18, and 19 January 2005 for the spectroscopic and pho-tometric investigation of 5 Anchises, 6 Misenus, 5 Panthoos, 2 Cloanthus, 2 Sarpedon and 3 Phereclos family members (L5 swarm).
We selected our targets from the list of Jupiter Trojan families provided by Beaug´e and Roig (2001 and P.E.Tr.A. Project at www.daf.on.br/ froig/petra/). The authors have used a cluster-detection algorithm called Hierarchical Clus-tering Method (HCM, e.g. Zappal`a et al., 1990) to find asteroid families among Jupiter Trojans starting from a data–base of semi-analytical proper elements (Beaug´e & Roig, 2001). The identification of families is performed by comparing the mutual distances with a suitable metric in the proper el-ements’ space. The clustering chain is halted when the mutual distance, measuring the incremental velocity needed for orbital change after the puta-tive parent body breakup, is larger than a fixed cut-off value. A lower cutoff implies a higher statistical significance of the family. Since families in L4 are on average more robust than those around L5 (Beaug´e and Roig, 2001), we
ACCEPTED MANUSCRIPT
prefer to adopt a cutoff of 100 m/s for the L4 cloud and of 150 m/s for L5. For the very robust Eurybates family we decided to limit our survey to those family members defined with a cutoff of 70 m/s.
All the data were acquired using the EMMI instrument, equipped with a 2x1 mosaic of 2048×4096 MIT/LL CCD with square 15μm pixels. For the spectroscopic investigation during May 2004 and January 2005 runs we used the grism #1 (150 gr/mm) in RILD mode to cover the wavelength range 4100–9400 ˚A with a dispersion of 3.1 ˚A/px (200 ˚A/mm) at the first order, while on April 2003 we used a different grism, the #7 (150 gr/mm), covering the spectral range 5200–9500 ˚A, with a dispersion of 3.6 ˚A/px at the first order. April 2003 and January 2005 spectra were taken through a 1 arcsec wide slit, while during May 2004 we used a larger slit (1.5 arcsec). The slit was oriented along the parallactic angle during all the observing runs in order to avoid flux loss due to the atmospheric differential refraction.
For most objects, the total exposure time was divided into several (usually 2-4) shorter acquisitions. This allowed us to check the asteroid position in the slit before each acquisition, and correct the telescope pointing and/or tracking rates if necessary. During each night we also recorded bias, flat– field, calibration lamp (He-Ar) and several (6-7) spectra of solar analog stars measured at different airmasses, covering the airmass range of the science targets. During 17 January 2005, part of the night was lost due to some technical problems and only 2 solar analog stars were acquired. The ratio of these 2 stars show minimal variations (less than 1%) in the 5000–8400 ˚A range, but higher differences at the edges of this range. For this reason we
ACCEPTED MANUSCRIPT
omit the spectral region below 4800 ˚A for most of the asteroids acquired that night.
The spectra were reduced using ordinary procedures of data reduction as described in Fornasier et al. (2004a). The reflectivity of each asteroid was obtained by dividing its spectrum by that of the solar analog star closest in time and airmass to the object. Spectra were finally smoothed with a median filter technique, using a box of 19 pixels in the spectral direction for each point of the spectrum. The threshold was set to 0.1, meaning that the original value was replaced by the median value if the median value differs by more than 10% from the original one. The obtained spectra are shown in Figs. 1–5. In Table 1 and Table 2 we report the circumstances of the observations and the solar analog stars used respectively for the L5 and L4 family members.
[TABLE 3]
The broadband color data were obtained during the April 2003 and Jan-uary 2005 runs just before the Trojans’ spectral observation. We used the RILD mode of EMMI for wide field imaging with the Bessell-type B, V, R, and I filters (centered respectively at 4139, 5426, 6410 and 7985˚A). The ob-servations were carried out in a 2× 2 binning mode, yielding a pixel scale of 0.33 arcsec/pixel. The exposure time varied with the object magnitude: typically it was about 12-90s in V, 30-180s in B, 12-70s in R and I filters. The CCD images were reduced and calibrated with a standard method (For-nasier et al., 2004a), and absolute calibration was obtained through the ob-servations of several Landolt fields (Landolt, 1992). The instrumental
mag-ACCEPTED MANUSCRIPT
nitudes were measured using aperture photometry with an integrating radius typically about three times the average seeing, and sky subtraction was per-formed using a 5-10 pixels wide annulus around each object.
The results are reported in Table 3. From the visual inspection and the radial profiles analysis of the images, no coma was detected for any of the observed Trojans.
On May 2004, as the sky conditions were clear but not photometric, we did not perform photometry of the Eurybates family targets.
3
Results
[TABLE 4 AND 5]
For each Trojan we computed the slope S of the spectral continuum using a standard least squared technique for a linear fit in the wavelength range between 5500 and 8000 ˚A. The choice of these wavelength limits has been driven by the spectral coverage of our data. We choose 5500 ˚A as the lower limit because of the different instrumental setup used during different ob-serving runs (with some spectra starting at wavelength ≥ 5200 ˚A), while beyond 8000 ˚A our spectra are generally noisier due to a combination of the CCD drop-off in sensitivity and the presence of the strong atmospheric water bands.
The computed slopes and errors are listed in Table 4 and 5. The reported er-ror bars take into account the 1σ uncertainty of the linear fit plus 0.5%/103˚A attributable to the use of different instruments and solar analog stars
(esti-ACCEPTED MANUSCRIPT
mated from the different efficiency of the grism used, and from flux losses due to different slit apertures). In Table 4 and 5 we also report the taxo-nomic class derived following the Dahlgren & Lagerkvist (1995) classification scheme.
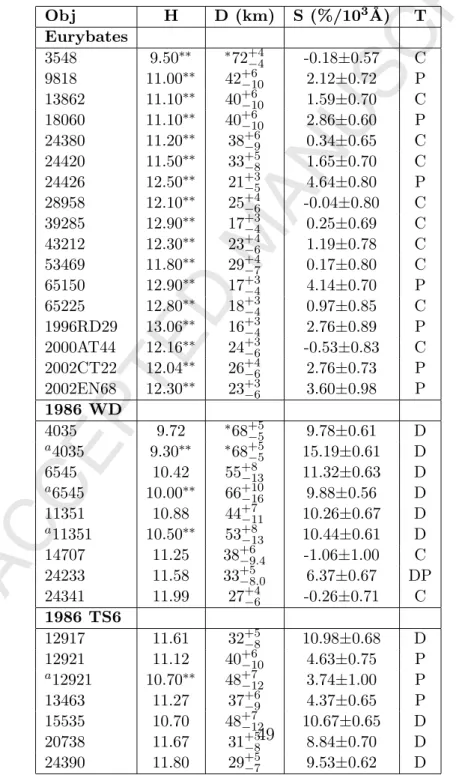
In the L5 cloud we find 27 D–, 3 DP–, 2 PD–, and 1 P–type objects. In the L4 cloud we find 10 C–type and 7 P–type objects inside the Eurybates family, while for the Menelaus, 1986 TS6 and 1986 WD families, including the data published in Dotto et al. (2006), we get 9 D–, 3 P–, 3C–, and 1 DP–type asteroids.
The majority of the spectra are featureless, although some of the observed Eurybates’ members show weak spectral absorption features (Fig. 5). These features are discussed in the following section.
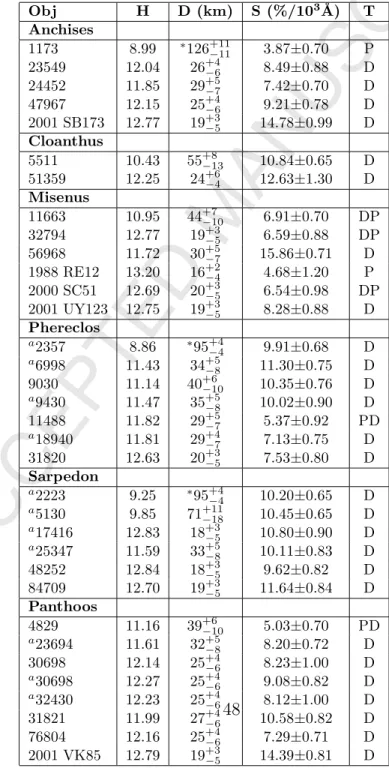
We derived an estimated absolute magnitude H by scaling the measured V magnitude to r = Δ = 1 AU and to zero phase assuming G=0.15 (Bowell et al., 1989). The estimated H magnitude of each Trojan might be skewed uncertain rotational phase, as the lightcurve amplitudes of Trojans might vary up to 1 magnitude. In order to investigate possible size dependence in-side each family, and conin-sidering that IRAS diameters are available for very few objects, we estimate the size using the following relationship:
D = 1329× 10
−H/5
√p
where D is the asteroid diameter, p is the geometric albedo, and H is the abso-lute magnitude. We use H derived from our observations when available, and from the ASTORB.DAT file (Lowell observatory) for the Eurybates
mem-ACCEPTED MANUSCRIPT
bers, for which we did not carry out visible photometry. We evaluated the diameter for an albedo range of 0.03–0.07, assuming a mean albedo of 0.04 for these dark asteroids (Fernandez et al., 2003). The resulting D values are reported in Tables 4 and 5.
3.1
Dynamical families: L5 swarm
3.1.1 Anchises [FIGURE 1]
We investigated 5 of the 15 members of the Anchises family (Fig. 1): 1173 Anchises, 23549 1994 ES6, 24452 2000 QU167, 47967 2000 SL298 and 124729 2001 SB173 on 17 January 2005. For 4 out of 5 observed objects we omit the spectral range below 4800˚A due to low S/N ratio and problems with the solar analog stars. The spectral behavior is confirmed by photometric data (see Table 3). All the obtained spectra are featureless.
The Anchises family survives at a cutoff corresponding to relative veloc-ities of 150 m/s. The biggest member, 1173 Anchises, has a diameter of 126 km (IRAS data) and has the lowest spectral slope (3.9 %/103˚A) among the investigated family members. It is classified as P–type, while the other 4 members are all D–types. Anchises was previously observed in the 4000-7400˚A region by Jewitt & Luu (1990), who reported a spectral slope of 3.8 %/103˚A, in perfect agreement with the value we found. The three 19-29 km sized objects have a steeper spectral slope (7.4-9.2 %/103˚A), while the small-est object, 2001 SB173 (spectral slope = 14.78±0.99 %/103˚A) is the reddest one (Table 4).
ACCEPTED MANUSCRIPT
Even with the uncertainties in the albedo and diameter, a slope–size rela-tionship is evident among the observed objects, with smaller–fainter members redder than larger ones (Fig. 7).
3.1.2 Misenus [FIGURE 2]
For this family we investigated 6 members (11663 1997 GO24, 32794 1989 UE5, 56968 2000 SA92, 99328 2001 UY123, 105685 2000 SC51 and 120453 1988 RE12) out of the 12 grouped at a relative velocity of 150 m/s. The family survives with the same members also at a stringent cut-off velocity of 120 m/s. The spectra, together with magnitude color indices transformed into linear reflectance, are shown in Fig. 2, while the color indices are reported in Table 3. All the spectra are featureless with different spectral slope values covering the 4.6–15.9 %/103˚A range (Table 4): 1988 RE12 has the lowest spectral slope and is classified as P–type, 3 objects (11663, 32794 and 2000 SC51) are in the transition region between P– and D– type, with very similar spectral behavior, while the two other observed members are D–types. Of these last, 56968 has the highest spectral slope not only inside the family (15.86 %/103˚A) but also inside the whole L5 sample analyzed in this paper. All the investigated Misenus members are quite faint and have diameters of a few tens of kilometers. No clear size-slope relationship has been found inside this family (Fig. 7).
No other data on the Misenus family members are available in the literature, so we do not know if the large gap between the spectral slope of 56968 and
ACCEPTED MANUSCRIPT
those of the other 5 investigated objects is real or it could be filled by other members not yet observed. If real, 56968 can be an interloper inside the family.
3.1.3 Panthoos [FIGURE 3]
The Panthoos family has 59 members for a relative velocity cutoff of 150 m/s. We obtained new spectroscopic and photometric data of 5 members: 4829 Sergestus, 30698 Hippokoon, 31821 1999 RK225, 76804 2000 QE and 111113 2001 VK85 (Fig. 3). Three objects presented by Fornasier et al. (2004a) as belonging to the Astyanax family (23694 1997 KZ3, 32430 2000 RQ83, 30698 Hippokoon) and one to the background population (24444 2000 OP32) are now included among the members of the Panthoos family. Peri-odic updates of the proper elements can change the family membership. In particular the Astyanax group disappeared in the latest revision of dynami-cal families, and its members are now in the Panthoos family within a cutoff of 150m/s. The Panthos family survives also a cutoff of 120 m/s, with 7 members, and 90 m/s, with 6 members.
We observed 30698 Hippokoon during two different runs (on 9 Nov. 2002 and on 18 Jan. 2005), and both spectral slopes and colors are in agreement inside the error bars (see Table 3, Table 4, and Fornasier et al., 2004a). No other data on the Panthoos family are available in the literature.
ACCEPTED MANUSCRIPT
show featureless spectra with slopes that seem to slightly increase as the asteroid size decreases (Table 4 and Fig. 7). However, all the members have dimensions very similar within the uncertainties, making it difficult for any slope-size relationship to be studied. The largest member, 4829 Sergestus, is a PD–type with a slope of about 5 %/103˚A, while all the other investigated members are D–types.
3.1.4 Cloantus [FIGURE 4]
We observed only 2 out of 8 members of the Cloantus family (5511 Cloan-thus and 51359 2000 SC17, see Fig. 4) as grouped at a cutoff corresponding to relative velocities of 150 m/s. This family survives at a stringent cutoff and 3 members (including the two that we observed) also survive for relative velocities of 60 m/s. Both of the observed objects are D–types with very similar, featureless, reddish spectra (Table 4 and Fig. 7). 5511 Cloanthus was observed also by Bendjoya et al. (2004), who found a slope of 13.0±0.1 %/103˚A in the 5000-7500 ˚A wavelength range, while we measure a value of 10.84±0.15 %/103˚A. Our spectrum has a higher S/N ratio than the spectrum by Bendjoya et al. (2004), and it is perfectly matched by our measured color indices that confirm the spectral slope. This difference cannot be caused by the slightly different spectral ranges used to measure the slope, but could possibly be due to heterogeneous surface composition.
ACCEPTED MANUSCRIPT
3.1.5 Phereclos
The Phereclos family comprises 15 members at a cutoff of 150 m/s. The family survives with 8 members also at a cutoff of 120m/s. We obtained spectroscopic and photometric data of 3 members (9030 1989 UX5, 11488 1988 RM11 and 31820 1999 RT186, see Fig 4), that, together with the 4 spectra (2357 Phereclos, 6998 Tithonus, 9430 1996 HU10, 18940 2000QV49) already presented by Fornasier et al. (2004a), allow us to investigate about half of the Phereclos family population defined at a cutoff of 150m/s. The spectral slope of these objects, all classified as D–type except one PD–type (11488), varies from 5.3 to 11.3 %/103˚A (Table 4). The size of the fam-ily members ranges from about 20 km in diameter for 31820 to 95 km for 2357, but we do not observe any clear slope-diameter relationship (Fig. 7 and Table 4).
3.1.6 Sarpedon
We obtained new spectroscopic and photometric data of 2 members of the Sarpedon family (48252 2001 TL212 and 84709 2002 VW120), whose spectra and magnitude color indices are reported in Fig. 4 and Table 4. Including the previous observations (Fornasier et al., 2004a) of 4 other members (2223 Sarpedon, 5130 Ilioneus, 17416 1988 RR10, and 25347 1999 RQ116), we have measurements of 6 of the 21 members of this family dynamically defined at a cutoff of 150 m/s. All the 6 aforementioned objects, except 25347, constitute a robust clustering which survives up to 90 m/s with 9 members. The cluster which contains (2223) Sarpedon was also recognized as a family by Milani
ACCEPTED MANUSCRIPT
(1993).
All the 6 investigated members have very similar colors (see Table 3) and spectral behavior. The spectral slope (Fig. 7) varies over a very restricted range, from 9.6 to 11.6 %/103˚A (Table 4), despite a significant variation of the estimated size (from the 18 km of 17416 to the 105 km of 2223). Con-sequently, the surface composition of the Sarpedon family members appears to be very homogeneous.
3.2
Dynamical families: L4 swarm
3.2.1 Eurybates [FIGURE 5]
Eurybates family members were observed in May 2004. The selection of the targets was made on the basis of a very stringent cutoff, corresponding to relative velocities of 70 m/s, that gives a family population of 28 objects. We observed 17 of these members (see Table 2) that constitute a very robust clustering in the space of the proper elements: all the members we studied, except 2002 CT22, survive at a cutoff of 40 m/s.
The spectral behavior of these objects (Fig. 5) is quite homogeneous with 10 asteroids classified as C–type and 7 as P–type. The spectral slopes (Ta-ble 5) range from neutral to moderately red (from -0.5 to 4.6 %/103˚A). The slopes of six members are close to zero (3 slightly negative) with solar-like col-ors. The asteroids 18060, 24380, 24420, and 39285, all classified as C–types, clearly show a drop off of reflectance for wavelength shorter than 5000–5200 ˚
ACCEPTED MANUSCRIPT
RD29 and 28958) is less certain due to the lower S/N ratio. This absorp-tion is commonly seen on main belt C–type asteroids (Vilas 1994; Fornasier et al. 1999), where is due to the intervalence charge transfer transitions (IVCT) in oxidized iron, and is often coupled with other visible absorption features related to the presence of aqueous alteration products (e.g. phyl-losilicates, oxides, etc). These IVCTs comprise multiple absorptions that are not uniquely indicative of phyllosilicates, but are present in the spectrum of any object containing Fe2+ and Fe3+ in its surface material (Vilas 1994). Since no other phyllosilicate absorption features are present in the C-type spectra of the Eurybates family, there is no evidence that aqueous alteration processes occurred on the surface of these bodies.
In Fig. 8 we show the spectral slopes versus the estimated diameters for the Eurybates family members. All the observed objects, except the largest member (3548) that has a diameter of about 70 km and exhibit a neutral (∼ solar-like) spectral slope, are smaller than∼ 40 km and present both neutral and moderately red colors. The spectral slopes are strongly clustered around
S = 2%/103˚A, with higher S values restricted to smaller objects (D< 25 km).
3.2.2 1986 WD [FIGURE 6]
We investigated 6 out of 17 members of the 4035 1986 WD family that is dynamically defined at a cutoff of 130 m/s (Fig. 6 and Table 2). Three of our targets (4035, 6545 and 11351) were already observed by Dotto et al. (2006):
ACCEPTED MANUSCRIPT
for 6545 and 11351 there is a good consistency between our spectra and those already published. 4035 was observed also by Bendjoya et al. (2004): all the spectra are featureless, but Bendjoya et al. (2004) obtain a slope of 8.8 %/103˚A, comparable to the one here presented, while Dotto et al. (2006) found a higher value (see Table 5). This could be interpreted as due to the different rotational phases seen in the three observations, and could indicate some inhomogeneities on the surface of 4035.
The observed family members show heterogeneous behaviors (Fig. 8), with spectral slopes ranging from neutral values for the smaller members (24341 and 14707) to reddish ones for the 3 members with size bigger than 50 km (4035, 6545, and 11351). For this family, it seems that a size-slope relationship exists, with smaller members having solar colors and spectral slopes increasing with the object’ sizes.
3.2.3 1986 TS6
The 1986 TS6 family includes 20 objects at a cut-off of 100 m/s. We present new spectroscopy and photometry of a single member, 12921 1998 WZ5 (Fig. 6). The spectrum we present here is flat and featureless, with a spectral slope of 4.6± 0.8%/103˚A. Dotto et al. (2006) presented a spectrum obtained a month after our data (in May 2003) that has a very similar spectral slope 3.7± 0.8%/103˚A. Previously, 12917 1998 TG16, 13463 Antiphos, 12921 1998 WZ5, 15535 2000 AT177, 20738 1999 XG191, and 24390 2000 AD177 were included in the Makhoan family. Refined proper elements now place all of these bodies in the 1986 TS6 family.
ACCEPTED MANUSCRIPT
In Fig. 8 we report the spectral slopes vs. estimated diameters of the 6 observed members. The family shows different spectral slopes with the presence of both P–type (12921 and 13463) and D–type asteroids (12917, 15535, 20738, and 24390). Due to the very similar diameters, a slope-size relationship is not found.
[FIGURE 7 AND 8]
4
Discussion
The spectra of Jupiter Trojan members of dynamical families show a range of spectral variation from C– to D–type asteroids. With the exception of the L4 Eurybates family, all the observed objects have featureless spectra, and we cannot find any spectral bands which could help in the identification of minerals present on their surfaces. The lack of detection of any mineralogy diagnostic feature might indicate the formation of a thick mantle on the Tro-jan surfaces. Such a mantle could be formed by a phase of cometary activity and/or by space weathering processes as demonstrated by laboratory exper-iments on originally icy surfaces (Moore et al., 1983; Thompson et al., 1987; Strazzulla et al., 1998; Hudson & Moore, 1999).
A peculiar case is constituted by the Eurybates family, which shows a pre-ponderance of C–type objects and a total absence of D–types. Moreover, this is the only family in which some members exhibit spectral features at wavelengths shorter than 5000–5200 ˚A, most likely due to the intervalence charge transitions in materials containing oxidized iron (Vilas 1994).
ACCEPTED MANUSCRIPT
4.1
Size vs spectral slope distribution:
Individual families
The plots of spectral slopes vs. diameters are shown in Fig. 7 and 8. A relationship between spectral slopes and diameters seems to exist for only three of the nine families we studied. In the Anchises and Panthoos families, smaller objects have redder spectra, while for the 1986 WD family larger objects have the redder spectra.
Moroz et al. (2004) have shown that ion irradiation on natural complex hydrocarbons gradually neutralizes the spectral slopes of these red organic solids. If the process studied by Moroz et al. (2004) occurred on the surface of Jupiter Trojans, the objects having redder spectra have to be younger than those characterized by bluish-neutral spectra. In this scenario the largest and spectrally reddest objects of the 1986 WD family could come from the interior of the parent body and expose fresh material. In the case of the Anchises and Panthoos families the spectrally reddest members, being the smallest, could come from the interior of the parent body, or alternatively could be produced by more recent secondary fragmentations. In particular, small family members may be more easily resurfaced, as significant collisions (an impactor having a size greater than a few percent of the target), as well as seismic shaking and recoating by fresh dust, may occur frequently at small sizes.
ACCEPTED MANUSCRIPT
4.2
Size vs slope distribution:
The Trojan population as a whole
[TABLE 6]
As compared to the data available in literature, our sample strongly con-tributed to the analysis of fainter and smaller Trojans, with estimated di-ameters smaller than 50 km. Jewitt & Luu (1990), analyzing a sample of 32 Trojans, found that the smaller objects were redder than the bigger ones. However, our data play against the existence of a possible color-dimension trend. In fact, the spectral slope’s range of the objects smaller than 50 km is similar to that of the larger Trojans, as shown in Fig. 9.
The Eurybates family strongly contributes to the population of small spectrally neutral objects, filling the region of bodies with mean diameter D<40 km and with spectral slopes smaller than 3 %/103˚A.
In order to carry out a complete analysis of the spectroscopic and pho-tometric characteristics of the whole available data set on Jupiter Trojans, we considered all the visible spectra published in the literature: Jewitt & Luu (1990, 32 objects), Fitzimmons et al. (1994, 3 objects), Bendjoya et al. (2004, 34 objects), Fornasier et al. (2004a, 26 L5 objects), and Dotto et al. (2006, 24 L4 Trojans). We also add several Trojans spectra (11 L4 and 3 L5 Trojans) from the files available on line (Planetary data System archive, pdssbn.astro.umd.edu, and www.daf.on.br/∼lazzaro/S3OS2-Pub/s3os2.htm) from the SMASS I, SMASS II and S3OS2 surveys (Xu et al., 1995; Bus & Binzel, 2003; Lazzaro et al., 2004). Including all these data, we compile a sample of 142 different Trojans, 68 belonging to the L5 cloud and 74
belong-ACCEPTED MANUSCRIPT
ing to the L4. We performed the taxonomic classification of this enlarged sample, on the basis of the Dahlgren and Lagerkvist (1995) scheme, by ana-lyzing spectral slopes computed in the range 5500-8000 ˚A. Different authors, of course, considered different spectral ranges for their own slope gradient evaluations: Jewitt & Luu (1990) and Fitzimmons et al. (1994) use the 4000-7400 ˚A and Bendjoya et al. (2004, Table 2) used a slightly different ranges around 5200-7500 ˚A. Since all the cited papers show spectra with lin-ear featureless trends, the different wavelength ranges used for the spectral gradient computation by Bendjoya et al. (2004) and Jewitt & Luu (1990) are not expected to influence the obtained slopes.
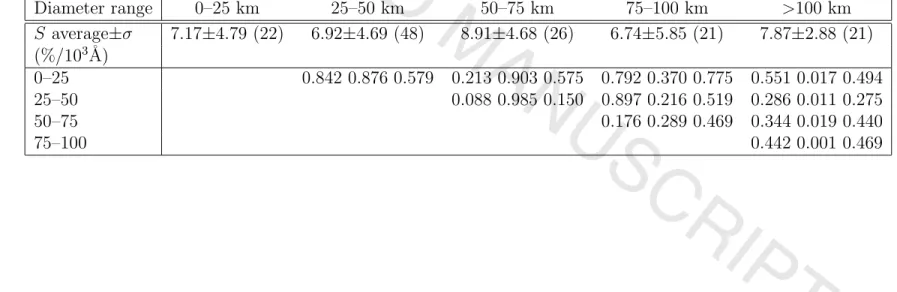
In order to search for a dependency of the spectral slope distribution with the size of the objects, all observations (from this paper as well as from the literature) were combined. The objects were isolated in 5 size bins (smaller than 25 km, 25–50 km, 50–75 km, 75-100 km and larger than 100 km). Each bin contains between 20 and 50 objects. These subsamples are large enough to be compared using classical statistical tests: the t-test, which estimates if the mean values are compatible, the f-test, which checks if the widths of the distributions are compatible (even if they have different means), and the KS test, which compares directly the full distributions. A probability is computed for each test; a small probability indicates that the tested distri-butions are not compatible, i.e. the objects are not randomly extracted from the same population, while a large probability value has no meaning (i.e. it is not possible to assure that both samples come from the same population, we can just say in that case that they are not incompatible). In order to
ACCEPTED MANUSCRIPT
quantify the probability levels that we consider as significant, the same tests were run on randomized distributions (see Hainaut & Delsanti 2002 for the method). Since probability lower than 0.04-0.05 does not appear in these randomized distributions, we consider that values smaller than 0.05 indicate a significant incompatibility.
Each sub-sample was compared with the four others – the results are sum-marized in Table 6. The average slope of the 5 bins are all compatible among each other. The only marginally significant result is that the width of the slope distribution among the larger objects (diam. > 100 km) is narrower than that of all the smaller objects.
This narrower color distribution could be due to the aging processes affect-ing the surface of bigger objects, which are supposed to be older. The wider color distribution of small members is possibly related to the different ages of their surfaces: some of them could be quite old, while some other could have been recently refreshed.
4.3
Spectral slopes and L4/L5 Clouds
[HERE FIGURES 10 AND 11]
Considering only the Trojan observations reported in this paper, the aver-age slope is 8.84±3.03%/103˚A for the L5 population, and 4.57±4.01%/103˚A for the L4.
Considering now all the spectra available in the literature, the 68 L5 Trojans have an average slope of 9.15±4.19%/103˚A, and the 78 L4 objects, 6.10±4.48%/103˚A. Performing the same statistical tests as above, it appears
ACCEPTED MANUSCRIPT
that these two populations are significantly different. In particular, the av-erage slopes are incompatible at the 10−5 level.
Nevertheless, as described in Section 3.2.1, the Eurybates family members have quite different spectral characteristics than the other objects and con-stitute a large subset of the whole sample. Indeed, comparing their distribu-tion with the whole populadistribu-tions, they are found significantly different at the 10−10level. In other words, the Eurybates family members do not constitute a random subset of the other Trojans.
Once excluded the Eurybates family, the remaining 61 Trojans from the L4 swarm have an average slope of 7.33±4.24%/103˚A. The very slight dif-ference of average slope between the L5 and remaining L4 objects is very marginally significant (probability of 1.6%), and the shape and width of the slope distributions are compatible with each other.
The taxonomic classification we have performed shows that the majority (73.5%) of the observed L5 Trojans (Fig. 10) are D–type (slope > 7 %/103 ˚
A) with featureless reddish spectra, 11.8% are DP/PD –type (slope between 5 and 7 %/103 ˚A), 10.3% are P–type, and only 3 objects are classified as C–type (4.4%).
In the L4 swarm (Fig. 11), even though the D–type still dominate the population (48.6%), the spectral types are more heterogeneous as compared to the L5 cloud, with a higher percentage of neutral-bluish objects: 20.3% are P–type, 8.1% are DP/PD-type, 12.2% are C–type, and 10.8% of the bodies have negative spectral slope. The higher percentage of C– and P–
ACCEPTED MANUSCRIPT
type as compared to the L5 swarm is strongly associated with the presence of the very peculiar Eurybates family. Among 17 observed members 10 are classified as C–types (among which 3 have negative spectral slopes) and 7 are P–types. Considering the 57 asteroids that compose the L4 cloud without the Eurybates family, we find percentages of P, and PD/DP –types very similar to those of the L5 cloud (14.0% and 10.5% respectively), a smaller percentage of D–types (63.2%) and of the C–types (3.5%), and the presence of a 8.8% Trojans with negative spectral slopes.
The visible spectra of the Eurybates members are very similar to those of C–type main belt asteroids, Chiron-like Centaurs, and cometary nuclei. This similarity is compatible with three different scenarios: the family could have been produced by the fragmentation of a parent body very different from all the other Jupiter Trojans (in which case the origin of such a peculiar parent must still be assessed); this could be a very old family where space weathering processes have covered any differences in composition among the family members and flattened all the spectra; this could be a young family where space weathering processes occurred within time scales smaller than the age of the family. In the last two cases the Eurybates family would give the first observational evidence of spectra flattened owing to space weathering processes. This would then imply, according to the results of Moroz et al. (2004), that its primordial composition was rich in complex hydrocarbons. The knowledge of the age of the Eurybates family is therefore a fundamental step to investigate the nature and the origin of the parent body, and to assess the effect of space weathering processes on the surfaces of its members.
ACCEPTED MANUSCRIPT
The present sample of Jupiter Trojans suggests a more heterogeneous composition of the L4 swarm as compared to the L5 one. As previously noted by Bendjoya et al. (2004), the L4 swarm contains a higher percentage of C– and P–type objects. This result is enhanced by members of the Eu-rybates family, but remains even when these family members are excluded. Moreover, the dynamical families belonging to the L4 cloud are more robust than those of the L5 one, surviving with densely populated clustering even at low relative velocity cut-off. We therefore could argue that the L4 cloud is more collisionally active than the L5 swarm. Nevertheless, we still cannot intepret this in terms of the composition of the two populations, since we cannot exclude that as yet unobserved C– and P–type families are present in the L5 cloud.
4.4
Orbital Elements
[HERE FIGURE 12 and TABLES 7 and 8 ]
We analyzed the spectral slope as a function of the Trojans’ orbital el-ements. As an illustration, Fig. 12 shows the B − R color distribution as a function of the orbital elements. In order to investigate variations with orbital parameters, the Trojan population is divided in 2 sub samples: those with the considered orbital element lower than the median value, and those with the orbital element higher than the median (by construction, the two subsamples have the same size). Taking a as an example, half the Trojans have a < 5.21AU, and half have a larger than this value.
ACCEPTED MANUSCRIPT
2 subsamples are compared using the three statistical tests mentioned in Section 4.2. The method is discussed in details in Hainaut & Delsanti (2002). The tests are repeated for all color and spectral slope distributions. The results are the following.
• q, perihelion distance: the color distribution of the Trojans with small q is marginally broader than that of Trojans with larger q. This result
is not very strong (5%), and is dominated by the red-end of the visible wavelength. Removing the Eurybates from the sample maintains the result, at the same weak level.
• e, eccentricity: the distribution shows a similar result, also at the weak
5% significance. The objects with larger e have broader color distribu-tion than those with lower e. This result is entirely dominated by the Eurybates’ contribution.
• i, inclination: objects with smaller inclination are significantly bluer
than those with larger i. This result is observed at all wavelengths. It is worth noting that this is contrary to what is usually observed on other Minor Bodies in the Outer Solar System survey (MBOSSes), where objects with high i, or more generally, high excitation E =
√
e2+ sin2i, are bluer (Hainaut & Delsanti, 2002; Doressoundiram et al., 2005). This can also be visually appreciated in Fig. 12. This result is also completely dominated by the Eurybates’ contribution. The non-Eurybates Trojans do not display this trend.
ACCEPTED MANUSCRIPT
significantly bluer than those with high E. This result is also com-pletely dominated by the Eurybates’ contribution. The non-Eurybates Trojans do not display this trend.
In summary this analysis shows that the Eurybates sub-sample of the Trojans is well separated in orbital elements and in colors.
For the other Minor Bodies in the outer Solar System, the relation be-tween color and inclination–orbital excitation (objects with a higher orbital excitation tend to be bluer) is interpreted as a relation between excitation and surface aging/rejuvenating processes (Doressoudiram et al., 2005). The Eurybates family has low excitation and neutral-blue colors, suggesting that the aging/rejuvenating processes affecting them are different from the other objects. This could be due to different surface compositions, different irradi-ation processes, or different collisional properties – which would be natural for a collisional family.
5
Comparison with other outer Solar System
minor bodied
5.1
Introduction and methods
[HERE FIGURES 13 AND 14]
The statistical tests set described in section 4.2 has also been applied to compare the colors and the spectral slopes distribution of the Trojans with those of the other minor bodies in the outer Solar System taken from the updated, on-line version of the Hainaut & Delsanti (2002) database.
ACCEPTED MANUSCRIPT
shows the (B-V) and (V-R) color distributions, as well as the spectral slope distribution of the different classes of objects. The tests were performed on all the color indices derived from filters in the visible (UBVRI) and near infrared range (JHK) but in Table 7 and 8 we summarize the most significant results.
In order to “calibrate” the significant probabilities, additional artificial classes are also compared: first, the objects which have an even internal number in the database with the odd ones. As this internal number is purely arbitrary, both classes are statistically indistinguishable. The other tested pair is the objects with a “1999” designation versus the others. Again, this selection criterion is arbitrary, so the pseudo-classes it generates are sub-sample of the total population, and should be indistinguishable. However, as many more objects have been discovered in all the other years than during that specific year, the size of these sub-samples are very different. This permits us to estimate the sensitivity of the tests on sample of very different sizes. Some of the tests found the arbitrary populations incompatible at the 5% level, so we use 0.5% as a conservative threshold for statistical significance of the distribution incompatibility
5.2
Results
Table 7 and Fig. 14 clearly show that the Trojans’ colors distribution is different as compare to that of Centaurs, TNOs and comets. Trojans are at the same time bluer, and their distribution is narrower than all the other populations. Using the statistical tests (see Table 8), we can confirm the
ACCEPTED MANUSCRIPT
significance of these results.
• The average colors of the Trojans are significantly different from those
of all the other classes of objects (t-test), with the notable exception of the short period comet nuclei. Refining the test to the Eurybates/non-Eurybates, it appears that the Eurybates have marginally different mean colors, while the non-Eurybates average colors are indistinguish-able from those of the comets.
• Considering the full shape of the distribution (KS test), we obtain the
same results: the Trojans colors distributions are significantly differ-ent from those of all the other classes, with the exception of the SP comets, which are compatible. Again, this result becomes stronger separating the Eurybates: their distributions are different from those of the comets, while the non-Eurybates ones are indistinguishable.
• The results when considering the widths of the color distributions
(f-test) are slightly different. Classes of objects with different mean colors could still have the same distribution width. This could suggest that a similar process (causing the width of the distribution) is in action, but reached a different equilibrium point (resulting in different mean val-ues). This time, all classes are incompatible with the Trojans, including the comets, with strong statistical significance.
In order to further explore possible similarities between Trojans and other classes, the comparisons were also performed with the neutral Centaurs.
ACCEPTED MANUSCRIPT
between the ”neutral” and ”red” Centaurs (Peixinho et al., 2003, Fornasier et al., 2004b).
The t-Test (mean color) only reveals a very moderate incompatibility be-tween the Trojans and neutral Centaurs, at the 5% level, i.e. only marginally significant. On the other hand, the f-Test gives some strong incompatibilities in various colors (moderate in B− V and H − K, very strong in R − I), but the two populations are compatible for most of the other colors. Similarly, only the R− I KS-test reveals a strong incompatibility. It should also be noted that only 18 neutral Centaurs are known in the database. In summary, while the Trojans and neutral Centaurs have fairly similar mean colors, their color distributions are also different.
6
Conclusions
From 2002, we carried out a spectroscopic and photometric survey of Jupiter Trojans, with the aim of investigating the members of dynamical families. In this paper we present new data on 47 objects belonging to several dy-namical families: Anchises (5 members), Cloanthus (2 members), Misenus (6 members), Phereclos (3 members), Sarpedon (2 members) and Panthoos (5 members) from the L5 swarm; Eurybates (17 members), 1986 WD (6 mem-bers), and Menelaus (1 member) for the L4 swarm. Together with the data already published by Fornasier et al. (2004a) and Dotto et al. (2006), taken within the same observing program, we have a total sample of 80 Trojans, the largest homogeneous data set available to date on these primitive aster-oids. The main results coming from the observations presented here, and
ACCEPTED MANUSCRIPT
from the analysis including previously published visible spectra of Trojans, are the following:
• Trojans’ visible spectra are mostly featureless. However, some
mem-bers of the Eurybates family show a UV drop-off in reflectivity for wavelength shorter than 5000–5200 ˚A that is possibly due to interva-lence charge transfer transitions (IVCT) in oxidized iron.
• The L4 Eurybates family strongly differs from all the other families
in that it is dominated by C– and P–type asteroids. Also its spectral slope distribution is significantly different when compared to that of the other Trojans (at the 10−10 level).
This family is very peculiar and is dynamically very strong, as it sur-vives also at a very stringent cutoff (40 m/s). Further observations in the near-infrared region are strongly encouraged to look for possible absorption features due to water ice or to material that experienced aqueous alteration.
• The average spectral slope for the L5 Trojans is 9.15±4.19%/103˚A, and 6.10±4.48%/103˚A for the L4 objects. Excluding the Eurybates, the L4 average slope values becomes 7.33±4.24%/103˚A. The slope distribu-tions of the L5 and of the non-Eurybates L4 are indistinguishable.
• Both L4 and L5 clouds are dominated by D–type asteroids, but the L4
swarm has an higher presence of C– and P–type asteroids, even when the Eurybates family is excluded, and appears more heterogeneous in
ACCEPTED MANUSCRIPT
• We do not find any size versus spectral slope relationship inside thewhole Trojans population.
• The Trojans with higher orbital inclination are significantly redder than
those with lower i. While this trend is the opposite of that observed for other distant minor bodies, this effect is entirely dominated by the Eurybates family.
• Comparing the Trojans colors with those of other distant minor
bod-ies, they are the bluest of all classes, and their colors distribution is the narrowest. This difference is mostly due to the Eurybates family. In fact, if we consider only the Trojan population without the Eurybates members, their average colors and overall distributions are not distin-guishable from that of the short period comets. However, the widths of their color distributions are not compatible. The similarity in the overall color distributions might be caused by the small size of the short period comet sample rather than by a physical analogy. The Trojans average colors are also fairly similar to those of the neutral Centaurs, but the overall distributions are not compatible.
After this study, we have to conclude that Trojans have peculiar charac-teristics very different from those of all the other populations of the outer Solar System.
Unfortunately, we still cannot assess if this is due to differences in the physi-cal nature, or in the aging/rejuvenating processes which modified the surface materials in different way at different solar distances. Further observations,
ACCEPTED MANUSCRIPT
mainly in V+NIR spectroscopy and polarimetry, are absolutely needed to better investigate the nature of Jupiter Trojans and to definitively assess if a genetical link might exist with Trans-Neptunian Objects, Centaurs and short period comets.
Acknowledgments
We thank Beaug´e and Roig for kindly providing us with updated Trojan family list, and R.P. Binzel and J.P. Emery for their useful comments in the reviewing process.
References
Barucci, M. A., Lazzarin, M., Owen, T., Barbieri, C., Fulchignoni, M., 1994. Near–infrared spectroscopy of dark asteroids. Icarus 110, 287-291.
Beaug´e, C., Roig, F., 2001. A Semianalytical Model for the Motion of the Trojan Asteroids: Proper Elements and Families. Icarus 53, 391-415.
Bendjoya, P., Cellino, A., Di Martino, M., Saba, L., 2004. Spectroscopic observations of Jupiter Trojans. Icarus 168, 374-384.
Binzel, R. P., Sauter, L. M., 1992. Trojan, Hilda, and Cybele asteroids -New lightcurve observations and analysis. Icarus 95, 222-238.
ACCEPTED MANUSCRIPT
II (R.P Binzel, T. Gehrels, M.S. Matthews, eds) Univ. of Arizona Press, Tucson, pp. 524–556.
Bus, S. J., Binzel, R.P., 2003. Phase II of the Small Main-Belt Asteroid Spectroscopic Survey. The Observations. Icarus 158, 106–145.
Dahlgren, M., Lagerkvist, C. I., 1995. A study of Hilda asteroids. I. CCD spectroscopy of Hilda asteroids. Astron. Astrophys. 302, 907-914.
Dell’Oro, A., Marzari, P., Paolicchi F., Dotto, E., Vanzani, V., 1998. Trojan collision probability: a statistical approach. Astron. Astrophys. 339, 272-277.
Doressoundiram, A., Peixinho, N., Doucet, C., Mousis, O., Barucci, M. A., Petit, J. M., Veillet, C., 2005. The Meudon Multicolor Survey (2MS) of Centaurs and trans-neptunian objects: extended dataset and status on the correlations reported. Icarus 174, 90–104.
Dotto, E., Fornasier, S., Barucci, M. A., Licandro, J., Boehnhardt, H., Hainaut, O., Marzari, F., de Bergh, C., De Luise, F., 2006. The surface com-position of Jupiter Trojans: Visible and Near–Infrared Survey of Dynamical Families. Icarus 183, 420-434
ACCEPTED MANUSCRIPT
Dumas, C., Owen, T., Barucci, M. A., 1998. Near-Infrared Spectroscopy of Low-Albedo Surfaces of the Solar System: Search for the Spectral Signa-ture of Dark Material. Icarus 133, 221-232.
Emery, J. P., Brown, R. H., 2003. Constraints on the surface composition of Trojan asteroids from near-infrared (0.8-4.0 μm) spectroscopy. Icarus 164, 104-121.
Emery, J. P., Brown, R. H., 2004. The surface composition of Trojan asteroids: constraints set by scattering theory. Icarus 170, 131-152.
Emery, J. P., Cruikshank, D. P., Van Cleve, J., 2006. Thermal emission spectroscopy (5.2 38 μm of three Trojan asteroids with the Spitzer Space Telescope: Detection of fine-grained silicates. Icarus 182, 496-512.
Fernandez Y. R., Sheppard, S. S., Jewitt, D. C., 2003. The Albedo Dis-tribution of Jovian Trojan Asteroids. Astron. J. 126, 1563-1574.
Fitzsimmons, A., Dahlgren, M., Lagerkvist, C. I., Magnusson, P., Williams, I. P., 1994. A spectroscopic survey of D-type asteroids. Astron. Astrophys. 282, 634-642.
Fornasier, S., Lazzarin, M., Barbieri, C., Barucci, M. A., 1999. Spec-troscopic comparison of aqueous altered asteroids with CM2 carbonaceous
ACCEPTED MANUSCRIPT
chondrite meteorites. Astron. Astrophys. 135, 65-73
Fornasier, S., Dotto, E., Marzari, F., Barucci, M.A., Boehnhardt, H., Hainaut, O., de Bergh, C., 2004a. Visible spectroscopic and photometric survey of L5 Trojans : investigation of dynamical families. Icarus, 172, 221– 232.
Fornasier, S., Doressoundiram, A., Tozzi, G. P., Barucci, M. A., Boehn-hardt, H., de Bergh, C., Delsanti A., Davies, J., Dotto, E., 2004b. ESO Large Program on Physical Studies of Trans-Neptunian Objects and Centaurs: fi-nal results of the visible spectroscopic observations. Astron. Astrophys. 421, 353-363.
Hainaut, O. R., Delsanti, A. C., 2002. Colors of Minor Bodies in the Outer Solar System. A statistical analysis. Astron. Astroph. 389, 641-664.
Hudson, R.L., Moore, M.H. 1999. Laboratory Studies of the Formation of Methanol and Other Organic Molecules by Water+Carbon Monoxide Ra-diolysis: Relevance to Comets, Icy Satellites, and Interstellar Ices. Icarus 140, 451-461.
Jewitt, D. C., Luu, J. X., 1990. CCD spectra of asteroids. II - The Tro-jans as spectral analogs of cometary nuclei. Astron. J. 100, 933-944.
ACCEPTED MANUSCRIPT
Jewitt, D. C., Trujillo, C. A., Luu, J. X., 2000. Population and Size Dis-tribution of Small Jovian Trojan Asteroids. Astron. J. 120, 1140-1147
Landolt, A. U., 1992. UBVRI photometric standard stars in the magni-tude range 11.5–16.0 around the celestial equator. Astron. J . 104, 340-371, 436-491.
Lazzaro, D., Angeli, C. A., Carvano, J. M., Moth´e-Diniz, T., Duffard, R., Florczak, M., 2004. S3OS2: the visible spectroscopic survey of 820 asteroids. Icarus 172, 179–220.
Levison, H., Shoemaker, E. M., Shoemaker, C. S., 1997. The dispersal of the Trojan asteroid swarm. Nature 385, 42-44.
Marzari, F., Farinella, P., Davis, D. R., Scholl, H., Campo Bagatin, A., 1997. Collisional Evolution of Trojan Asteroids. Icarus 125, 39-49.
Marzari, F., Scholl, H., 1998a. Capture of Trojans by a Growing Proto-Jupiter. Icarus 131, 41-51.
Marzari, F., Scholl, H., 1998b. The growth of Jupiter and Saturn and the capture of Trojans. Astron. Astroph. 339, 278-285
ACCEPTED MANUSCRIPT
Marzari, F., Scholl, H., Murray, C., Lagerkvist, C., 2002. Origin and Evo-lution of Trojan Asteroids. In Asteroids III, W. F. Bottke Jr., A. Cellino, P. Paolicchi, and R. P. Binzel (eds), University of Arizona Press, Tucson, 725-738.
Marzari, F., Tricarico, P., Scholl, H., 2003. Stability of Jupiter Trojans investigated using frequency map analysis: the MATROS project. MNRAS 345, 1091-1100.
Milani, A., 1993. The Trojan asteroid belt: Proper elements, stability, chaos and families. Celest. Mech. Dynam. Astron. 57, 59-94.
Morbidelli, A., Levison, H. F., Tsiganis, K., Gomes, R., 2005. Chaotic capture of Jupiter’s Trojan asteroids in the early Solar System. Nature 435, 462-465.
Moore, M.H., Donn, B., Khanna, R., A’Hearn, M.F., 1983. Studies of proton-irradiated cometary-type ice mixtures. Icarus 54, 388-405.
Moroz L., Baratta G., Strazzulla G., Starukhina L., Dotto E., Barucci M.A., Arnold G., Distefano E. 2004. Optical alteration of complex organics induced by ion irradiation: 1. Laboratory experiments suggest unusual space weathering trend. Icarus 170, 214-228.
ACCEPTED MANUSCRIPT
Peixinho, N., Doressoundiram, A., Delsanti, A., Boehnhardt, H., Barucci, M. A., Belskaya, I., 2003. Reopening the TNOs color controversy: Centaurs bimodality and TNOs unimodality. Astron. Astrophys. 410, 29–32.
Shoemaker, E. M., Shoemaker, C. S., Wolfe, R. F., 1989. Trojan aster-oids: populations, dynamical structure and origin of the L4 and L5 swarms. In Binzel, Gehrels, Matthews (Eds.), Asteroids II. Univ. of Arizona Press, Tucson, pp. 487-523.
Strazzulla, G., 1998. Chemistry of Ice Induced by Bombardment with Energetic Charged Particles. In Solar System Ices (B. Schmitt, C. de Bergh, M. Festou, eds.), Kluwer Academic, Dordrecht, Astrophys. Space Sci Lib. 281.
Thompson, W.R., Murray, B.G.J.P.T., Khare, B.N., Sagan, C. 1987. Col-oration and darkening of methane clathrate and other ices by charged particle irradiation - Applications to the outer solar system. JGR 92, 14933-14947.
Xu, S., Binzel, R. P., Burbine, T. H., Bus, S. J., 1995. Small main-belt asteroid spectroscopic survey: Initial results. Icarus 115, 1–35.
Vilas, F. 1994. A quick look method of detecting water of hydration in small solar system bodies. LPI 25, 1439-1440.
ACCEPTED MANUSCRIPT
Zappala, V., Cellino, A., Farinella, P., Kne˘zevi´c, Z., 1990. Asteroid fam-ilies. I - Identification by hierarchical clustering and reliability assessment. Astron. J. 100, 2030-2046.
ACCEPTED MANUSCRIPT
ACCEPTED MANUSCRIPT
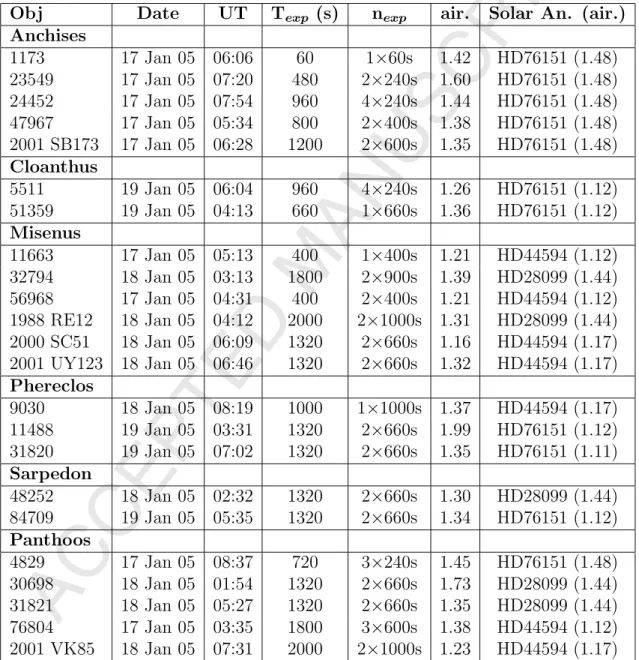
Table 1: Observing conditions of the investigated L5 asteroids. For each object we report the observational date and universal time, total exposure time, number of acquisitions with exposure time of each acquisition, airmass, and the observed solar analogs with their airmass.
Obj Date UT Texp (s) nexp air. Solar An. (air.)
Anchises 1173 17 Jan 05 06:06 60 1×60s 1.42 HD76151 (1.48) 23549 17 Jan 05 07:20 480 2×240s 1.60 HD76151 (1.48) 24452 17 Jan 05 07:54 960 4×240s 1.44 HD76151 (1.48) 47967 17 Jan 05 05:34 800 2×400s 1.38 HD76151 (1.48) 2001 SB173 17 Jan 05 06:28 1200 2×600s 1.35 HD76151 (1.48) Cloanthus 5511 19 Jan 05 06:04 960 4×240s 1.26 HD76151 (1.12) 51359 19 Jan 05 04:13 660 1×660s 1.36 HD76151 (1.12) Misenus 11663 17 Jan 05 05:13 400 1×400s 1.21 HD44594 (1.12) 32794 18 Jan 05 03:13 1800 2×900s 1.39 HD28099 (1.44) 56968 17 Jan 05 04:31 400 2×400s 1.21 HD44594 (1.12) 1988 RE12 18 Jan 05 04:12 2000 2×1000s 1.31 HD28099 (1.44) 2000 SC51 18 Jan 05 06:09 1320 2×660s 1.16 HD44594 (1.17) 2001 UY123 18 Jan 05 06:46 1320 2×660s 1.32 HD44594 (1.17) Phereclos 9030 18 Jan 05 08:19 1000 1×1000s 1.37 HD44594 (1.17) 11488 19 Jan 05 03:31 1320 2×660s 1.99 HD76151 (1.12) 31820 19 Jan 05 07:02 1320 2×660s 1.35 HD76151 (1.11) Sarpedon 48252 18 Jan 05 02:32 1320 2×660s 1.30 HD28099 (1.44) 84709 19 Jan 05 05:35 1320 2×660s 1.34 HD76151 (1.12) Panthoos 4829 17 Jan 05 08:37 720 3×240s 1.45 HD76151 (1.48) 30698 18 Jan 05 01:54 1320 2×660s 1.73 HD28099 (1.44) 31821 18 Jan 05 05:27 1320 2×660s 1.35 HD28099 (1.44) 76804 17 Jan 05 03:35 1800 3×600s 1.38 HD44594 (1.12) 2001 VK85 18 Jan 05 07:31 2000 2×1000s 1.23 HD44594 (1.17)
ACCEPTED MANUSCRIPT
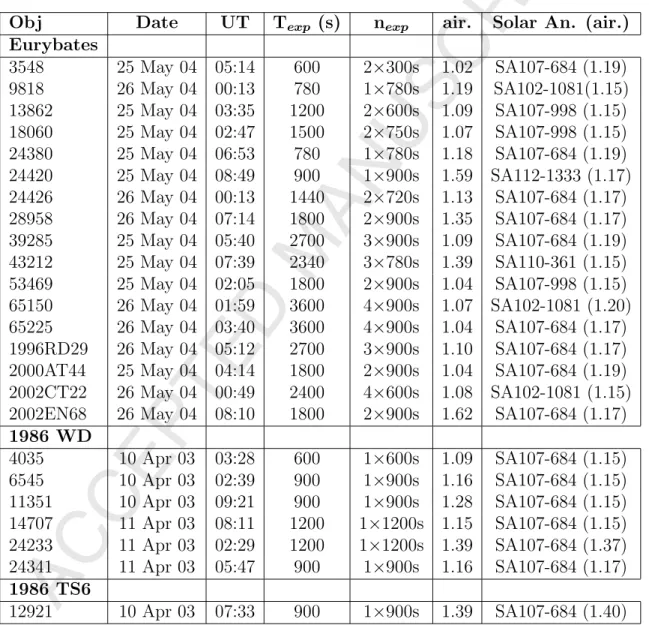
Table 2: Observing conditions of the investigated L4 asteroids. For each object we report the observational date and universal time, total exposure time, number of acquisitions with exposure time of each acquisition, airmass, and the observed solar analogs with their airmass.
Obj Date UT Texp (s) nexp air. Solar An. (air.)
Eurybates 3548 25 May 04 05:14 600 2×300s 1.02 SA107-684 (1.19) 9818 26 May 04 00:13 780 1×780s 1.19 SA102-1081(1.15) 13862 25 May 04 03:35 1200 2×600s 1.09 SA107-998 (1.15) 18060 25 May 04 02:47 1500 2×750s 1.07 SA107-998 (1.15) 24380 25 May 04 06:53 780 1×780s 1.18 SA107-684 (1.19) 24420 25 May 04 08:49 900 1×900s 1.59 SA112-1333 (1.17) 24426 26 May 04 00:13 1440 2×720s 1.13 SA107-684 (1.17) 28958 26 May 04 07:14 1800 2×900s 1.35 SA107-684 (1.17) 39285 25 May 04 05:40 2700 3×900s 1.09 SA107-684 (1.19) 43212 25 May 04 07:39 2340 3×780s 1.39 SA110-361 (1.15) 53469 25 May 04 02:05 1800 2×900s 1.04 SA107-998 (1.15) 65150 26 May 04 01:59 3600 4×900s 1.07 SA102-1081 (1.20) 65225 26 May 04 03:40 3600 4×900s 1.04 SA107-684 (1.17) 1996RD29 26 May 04 05:12 2700 3×900s 1.10 SA107-684 (1.17) 2000AT44 25 May 04 04:14 1800 2×900s 1.04 SA107-684 (1.19) 2002CT22 26 May 04 00:49 2400 4×600s 1.08 SA102-1081 (1.15) 2002EN68 26 May 04 08:10 1800 2×900s 1.62 SA107-684 (1.17) 1986 WD 4035 10 Apr 03 03:28 600 1×600s 1.09 SA107-684 (1.15) 6545 10 Apr 03 02:39 900 1×900s 1.16 SA107-684 (1.15) 11351 10 Apr 03 09:21 900 1×900s 1.28 SA107-684 (1.15) 14707 11 Apr 03 08:11 1200 1×1200s 1.15 SA107-684 (1.15) 24233 11 Apr 03 02:29 1200 1×1200s 1.39 SA107-684 (1.37) 24341 11 Apr 03 05:47 900 1×900s 1.16 SA107-684 (1.17) 1986 TS6 12921 10 Apr 03 07:33 900 1×900s 1.39 SA107-684 (1.40)
ACCEPTED MANUSCRIPT
Table 3: Visible photometric observations of L4 and L5 Trojans (ESO-NTT EMMI): for each object, date, computed V magnitude, B-V, R and V-I colors are reported. The given UT is for the V filter acquisition. The observing photometric sequence (V-R-B-I) took a few minutes.
Object date UT V B-V V-R V-I
L4 1986 WD 4035 10 Apr 03 03:11 16.892±0.031 0.752±0.040 0.473±0.042 0.926±0.055 4035 10 Apr 03 04:22 16.981±0.031 0.752±0.040 0.495±0.042 0.945±0.055 6545 10 Apr 03 02:22 17.558±0.031 0.734±0.041 0.499±0.042 0.935±0.055 11351 10 Apr 03 09:03 18.407±0.032 0.739±0.044 0.498±0.044 0.900±0.057 14707 11 Apr 03 06:46 18.666±0.031 0.751±0.041 0.401±0.033 0.804±0.055 14707 11 Apr 03 08:37 18.873±0.031 0.754±0.041 0.424±0.033 0.790±0.056 24233 11 Apr 03 01:33 18.894±0.034 0.704±0.051 0.481±0.037 0.899±0.058 24341 11 Apr 03 05:05 19.376±0.032 0.713±0.043 0.369±0.035 0.759±0.057 1986 TS6 12921 10 Apr 03 07:12 18.393±0.031 0.673±0.040 0.421±0.042 0.786±0.055 L5 cut off 150m/s Anchises 1173 17 Jan 05 05:54 16.595±0.024 0.811±0.034 0.402±0.035 0.805±0.038 23549 17 Jan 05 07:09 18.969±0.050 0.800±0.071 0.485±0.068 0.872±0.075 24452 17 Jan 05 07:48 18.757±0.043 0.872±0.056 0.441±0.056 0.847±0.066 47967 17 Jan 05 05:27 19.382±0.044 0.899±0.058 0.489±0.069 0.965±0.075 2001 SB173 17 Jan 05 06:20 19.882±0.043 0.992±0.060 0.503±0.064 0.927±0.078 Cloanthus 5511 19 Jan 05 05:52 17.968±0.020 0.906±0.027 0.442±0.027 0.968±0.032 51359 19 Jan 05 03:54 19.631±0.102 0.864±0.201 0.447±0.131 0.885±0.164 Misenus 11663 17 Jan 05 05:05 18.473±0.022 0.837±0.030 0.409±0.030 0.872±0.039 32794 18 Jan 05 03:07 19.685±0.038 0.923±0.065 0.393±0.056 0.879±0.057 56968 17 Jan 05 04:18 18.596±0.026 0.986±0.040 0.494±0.033 1.003±0.036 1988 RE12 18 Jan 05 04:00 20.892±0.081 0.826±0.132 0.388±0.108 0.871±0.106 2000 SC51 18 Jan 05 06:03 19.876±0.038 1.016±0.055 0.444±0.059 0.896±0.056 2001 UY123 18 Jan 05 06:41 19.869±0.047 0.890±0.058 0.537±0.056 0.971±0.063 Phereclos 9030 18 Jan 05 08:14 18.397±0.020 0.887±0.024 0.493±0.027 0.973±0.028 11488 19 Jan 05 02:57 18.931±0.066 0.868±0.101 0.430±0.079 0.848±0.084 31820 19 Jan 05 06:39 20.041±0.077 0.889±0.093 0.520±0.091 0.916±0.123 Sarpedon 48252 18 Jan 05 02:25 19.878±0.060 0.949±0.100 0.467±0.093 0.903±0.090 84709 19 Jan 05 05:10 19.862±0.068 0.855±0.087 0.462±0.090 1.010±0.094 Panthoos 4829 17 Jan 05 08:18 18.430±0.029 0.851±0.050 0.420±0.039 0.792±0.052 30698 18 Jan 05 01:45 19.353±0.036 – 0.472±0.042 0.865±0.047 31821 18 Jan 05 05:21 19.328±0.076 0.980±0.111 0.440±0.097 0.901±0.108 76804 17 Jan 05 03:21 19.471±0.065 0.803±0.082 0.446±0.070 0.889± 0.080