HAL Id: halshs-00556802
https://halshs.archives-ouvertes.fr/halshs-00556802
Preprint submitted on 17 Jan 2011
HAL is a multi-disciplinary open access archive for the deposit and dissemination of sci-entific research documents, whether they are pub-lished or not. The documents may come from teaching and research institutions in France or abroad, or from public or private research centers.
L’archive ouverte pluridisciplinaire HAL, est destinée au dépôt et à la diffusion de documents scientifiques de niveau recherche, publiés ou non, émanant des établissements d’enseignement et de recherche français ou étrangers, des laboratoires publics ou privés.
Gbewopo Attila
To cite this version:
Gbewopo Attila. Corruption and quality of public institutions: evidence from Generalized Method of Moment. 2011. �halshs-00556802�
1 Document de travail de la série
Etudes et Documents
E 2008.13
Corruption and quality of public institutions: evidence from
Generalized Method of Moment
Gbewopo Attila1
University Clermont I, CERDI-CNRS
June 2008
1
We are am grateful to Jean-Louis Combes (CERDI, University of Auvergne), Gérard Chambas (CERDI, University of Auvergne), Mathilde Maurel (University of Paris I, Pantheon-Sorbonne), Wladimir Andreff (University of Paris I, Pantheon-Sorbonne) and François Roubaud (DIAL, IRD, Paris), Abdul Mijiyawa (CERDI, University of Auvergne) for constructive comments and suggestions. The usual disclaimer applies. Please address correspondence to CERDI, 65 Boulevard François Mitterrand 63000 Clermont Ferrand, France; e-mail: G.ATTILA@u-clermont1.fr . Tel: + 00 33 4 73 17 74 22; Fax: + 00 33 4 73 17 74 28.
2
Abstract
The aim of this paper was to re-examine the relationship between the quality of public institutions and corruption. Estimations from generalized method of moments show that better public institutions (regulation, bureaucracy, political structures) are associated with lower levels of corruption.
Keywords: Corruption, public institutions. JEL Classification: D73, P48.
3
1- Introduction
Many empirical studies examine the impact of a specific public institution (bureaucratic, judicial or political) on corruption. Graeff and Mehlkop (2003) found that the relationship between economic freedom and corruption depends on a country's level of development. Ledermann et al (2005) confirmed the importance of political institutions in curbing corruption. Seldadyo and de Haan (2005) using Extreme Bound Analysis (EBA) concluded that institutional variable like political freedom and judicial system affect corruption. Using the EBA, Serra (2006) showed that corruption is lower where democratic institutions have been preserved for a long continuous period but higher when political instability is important.
The present paper departs from many existing empirical studies of determinants of corruption on three main fronts. Firstly, it considers public institutions in a wide sense to include bureaucratic administrations and political structures as well as policies undertaken by public authorities. Estimates based on the same sample make it possible to compare the impact of various aspects of public institutions.
Secondly, we address the problem of endogeneity of the variables of public institutions. Previous studies did not adequately account for the problem of simultaneity bias and endogeneity and hence the coefficients estimated were biased. Public institutions affect the level of corruption but conversely corruption shapes the quality of these institutions. In addition, the problem of endogeneity may result from errors of measurement of corruption and indicators of the quality of public institutions, which are subjective evaluations.
Thirdly, this paper addresses the issue of omitted variables by controlling for many other determinants of corruption. Lambsdorff and Cornelius (2000), using simple correlation coefficients, showed a positive relation between corruption and the uncertainty of regulation. Chowdhury (2004) used instrumental analysis when analyzing the impact of democracy and press freedom on corruption but did not completely control for other determinants of corruption (their table 2). The omission of variables such as social structures or economic factors may lead to inconsistent estimates.
4 In section 2, we outline the empirical approach and selected variables and in section 3 present the main results.
2- The empirical approach and data
Estimations cover five periods (1996, 1998, 2000, 2002 and 2004) and a sample of 73 countries. Several corruption equations are estimated with right-side variables capturing public institutions and a set of control variables (economic development, social and historical variables).
2.1- The econometric method
To deal with the problem of endogeneity, we used the Generalized Method of Moments (GMM), which is more efficient than the standard instrumental variables in the presence of heteroskedasticity (Baum et al, 2003).
We parsimoniously chose as instruments the political rights index of “Freedom House” and the democracy index of “Polity IV”. The political right variable ranks countries on a scale of 1 (most free) to 7 (least free). The democracy index describes the general openness of public institutions to political parties and ranges from 0 (low) to 10 (high).
While these variables may characterize democratic systems in general, we argue that they are exogenous. First, several studies found no significant effect of democracy on corruption (Paldam, 2002; Treisman, 2000; Rose-Akerman, 1999; Serra, 2006; Brunetti and Weder, 2003). Secondly, in order to validate these instruments, we performed the test of weak instruments based on the statistics of Cragg-Donald (1993) (see Stock and Yogo, 2005; Staiger and Stock, 1997) and the over-identification test based on the J statistic of Hansen (1982).
Since time-varying variables of control may be potentially endogenous, we use their lagged values.
5
2.2- Measurement of corruption
Data on corruption come from the database of Kaufmann, Kraay and Mastruzzi (KKM) (2005). We rescaled this variable from 0 (lowest corruption) to 10 (highest corruption). This index is a composite one and is therefore more reliable than any individual indicator. The KKM data include continuous variables, and so allow us to dispense with multinomial model regressions.
2.3- Measuring the quality of public institutions
We used six different indicators:
1- Quality of bureaucracy: measures the important changes in public policies or the frequency of interruption in delivery of public services.
2- Effectiveness of government: includes the stability, predictability and effectiveness of governments’ actions.
3- Public regulation: measures quantitative regulations, price controls and other unjustified interventions in economic activities.
4- Influence and political responsibilities: includes political rights and civil liberties, participation in electoral process, independence of medias, accountability and openness in public decisions.
5- Civil liberties: describes the general state of liberty in a country.
6- Efficiency of judicial system: includes the respect of law and order, the predictability and efficiency of the judicial system and enforcement of contracts.
Each variable was rescaled so that lower values represent bad performance and higher values good performance.
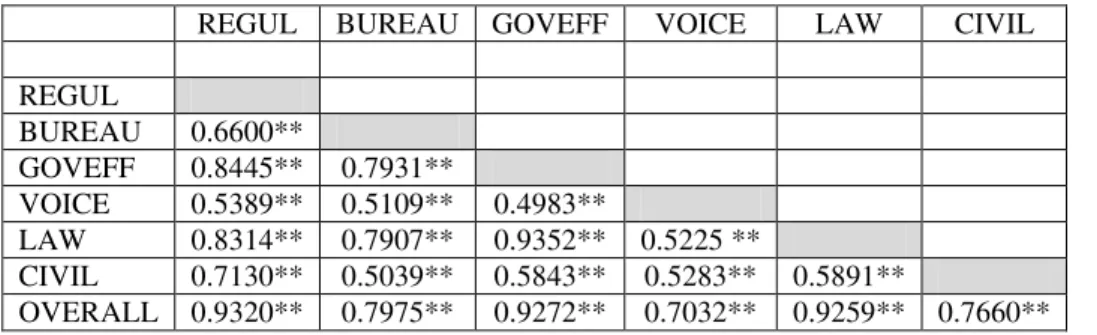
A main characteristic of the indicators of public institutions is the high correlation between them (simple correlation coefficient between 0.52 and 0.93) (table 1).
Table 1: Correlations coefficients
REGUL BUREAU GOVEFF VOICE LAW CIVIL REGUL BUREAU 0.6600** GOVEFF 0.8445** 0.7931** VOICE 0.5389** 0.5109** 0.4983** LAW 0.8314** 0.7907** 0.9352** 0.5225 ** CIVIL 0.7130** 0.5039** 0.5843** 0.5283** 0.5891** OVERALL 0.9320** 0.7975** 0.9272** 0.7032** 0.9259** 0.7660**
6
3- Empirical estimates 3.1- Main results
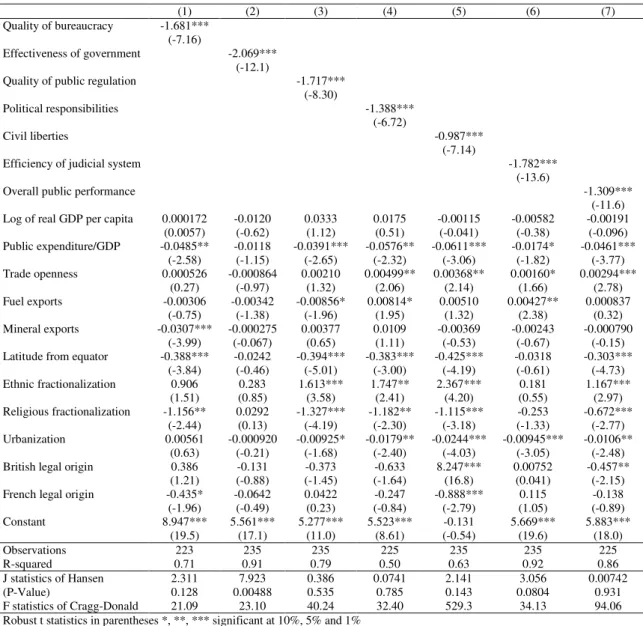
The results from the GMM are given in table 3. We controlled for many other determinants of corruption as already identified in the literature. The statistics of Hansen and Cragg-Donald (table 2) show the relevance and weak exogeneity of instrumental variables.
Tableau 2: Corruption and quality of public institutions
(1) (2) (3) (4) (5) (6) (7) Quality of bureaucracy -1.681***
(-7.16)
Effectiveness of government -2.069*** (-12.1)
Quality of public regulation -1.717*** (-8.30)
Political responsibilities -1.388*** (-6.72)
Civil liberties -0.987***
(-7.14)
Efficiency of judicial system -1.782***
(-13.6)
Overall public performance -1.309***
(-11.6) Log of real GDP per capita 0.000172 -0.0120 0.0333 0.0175 -0.00115 -0.00582 -0.00191
(0.0057) (-0.62) (1.12) (0.51) (-0.041) (-0.38) (-0.096) Public expenditure/GDP -0.0485** -0.0118 -0.0391*** -0.0576** -0.0611*** -0.0174* -0.0461*** (-2.58) (-1.15) (-2.65) (-2.32) (-3.06) (-1.82) (-3.77) Trade openness 0.000526 -0.000864 0.00210 0.00499** 0.00368** 0.00160* 0.00294*** (0.27) (-0.97) (1.32) (2.06) (2.14) (1.66) (2.78) Fuel exports -0.00306 -0.00342 -0.00856* 0.00814* 0.00510 0.00427** 0.000837 (-0.75) (-1.38) (-1.96) (1.95) (1.32) (2.38) (0.32) Mineral exports -0.0307*** -0.000275 0.00377 0.0109 -0.00369 -0.00243 -0.000790 (-3.99) (-0.067) (0.65) (1.11) (-0.53) (-0.67) (-0.15) Latitude from equator -0.388*** -0.0242 -0.394*** -0.383*** -0.425*** -0.0318 -0.303***
(-3.84) (-0.46) (-5.01) (-3.00) (-4.19) (-0.61) (-4.73) Ethnic fractionalization 0.906 0.283 1.613*** 1.747** 2.367*** 0.181 1.167*** (1.51) (0.85) (3.58) (2.41) (4.20) (0.55) (2.97) Religious fractionalization -1.156** 0.0292 -1.327*** -1.182** -1.115*** -0.253 -0.672*** (-2.44) (0.13) (-4.19) (-2.30) (-3.18) (-1.33) (-2.77) Urbanization 0.00561 -0.000920 -0.00925* -0.0179** -0.0244*** -0.00945*** -0.0106** (0.63) (-0.21) (-1.68) (-2.40) (-4.03) (-3.05) (-2.48) British legal origin 0.386 -0.131 -0.373 -0.633 8.247*** 0.00752 -0.457**
(1.21) (-0.88) (-1.45) (-1.64) (16.8) (0.041) (-2.15) French legal origin -0.435* -0.0642 0.0422 -0.247 -0.888*** 0.115 -0.138 (-1.96) (-0.49) (0.23) (-0.84) (-2.79) (1.05) (-0.89) Constant 8.947*** 5.561*** 5.277*** 5.523*** -0.131 5.669*** 5.883*** (19.5) (17.1) (11.0) (8.61) (-0.54) (19.6) (18.0) Observations 223 235 235 225 235 235 225 R-squared 0.71 0.91 0.79 0.50 0.63 0.92 0.86 J statistics of Hansen 2.311 7.923 0.386 0.0741 2.141 3.056 0.00742 (P-Value) 0.128 0.00488 0.535 0.785 0.143 0.0804 0.931 F statistics of Cragg-Donald 21.09 23.10 40.24 32.40 529.3 34.13 94.06 Robust t statistics in parentheses *, **, *** significant at 10%, 5% and 1%
Estimations show that all the variables of public performance are significantly inversely related to corruption. Better public regulation of economic activity helps to reduce
7 corruption. Likewise, the better the quality of bureaucracy the lower the level of corruption. The effectiveness of public policies has an adverse and significant effect on corruption.
With respect to political institution variables, estimations evidenced a negative and significant causal relationship between political responsibilities, civil liberties and efficiency of the judicial system.
Another important result is that each public institutions variable had a different reducing-impact on corruption. The variables describing the quality of government bureaucracy seems to have a greater impact than that of political structures. A one standard-deviation of government effectiveness (0.94) contributes toward reducing corruption by 2 points (=0.94*2.069) (on a scale ranging from 0 to 10). Increasing civil liberty to a level equal to a one standard-deviation only reduces corruption by less than 1 point: 0.81 points.
3
.2- Robustness analysisIn addition to the six indicators, we calculated a composite index of overall public institution performance using the method of principal components. The rationale for aggregating is to obtain a better estimate of the impact of public institutions on corruption once the measurement errors in individual indexes are accounted for.
High correlations appear between this variable and the individual institutional variables (see table 1).
The last column of table 2 (7) shows a significant impact of this variable. A one standard-deviation change in overall public performance decreases corruption by 1.31 points, a decrease lower than the average impact of the quality of public administration (1.88) but roughly equal to the average impact of political characteristics (1.31).
4- Conclusion
This study departs from previous empirical research and rigorously tests the causal relationship between the quality of public institutions and corruption by correcting for endogeneity. Estimations show that that better public institutions (in the form of better
8 regulation, better bureaucracy, political responsibility, a greater degree of civil liberty and a more effective judicial system) are associated with lower levels of corruption.
The results of this paper therefore support institutional reforms in developing countries that aim at improving the quality of public institutions.
References
Brunetti, A., Weder, B., 2003, A free press is bad news for corruption. Journal of Public Economics 87, 1801–1824.
Chowdhury, S. K., 2004, "The effect of democracy and press freedom on corruption: an empirical test", Economics Letters, vol. 85, no. 1, pp.93-101.
Cragg, J. G. and S. G. Donald, 1993, Testing Identifiability and Specification in Instrumental Variable Models, Econometric Theory, Vol. 9, No.2.
Gerring, J. and S. C. Thacker, 2004, Political Institutions and Corruption: The Role of Unitarism and Parliamentarism, British Journal of Political Science, Vol. 34, No. 02. Gerring, J. and S. C. Thacker, 2005, Do Neoliberal Policies Deter Political Corruption?,
International Organization, Vol. 59, No. 01.
Graeff, P. and G. Mehlkop, 2003, The impact of economic freedom on corruption: different patterns for rich and poor countries, European Journal of Political Economy, Vol. 19, No. 3.
Kaufmann, D., A. Kraay and M. Mastruzzi, 2005, Governance Matters IV: Governance Indicators for 1996-2004, World Bank Working Paper N° 3630.
Lapalombara, J. ,1994, Structural and Institutional Aspects of Corruption, Social Research, Vol. 61, No. 2.
Lambsdorff, J. G. and P. Cornelius, 2000, Corruption, Foreign Investment and Growth, The
Africa Competitiveness Report 2000/2001.
Lederman, D., N. Loayza and R. R. Soares, 2005, Accountability and Corruption: Political Institutions Matter, Economics and Politics, Vol. 17.
Paldam, M., 2002, The cross-country pattern of corruption: economics, culture and the seesaw dynamics, European Journal of Political Economy, Vol. 18, No. 2.
Rose-Ackerman, S., 1999, Corruption and Government: Causes, Consequences, and Reform, Cambridge University Press.
Seldadyo, H. and J. De Haan, 2005, The Determinants of Corruption: A Reinvestigation, Presented at the EPCS–2005 conference, Durham, UK.
Staiger, D. and J. H. Stock, 1997, Instrumental Variables Regression with Weak Instruments, Econometrica, Vol. 65, No. 3.
Stock, J. H. and M. Yogo, 2005, Testing for Weak Instruments in: Linear IV Regression, in Identification and Inference for Econometric Models: Essays in Honor of Thomas J. Rothenberg, Cambridge University Press.
Treisman, D., 2000, The causes of corruption: a cross-national study, Journal of Public Economics, Vol. 76, No. 3.