HAL Id: inserm-00851276
https://www.hal.inserm.fr/inserm-00851276
Submitted on 13 Aug 2013
HAL is a multi-disciplinary open access
archive for the deposit and dissemination of
sci-entific research documents, whether they are
pub-lished or not. The documents may come from
teaching and research institutions in France or
abroad, or from public or private research centers.
L’archive ouverte pluridisciplinaire HAL, est
destinée au dépôt et à la diffusion de documents
scientifiques de niveau recherche, publiés ou non,
émanant des établissements d’enseignement et de
recherche français ou étrangers, des laboratoires
publics ou privés.
Reciprocal projections in hierarchically organized
evolvable neural circuits affect EEG-like signals.
Vladyslav Shaposhnyk, Alessandro Villa
To cite this version:
Vladyslav Shaposhnyk, Alessandro Villa. Reciprocal projections in hierarchically organized
evolv-able neural circuits affect EEG-like signals..
Brain Research, Elsevier, 2012, 1434, pp.266-76.
�10.1016/j.brainres.2011.08.018�. �inserm-00851276�
Reciprocal projections in hierarchically organized evolvable neural circuits affect
EEG-like signals
Vladyslav Shaposhnyka, Alessandro E.P. Villaa
aINSERM U836; Grenoble Institute of Neuroscience; Universit´e Joseph Fourier, Eq7 Nanom´edecine et Cerveau, Grenoble, France
Abstract
Modular architecture is a hallmark of many brain circuits. In the cerebral cortex, in particular, it has been observed that reciprocal connections are often present between functionally interconnected areas that are hierarchically organized. We investigate the effect of reciprocal connections in a network of modules of simulated spiking neurons. The neural activity is recorded by means of virtual electrodes and EEG-like signals, called electrochipograms (EChG), analyzed by time- and frequency-domain methods. A major feature of our approach is the implementation of important bio-inspired processes that affect the connectivity within a neural module: synaptogenesis, cell death, spike-timing-dependent plasticity and synaptic pruning. These bio-inspired processes drive the build-up of auto-associative links within each module, which generate an areal activity, recorded by EChG, that reflect the changes in the corresponding functional connectivity within and between neuronal modules. We found that circuits with intra-layer reciprocal projections exhibited enhanced stimulus-locked response. We show evidence that all networks of modules are able to process and maintain patterns of activity associated with the stimulus after its offset. The presence of feedback and horizontal projections was necessary to evoke cross-layer coherence in bursts of γ-frequency at regular intervals. These findings bring new insights to the understanding of the relation between the functional organization of neural circuits and the electrophysiological signals generated by large cell assemblies.
Keywords: spiking neural networks, computational neuroscience, electro-encephalography, genetics, hierarchical circuits, evolvable systems
1. Introduction
Brain activity recordings by means of electroencephalogra-phy (EEG), electrocorticograelectroencephalogra-phy (ECoG) and local field po-tentials (LFP) collect signals generated by multiple cell assem-blies. The neurophysiological processes underlying those sig-nals are determined by highly non-linear dynamical systems (Freeman, 1975; Nunez and Srinivasan, 2006). The complex-ity of these processes opened the way to large-scale simulations and neural mass models that were mainly focused on the detec-tion of scale-free invariants and self-organized activity (Wright, 1999; Freeman, 2005; Breakspear and Stam, 2005; Deco et al., 2008; Goodfellow et al., 2011).
Mathematical and computational models relying on neuro-physiological models of EEG signals have been proposed, gen-erally based on population dynamics (Knight, 2000; Drover et al., 2010), pulsed coupled oscillators (Ly and Ermentrout, 2009) and coupled neural masses (Sotero et al., 2007; Ursino et al., 2010). The simulation studies of event-related EEG per-formed with these models have emphasized how modulation of the strengths of positive and negative feedback between brain modules may affect the wave shape and the time course of event-related potentials (ERPs) (Rennie et al., 2002) and in par-ticular the emergence of damped oscillations in the presence of backward connections (David et al., 2005).
In the present study we simulate the activity of intercon-nected modules of spiking neurons undergoing ontogenic and
epigenetic developmental phases (Iglesias and Villa, 2007, 2010). In addition to multiple spike trains we record neuro-mimetic signals, called electrochipograms (EChG), similar to ECoG and LFP, by the means of realistic virtual electrodes (Shaposhnyk et al., 2009). The neural circuit is characterized by two layers of feed-forward networks and we study the emer-gent properties of stimulus response in presence of feedback projections between the layers of networks and intra-layer pro-jections (horizontal propro-jections). Our simulation framework in-troduces also genetic features such that model parameters are coded in the neuronal genome and we implement gene drift through generations of the neural circuits in order to observe general results that are shared by all generated networks. The rationale is that the Spike-timing-dependent Plasticity (STDP) embedded in the neural network models would drive the build-up of auto-associative network links, within each neural mod-ule, which generate an areal activity, detected by EChG, that would reflect the changes in the corresponding functional con-nectivity within and between neuronal modules.
2. Methods
2.1. Module characteristics
The characteristics of a neuronal module have been exten-sively studied and described elsewhere (Iglesias et al., 2005; Iglesias and Villa, 2007, 2008) and we summarize here the main
Table 1: Main parameters used for the simulation (Iglesias et al., 2005).
Parameter Value
1 Network module at birth
neurons (2D lattice 75 × 75) 5,625
projections ≈890,000
external afferent e.p.s.p. 1.90 mV
background afferent e.p.s.p.(1) 1.90 mV
intensity of background activity 300 spikes/s Common cell membrane parameters
reset threshold -78 mV
spiking threshold -40 mV
membrane time constant 16 ms
Excitatory cell population
proportion in network 80%
Gaussian maximal probability 60%
Gaussian distribution witdh 15 units
absolute refractory period 1 ms
e.p.s.p.(2) 1.84 mV
Inhibitory cell population
proportion in network 20%
Gaussian maximal probability 20%
Gaussian distribution width 45 units
absolute refractory period 0.7 ms
i.p.s.p. -1.64 mV
(1)equal to 3.80 mV in the Sensory module. (2)
in the range 0.92-3.68 mV following STDP.
features. Each network module was simulated by a 2D lattice of 75 × 75 leaky integrate-and-fire neuronal models, that in-cludes 80% of excitatory neurons and 20% of inhibitory neu-rons, whose main parameters are summarized in Table 1.
A major feature of our approach is the implementation of important bioinspired processes (Iglesias and Villa, 2010) that affect the connectivity within a neural module: synaptogene-sis, cell death, synaptic plasticity and synaptic pruning. During
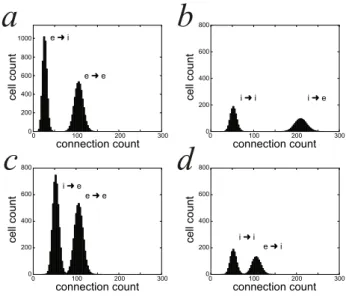
synaptogenesis each cell established a pattern of projections such that a cell of either type could project to a cell of either type, avoiding self-connections. The selection of the target cells was random and run independently for each cell of either type according to a 2D Gaussian probability distribution (Hill and Villa, 1997). In addition, the excitatory cells had a uniform probability of 2% to establish long-range connections through-out the neural module. On average, one excitatory cell pro-jected to ∼106 excitatory and to ∼27 inhibitory cells (Fig. 1a). On average, one inhibitory cell projected to ∼210 excitatory and to ∼52 inhibitory cells (Fig. 1b). No spatial organization was predefined within a module. No new projection is added to the network after the initial stage of synaptogenesis.
We have implemented two types of cell death : “apoptosis” or programmed cell death, which is active at the begin of circuit maturation and “necrotic cell death”, which occurs when neu-rons do not establish enough connections with other neuneu-rons either due to an anomalous brain development or to a loss in connections (synaptic pruning) occurring at any stage after the
i➜ e i➜ i e➜ e e➜ i 0 100 200 300 connection count 0 200 400 600 800 1000 ce ll co u n t e➜ e i➜ e e➜ i i➜ i
d
a
c
b
0 100 200 300 connection count 0 100 200 300 connection count 0 100 200 300 connection count 0 200 400 600 800 ce ll co u n t 0 200 400 600 800 ce ll co u n t 0 200 400 600 800 ce ll co u n tFigure 1: Cumulative distributions of the efferences (a,b) and afferences (c,d) within one neural module at the end of the synaptogenesis. (a) excitatory ef-ferent connections to excitatory cells (e→e) and to inhibitory cells (e→i). (b) inhibitory efferent connections to excitatory cells (i→e) and to inhibitory cells (i→i). (c) excitatory afferent connections from excitatory cells (e→e) and from inhibitory cells (i→e). (d) inhibitory afferent connections from excitatory cells (e→i) and from inhibitory cells (i→i).
developmental phase (Hutchins and Barger, 1998). Apoptosis is aimed to reflect the biological massive synaptic pruning as-sociated with cell death occurring during early stages of neural development, right after initial excessive and to some extent dif-fusive synapse generation (Rakic et al., 1986; Innocenti, 1995). In the current framework apoptosis was implemented according to Iglesias and Villa (2010) and was made effective during the initial 750 ms of the simulation, an interval corresponding to only 0.2% of the total duration of the simulation but accounting for the death of nearly 30% of the neurons.
Synaptic plasitictybased on STDP was enabled at the end of the phase characterized by apoptosis. This plasticity mecha-nism was limited here to excitatory receptors, that means it af-fected both excitatory-excitatory and excitatory-inhibitory con-nections. The STDP modification rule was implemented ac-cording to Iglesias et al. (2005), thus reducing the synaptic weights to four discrete states determined by activation levels. The strength of inhibitory projections was unchanged during the entire simulation. Whenever the synaptic weight of any excitatory-excitatory or excitatory-inhibitory synapse reached a value of zero, due to the depression associated with STDP, the synapse died and was removed, thus leading to synaptic
pruning. Whenever a cell lost all its excitatory inputs from within the same module because of synaptic pruning it entered a “necrotic cell death” and the cell was removed. This process was active during the whole simulation, in contrast to apoptosis which was active only during the early developmental stage.
In addition to the afferences from the other cells of the mod-ule all cells of either type received inputs from a background source. In this study the background activity was generated by uncorrelated Poisson-distributed inputs at an average rate of 2
300 spikes/s with an excitatory postsynaptic potential (e.p.s.p) of 1.90 mV. The sole exception to this rule was the “sen-sory” module that was characterized by background e.p.s.p.s of 3.80 mV, aimed to produce a stronger noise at the peripheral level.
2.2. Hierarchical network of modules
In each neuronal module two sets of cells were randomly se-lected among the excitatory cells of the network. They corre-spond to the efferent and the afferent layer of the module. In the module excited by the external stimulus (referred to as the ‘sensory’ module) each set was formed by 450 excitatory cells. In the other modules the afferent and the efferent layers were formed by 450 and 900 excitatory cells, respectively.
Synapto-genesisincludes also the establishment of the connections be-tween neural modules following a self-reflective mapping such that the number of inter-module projections from a particular efferent neuron is proportional to the number of intra-module projections of the same neuron (Shaposhnyk et al., 2009). Then, cells of the afferent and efferent layers receive and send excita-tory projections to and from other neuronal modules in addition to their intra-module connections (of both excitatory and in-hibitory types like any other cell). The excitatory inter-module projections are characterized by a synaptic weight of 1.90 mV. In the current study these synapses are not characterized by STDP and their strength is unchanged during the entire sim-ulation.
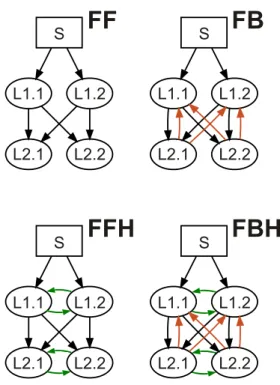
Four circuit graphs featuring different combinations of recip-rocal inter-module links were used in this study. All modules were composed by a neural network of 75 × 75 cells. An input module excited by an external stimulus is referred to as the ‘sen-sory’ module (S) and the other modules are referred to as ‘pro-cessing’ modules and labeled according to the layer’s position in the hierarchical organization (i.e. L1.x, L2.x, Ln.x). Figure 2 shows the circuits studied here, formed by two parallel streams and by two layers. The two main topological features of the circuits were the presence of reciprocal projections within each processing layer (i.e. horizontal connections) and the presence of reciprocal projections between successive processing layers. Then, the basic circuitry characterized by a pure f eed- f orward pattern of projections is termed FF. The FF circuit with addi-tional f eedback projections between layers is termed FB. Cir-cuits are termed FFH and FBH with horizontal links added to FF and FB circuits, respectively.
2.3. Virtual Subjects
We have implemented a framework that supports basic evo-lutionary features. Each next-generation circuit is produced by a parent circuit with a probability specified by a fitness func-tion at the time corresponding to the end of the simulafunc-tion of the parent’s circuit. In this study we use a dummy fitness func-tion that always provides a 100% probability of replicafunc-tion, but the framework supports user-defined or behaviorally-defined fitness functions. At the time of the replication a mutation op-erator introduces variability in the circuit’s properties.
S
L1.1
L2.1
L1.2
L2.2
S
L1.1
L2.1
L1.2
L2.2
S
L1.1
L2.1
L1.2
L2.2
S
L1.1
L2.1
L1.2
L2.2
FF
FB
FFH
FBH
Figure 2: Four hierarchical circuits used in the experiment. The arrows de-pict projections and directions of information flow between the neural network modules. FF: feed-forward topology without horizontal projections within the same processing layer; FB: same as FF with feedback projections between suc-cessive layers (orange arrows); FFH: feed-forward topology with reciprocal projections within processing layer (horizontal connections labeled with green arrows); FBH: same as FBH with additional feedback projections
In the current study we applied the multiple bit-flip muta-tion operator, which is an extension of the single bit-flip oper-ator (Langdon, 2010), to the gene that coded the “connectivity seed” (the other parameters such as the e.p.s.p. were left fixed here) A small variation of this gene is enough to produce drasti-cally different intra-module connection maps, while preserving the distribution of the connections; the same seed will warrant that the connectivity map is the same, which is useful for the reproducibility of results. For any given circuit graph we con-sidered 21 generations that corresponds to 21 different virtual subjects, each one being characterized by a random mutation of the ‘connectivity seed’ gene.
2.4. External stimulation and Inter-Stimulus Interval
The external stimulation was applied by means of a spa-tiotemporal stimulus fed to the afferent cells of the sensory module (Shaposhnyk et al., 2009). The stimulus lasted 500 ms and activated each afferent cell once per 10 ms on average. Each stimulus was followed by a silent period of 1000 ms called inter-stimulus interval (ISI). The duration corresponding to the stimulus application and ISI is called an elementary stimulus “trial”. The stimulation was repeated regularly at a rate of 0.67 Hz given the trial duration of 1500 ms. At each repetition the pattern was slightly modified by introducing a 10% variabil-ity of the initial motif. A jitter of ±1 ms was introduced in the activation time of 10% of randomly selected sensory afferent cells. This straightforward procedure was repeated irrespective
Amp lit u d e [µ V ] 0 10 20 30 40 50 50 100 150 200 250 Trial # FBH Layer 1 FBH Layer 2
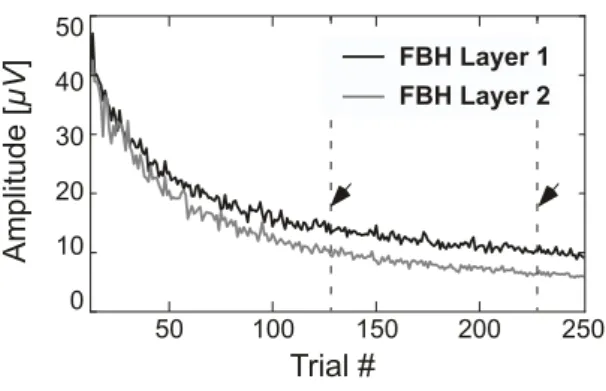
Figure 3: Time course of the peak-to-peak amplitude of the EChG for each layer of circuit FBH measured during the ISI as a function of the trial number. Each point is the average of 84 recordings. The dashed lines and the arrows in-dicate the range between trials #128 and #228 that has been selected for further averaging for event-related analysis.
of the selected cells, so that a cell could be selected more than once by chance and the final jitter becoming more than ±1 ms. This occurrence introduced even greater variability but it hap-pened only rarely.
2.5. Virtual electrodes
A virtual electrode recorded a neuro-mimetic signal, called electrochipogram (EChG), over a certain “area” of 2D neuronal lattice according to the appropriate weights describing the elec-trode’s sensitivity (Shaposhnyk et al., 2009). The main param-eters of the electrode are its position over the module, its cov-erage area and its sensitivity function. In this study the elec-trode’s sensitivity was limited by a circular area with a radius of 19 cells and the sensitivity function was decaying linearly from the center (100%) to its edge (0%). Two electrodes, one located in the top-left “extremity” of the 2D lattice and the sec-ond one located in the bottom-right “extremity”, were placed in each module. The dual recording is performed only to gather additional signals for data analysis and reduce the effect of the noise embedded in the signal. Indeed, no difference between the electrode locations is expected because of the wrapped toroidal model of the network’s lattice and the random distribution of the efferent and the afferent cells across each module.
3. Results
3.1. Electrochipograms and Event-Releated Potentials
The total duration of a single simulation run lasted 375 sec-onds (250 trials of 1500 ms each). In order to improve the signal-to-noise ratio of the EChG in the time-domain we have calculated ERPs by averaging several recordings triggered by the same stimulus onset. The average was extended across all 21 different virtual subjects obtained by genome mutation. For each circuit graph the EChG signal was recorded by two virtual electrodes per module. Moreover, we grouped together the four recordings performed from within the same layer of modules (2 recordings × 2 modules per layer). This means that for each
circuit graph and for each layer of the circuit we analyzed the signals averaged across 84 recordings (= 21 × 2 × 2).
The effect of network maturation due to plasticity, synap-tic pruning and cell death processes is illustrated by the time course of the peak-to-peak amplitudes of the EChG signal mea-sured during the ISI of successive trials (Fig. 3). The curves show that the maximum amplitude of Layer 2 activity tended to decrease more than in Layer 1 until approximately trial #100. After this time both layers showed a tendency to decrease the maximum level of activity but their relative difference remained unchanged. For ERP analysis we decided to select an arbitrary range of 100 trials between trials #128 and #228 for further av-eraging. This means that ERPs were analyzed across a grand average of 8400 trials (= 21 × 2 × 2 × 100).
Let us consider XIS I, the signal recorded during the ISI
pe-riods, and X1,X2, . . . ,Xn the points of XIS I. Let us define
MADIS I as the median of the absolute deviations from the
data’s median (Hoaglin et al., 2000). The value of MADIS I, the
median absolute deviation amplitude during ISI, is calculated
as MADIS I = mediani
i=1,n
(|medianj(Xj)
j=1,n
−Xi|) . We can express
the strength of the response (S R) as the ratio between the me-dian amplitude of ERP during the stimulus presentation and the
corresponding MADIS I. For Layer 1 modules S R was equal to
7.58, 7.18, 7.68 and 7.65 for the FF, FB, FFH and FBH circuits, respectively. The values of S R for each circuit and for each layer pair were calculated with 95% confidence intervals (Ta-ble 2). These data show that in Layer 1 a moderate increase in
S Rby 3-7% observed in the presence of horizontal projections
was not significant. For Layer 2 modules S R was significantly lower than the values found in Layer 1 (Table 2, Fig. 4). The presence of horizontal links decreased S R in Layer 2 by 10-20%. The presence of feedback projections, irrespective of the horizontal links, also reduced S R in Layer 2 response by a sim-ilar proportion. In Layer 2 these effects were cumulative and
S RF BH was reduced by 30% compared to S RFF.
3.2. During the stimulation
Figure 4 shows the ERPs for each topology and each layer of the circuit. At the onset of the stimulus the amplitude of ERPs increased for Layer 1 modules, irrespective of the circuit graph. The horizontal projections emphasized the inhibitory offset response: in Layer 1 the duration of the offset inhibition
Table 2: S R confidence interval calculated according to the smoothed percentile bootstrap methodology (Efron, 1979).
Layer Circuit S R 95% confidence lower higher L1 FB 7.180 6.020 8.938 FBH 7.645 6.532 8.904 FF 7.580 6.626 9.060 FFH 7.678 6.516 9.111 L2 FB 2.011 1.510 2.581 FBH 1.837 1.381 2.187 FF 2.661 1.972 3.278 FFH 2.054 1.592 2.504 4
FB.L1 FF.L1 FBH.L1 FFH.L1 0 200 400 600 800 1000 1200 lag [ms] 2 µV FB.L2 FF.L2 FBH.L2 FFH.L2 stimulus γ γ
Figure 4: ERPs averaged across 21 virtual subjects, 8400 trials overall, trig-gered by stimulus onset (at lag 0). The dotted lines at 0 and 500 m correspond to the onset and offset of the stimulus. A Blackman-Tukey curve smoothing with a window of 20 ms was applied to eliminate high frequency components (Blackman and Tukey, 1959). The labels refer to the circuit and to the order of the layer. Black curves refer to ERPs recorded in FB and FBH circuits. Gray curves refer to ERPs recorded in FF and FFH circuits. Notice the burst of γ-oscillations after stimulus onset in FB.L1 and FBH.L1.
was prolonged by approximately 40 ms; in Layer 2 the offset inhibition was sharper.
Trials #128 to #228 were used for the computation of the power spectrum (PSD) (Fig. 5) and we averaged the trial-by-trial PSDs. In any circuit, PSD power in Layer 1 was larger than in Layer 2 for all frequencies (Fig. 5a,d). This difference is due to the direct input from the sensory module to Layer 1. We have assessed the effect of introducing feedback projections in the circuits by computing the difference between the PSDs with and without feedback projections (FB and FBH vs. FF and FFH, respectively). For each bin of the power difference curves we calculated the 95% confidence interval based on the distri-bution of the trial-by-trial difference in PSDs. We consider here the frequency bands α, β and γ in the ranges [5-20[, [20-40[, and [40-100] Hz, respectively. The shifts in the range limits of the frequency bands towards higher frequencies are determined by the smallness of the network size of a module with respect to a realistic brain area (data not shown from our study and
beim Graben and Kurths, 2008). The power of PS DF B.L1and
PS DF BH.L1 was larger due to the presence of the feedback, as
shown by the curves of the power differences that tended to stay above the zero line (Fig. 5b,e). In particular we observed two significant peaks in the differential curves of Layer 1 of either circuit. In the presence of additional horizontal links both sig-nificant peaks were in the γ-range tended to stay above the zero line (Fig. 5e). Notice that a burst of γ-oscillations appeared im-mediately after the stimulus onset in the presence of feedback projections (Fig. 4). LAYER 1 0 20 40 60 80 100 Frequency [Hz] 10-4 10-2 0 102 104 LAYER 2 0 20 40 60 80 100 Frequency [Hz] 10-4 10-2 0 102 104
b
Po w e r d if fe re n ce [µ V 2/H z]c
Po w e r [µ V 2/H z] Po w e r d if fe re n ce [µ V 2/H z]a
0 20 40 60 80 100 Frequency [Hz] LAYER 2 10-4 10-2 0 102 104 DURING STIMULATION LAYER 1 0 20 40 60 80 100 Frequency [Hz] 10-4 10-2 0 102 104 FB FF LAYER 1 LAYER 2 α β γ * * * * * * * * * *d
e
f
α β γ α β γ α β γ 20 40 60 80 100 0 Frequency [Hz] 10-4 10-2 1 102 104 LAYER 1 LAYER 2 FBH FFH 20 40 60 80 100 0 Frequency [Hz] 10-4 10-2 1 102 104Figure 5: Averaged Power Spectrum Densities during the stimulus presenta-tion in Layer 1 and Layer 2 of FB, FF circuits (panel a) and circuits with horizontal links, FBH and FFH (panel d). Black curves refer to circuits with feedback projections and gray lines to feed-forward circuits. The difference PS DF B−PS DFFwith the 95% two-tailed confidence intervals (limits of the
shaded area) for Layer 1 and Layer 2 is plotted in panels b,c, respectively. The difference PS DF BH−PS DFFHfor Layer 1 and Layer 2 is plotted in panels
e,f, respectively. The analysis is performed with a resolution of 2 Hz. The asterisks are used to label the significant peaks of the differential curves. We consider here the frequency bands α, β and γ in the ranges [5-20[, [20-40[, and [40-100] Hz, respectively.
It is noticeable that in Layer 2 the horizontal links increased even further the overall power of PSD and particularly the γ-oscillations (Fig. 5f). On the opposite, in the absence of
horizontal links, PS DF B.L2 was characterized by a power that
tended to be smaller than PS DFF.L2, in particular in the γ-range
(Fig. 5c). Then, PSD analysis showed that Layer 2 activity dur-ing the stimulation was very much affected by the circuit con-nectivity.
Figure 6 shows the dynamics of the ERPs on a trial-by-trial average with 84 traces averaged for each trial. For Layer 1, the comparison of Fig. 6a and Fig. 6c shows that the presence of horizontal connections is not only making the onset excitation and the offset inhibition sharper but it greatly reduced the inter-trial variability. It is interesting to notice that before inter-trial#128 inhibitory onset responses appeared transiently in Layer 2 with any kind of connectivity among the modules (Fig. 6b,d). This pattern occurred briefly again near trial#180 only in the FB cir-cuit (Fig. 6b, left panel).
3.3. During the Inter-Stimulus Interval
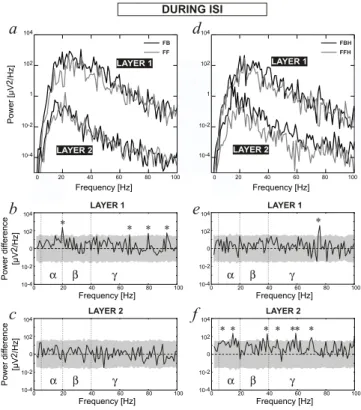
During the ISI, Layer 1 was characterized by a power larger than Layer 2 at all frequencies (Fig. 7a,d), in a way similar to
0 500 1000 lag [ms] 0 500 1000 lag [ms] 0 500 1000 T ri a l # 0 500 1000 +15 +10 -10 -15 +18 +12 -12 -18 0 500 1000 lag [ms] 0 500 1000 lag [ms] 70 228 128 250 70 228 128 250 70 228 128 250 70 228 128 250 0 500 1000 0 500 1000 FBH circuit FFH circuit T ri a l # FB circuit FF circuit L A YER 1 L A YER 2
a
b
c
d
70 228 128 250 70 228 128 250 70 228 128 250 70 228 128 250Figure 6: Trial-by-trial dynamics of the ERPs in Layer 1 (panels a,c) and Layer 2 (panels b,d) of circuits with feedback projections (left column) and in presence of horizontal projections (panels c,d). The amplitude of the ERPs is scaled in µV and color-coded following the colors on the right scale. The dotted lines at trials #128 and #228 indicate the range that was used to calculate the grand averaging.
what was observed during the stimulation. In Layer 1 the pres-ence of feedback projections in the circuit tended to increase the number of significant peaks in the γ-range, (Fig. 7b,e) espe-cially in the absence of horizontal links (Fig. 7b). It is interest-ing to notice that the PSD in FB.L2 and FF.L2 were very simi-lar (Fig. 7a,c). On the opposite, the presence of both horizontal and feedback connections increased the power of FBH.L2 vs. FFH.L2 throughout the frequency range (Fig. 7d), in particular in the γ-range (Fig. 7f).
3.4. Cross-Layer Time/Frequency Analysis
The assessment of the correlation between EChGs from Layer 1 and Layer 2 in the frequency and in the time domains on a trial-by-trial basis was performed by the cross-coherence analysis between trials #128 and #228. The cross-coherence
XCOHA,B( f , t) between two channels, A and B, at the given
frequency f in the time-window centered on t is calculated ac-cording to the equation
XCOHA,B( f , t) = 1 n n X k=1 FkA( f , t)FkB( f , t)∗ |FAk( f , t)FkB( f , t)| ,
where FkA( f , t) and FkB( f , t) are short-time Discrete Fourier
Transforms of signals A and B, and FkB( f , t)∗ is the complex
conjugate of FkB( f , t) (Delorme and Makeig, 2004). The value
of the cross-coherence varies between 0 meaning a complete absence of synchronization and 1 meaning perfect synchroniza-tion.
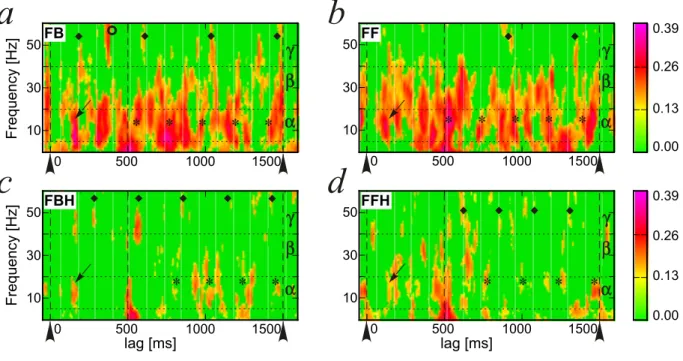
The cross-layer coherence for each circuit type is illustrated in Fig. 8. The significance of the coherence values was assessed by bootstrap statistics (Delorme and Makeig, 2004) such that non-significant values (2p < 5%) were zeroed for the sake of the colored drawing of the map of Fig. 8. We use the same α, β, and γ frequency bands defined above. The presence of the horizontal links decreased the vast majority of the cross-layer coherence throughout the frequency spectrum (Fig. 8a,b
vs. Fig. 8c,d). Notice the strong cross-layer coherence for all
b
Po w e r d if fe re n ce [µ V 2/H z]c
Po w e r [µ V 2/H z] LAYER 1 LAYER 2 FB FF Po w e r d if fe re n ce [µ V 2/H z]a
LAYER 1 0 20 40 60 80 100 Frequency [Hz] 10-4 10-2 0 102 104 0 20 40 60 80 100 Frequency [Hz] LAYER 2 10-4 10-2 0 102 104 DURING ISI * * * LAYER 1 0 20 40 60 80 100 Frequency [Hz] 10-4 10-2 0 102 104 * * * 0 20 40 60 80 100 Frequency [Hz] LAYER 2 10-4 10-2 0 102 104 LAYER 1 LAYER 2 FBH FFH 20 40 60 80 100 0 Frequency [Hz] 10-4 10-2 1 102 104 * * ** * *e
f
d
α β γ α β γ α β γ α β γ 20 40 60 80 100 0 Frequency [Hz] 10-4 10-2 1 102 104Figure 7: Averaged Power Spectrum Densities during ISI in Layer 1 and Layer 2 of FB, FF circuits (left panels) and circuits with horizontal links, FBH and FFH (right panels). The analysis is performed with a resolution of 1 Hz. We consider here the frequency bands α, β and γ in the ranges [5-20[, [20-40[, and [40-100] Hz, respectively. The labels are the same as in Figure 5.
circuits at very low frequencies right at the stimulus offset (lag = 500 ms) due to the offset inhibition visible also in the ERPs (Fig. 4).
During the stimulus presentation the cross-layer coherence was strong in the α-band at ∼150 ms after the stimulus onset in all circuits (Fig. 8, small arrows). The presence of the feedback 6
0.00 0.13 0.26 0.39 0.00 0.13 0.26 0.39 ◆ ◆ ◆ ◆ ◆ lag [ms] 500 1000 1500 0 30 50FBH F re q u e n cy [H z] 10
α
β
γ
✽ ✽ ✽ 500 1000 1500 0 30 50FF 10α
β
γ
✽ ✽ ✽ ✽ ✽ ✽ ✽ ✽ 500 1000 1500 0 30 50FB F re q u e n cy [H z]a
b
lag [ms] 500 1000 1500 0 30 50FFHc
d
α
β
γ
10 10α
β
γ
✽ ✽ ✽ ✽ ✽ ✽ ✽ ◆ ◆ ◆ ◆ ◆ ◆ ◆ ◆ ◆ ◆Figure 8: Cross-coherence maps between the Layer 1 and the Layer 2 of all circuits calculated between trials #128 and #228. The value of cross-coherence is color-coded according to the scale on the right, ranging between 0 and 0.39. Non-significant values are zeroed. The map is calculated using discrete Fourier Transform with a resolution of 1/16 Hz in frequency and 6.25 ms in time. The horizontal dotted lines correspond to frequency band boundaries. The big arrows indicate the stimulus onset and the vertical dashed lines at 500 and 1500 ms indicate the Inter-Stimulus Interval. A digital infinite impulse response filter for [1 − 55 Hz] bandpass was applied before signal processing in order to reduce high frequency noise. Notice that during ISI peaks of cross-coherence tended to appear at regular intervals in the α-band, marked by the asterisks, and in the γ-band, marked by black diamonds. The small arrows indicate cross-layer coherence at ∼150 ms in all circuits.
projections decreased the cross-layer coherence in the β-band (Fig. 8a,c vs. Fig. 8b,d). A very strong cross-layer coherence appeared ∼400 ms after the stimulus onset in the γ-band of FB circuits (Fig. 8a, empty circle).
During ISI we observed several interesting significant val-ues of cross-layer coherence that emphasizes the effect of inter-modules connectivity on the pattern of activity of the entire cir-cuit. The strongest cross-layer coherence in the β-band was
observed for the pure feed-forward circuit (Fig. 8b). Both
circuits without horizontal links were characterized by strong cross-layer coherence in the α-band. More interestingly the significant peaks tended to appear at regular intervals in the α-band (marked by the asterisks in Fig 8) of ∼220 ms in FB, and ∼220 ms in FF. Despite a much lesser degree of cross-layer coherence produced by the presence of the horizontal links this rhythmic pattern was also observed in FBH and FFH with inter-vals of ∼220 ms and ∼230 ms, respectively. This suggests the presence of a slow rhythm (∼4.4 Hz) across the whole circuit independent of backward and horizontal projections.
During ISI the activity of the two layers was coherently cor-related at regular intervals also in the γ-band (see the black diamond symbols in Fig. 8). In the absence of the horizontal links (Fig. 8a,b) the rhythm was 2.3 Hz for both FB and FF cir-cuits. On the opposite, in the presence of the horizontal links the rhythm of the peaks in the γ-band for FBH and FFH was a bit faster, 3.5 and 4.3 Hz, respectively. We observe that in the presence of feedback projections (FB and FBH) the first peak of these rhythms tended to appear before the stimulus offset
(Fig. 8a,c). 4. Discussion
This paper studies the information processing in hierarchi-cally organized neural circuits by means of an evolutionary neural system simulator (Shaposhnyk et al., 2009). The en-coding of connectivity properties in the ‘genome’ of the circuit allowed us to produce many different virtual subjects and study the common features of information processing shared by the whole sample of individuals. We have analyzed the activity of four basic circuits characterized by a sensory module receiv-ing an external input carryreceiv-ing spatio-temporal information that projects to two hierarchically organized multilayered (in our case formed by two layers) streams of network modules char-acterized by optional recurrent (feedback) projections from the downstream to the upstream modules and optional intra-layer projections. Each network module undergoes a maturation pro-cess followed by an active unsupervised learning propro-cess de-termined by spike-timing-dependent plasticity rules meant to maintain active learning dynamics. These processes are simu-lated at the cellular level and the network activity is recorded by virtual electrodes located in each module. The recorded EChG signals are analyzed as ERPs triggered by the stimulus onset and by power density and cross-coherence analyses.
This is the first study that reports simulated EEG-like sig-nals generated by large sample of evolvable networks of leaky integrate-and-fire neurons. Previous simulation studies of EEG
were based on population dynamics and neural masses (Free-man, 2005; Harrison et al., 2005; Cosandier-Rim´el´e et al., 2010; Babajani-Feremi and Soltanian-Zadeh, 2010; Goodfellow et al., 2011). These studies were generally aimed at determining the stability of network dynamics, the effect of noise and the emer-gence of synchronous activity in relation to epileptogenesis.
Our goal is limited to a computational study that partially re-produces the signals observed in biological experimental con-ditions. Though it represents an oversimplified approach to the complexity of real brain networks it offers the possibility to ad-dress issues raised by biological experiments such as the effect of inter-areal connectivity with the network activity. Experi-mental observation of synchronization of neural oscillations has been reported in association with the key process of binding of information processed in distributed brain regions (Singer, 1993; Womelsdorf et al., 2007). This information processing depends on the coupling between the thalamus and the cere-bral cortex. The thalamocortical circuit is characterized by a complex pattern of feed-forward, feedback and inter-areal con-nections that are likely to be associated with its performance in feature selection (Villa and Tetko, 1995, 1997). The activity of this circuit is also characterized by several oscillatory patterns (Bal and McCormick, 1996; Contreras et al., 1996; Bazhenov et al., 2002; Timofeev I, 2005) that are associated with the EEG rhythms. Zero-lag synchronization between spatially separated cortical areas may represent a critical aspect of the binding pro-cess (Roelfsema et al., 1997) and has been investigated in rela-tion to the thalamocortical circuit (Gollo et al., 2010) and to cor-tical feedback activity (Villa et al., 1999; Sheeba et al., 2008).
We showed evidence that all network of modules are able to process and maintain patterns of activity associated with the stimulus after its offset for hundreds of milliseconds. This find-ing is in agreement with the occurrence of preferred sequences of spikes, which are dependent on the stimulus presentation but not triggered by it, recorded in the single module simulations (Iglesias and Villa, 2010). We have shown that the offset of the stimulus is also the most significant event that triggers coher-ent activity in the low frequency range throughout the network of any circuit studied here. It could be interpreted according to standing waves theory. Low frequencies suggest that infor-mation processing is transmitted at long distances, thus involv-ing large neural networks in processinvolv-ing stimulus-related activ-ity. This is also in agreement with recent experimental findings in human experiments that revealed specific low frequency co-herence patterns associated with processing type regardless of task contents and modality (Okuhata et al., 2009).
It is interesting to notice that the power spectrum density of the EChG recorded during the inter stimulus interval showed more energy in the γ-band for Layer 2 of the FBH circuit than in the same Layer of the other circuits. The FBH circuit, which is characterized by feedback and by horizontal projections, was also characterized by cross-layer coherence extending during ISI in the γ-frequency range. This result suggests that in the circuits with feedback projections the bursts of cross-layer co-herent γ-activity are likely to be triggered by some process that started during the stimulus presentation and that is not af-fected by stimulus offset. Such stimulus-evoked transient
asso-ciations between neural networks that are not necessarily time-locked to a stimulus onset may be considered with respect to the propagation of correlated waveforms and neuronal avalanches recorded in organotypic cultures of cortex (Thiagarajan et al., 2010). A network exhibiting multiple partially synchronized modes strongly excited by a stimulus, with a wide range of flex-ible, adaptable, and complex behavior, has been modeled as the variance of the connection gain increases, inhibitory connec-tions become more likely and global synchronization is shown to decrease (Gray and Robinson, 2009). This activity might be associated with a maintenance and control task integrated in the stimulus memorization process, as a form of working memory (Wolters and Raffone, 2008; Thiagarajan et al., 2010).
The effect of introducing connections between modules of the same layer provoked also an enhancement of the stimulus-locked onset excitation and offset inhibition in the ERPs of Layer 1, the layer receiving the input from the sensory mod-ule, irrespective of the feedback links. In Layer 2 the effect was more subtle and we could observe it better by the cross-coherence. The duration of evoked transients is likely to in-crease with the hierarchical depth of processing (David et al., 2005). However, we found late components after stimulus off-set in both FF and FB circuits, which raises the possibility of al-ternative hypotheses than the simple dependency on backward connections to reflect a reentry of dynamics to hierarchically lower processing areas (David et al., 2005). The discrepancy with those results may be due to the differences with their mod-eling because neural masses are unlike to realistically account for the diversity of activity patterns that can emerge within the networks of spiking neurons that belong to a neural module. It is important to remember that the coherence value indicates a linear statistical association between time-series in a given fre-quency band (Bullock et al., 1995). The absence of linear sta-tistical association between two processes does not mean the absence of any interaction. Higher-order frequency domain statistics like bicoherence and cross-bispectral analyses might be well suited to reveal interesting nonlinear interactions as sug-gested in a FBH-like network study (Perrig et al., 2010). The search for inter-module transient functional connectivity and its comparison with linear methods (Fingelkurts and Fingelkurts, 2010) is still limited by the understanding of the impact of dif-ferent methodological choices on the outcome of the analysis (Bassett and Bullmore, 2009).
In conclusion, we have provided evidence that studies of net-works of neural modules of spiking neurons can bring new in-sights to the understanding of neural generated signals like ERP and EEG. In the future we will extend our approach to larger networks of modules and nonlinear interactions will be inves-tigated as a function of the main parameters of inter-modules connectivity. Different types of neuronal models will also be tested in order to determine the robustness of the key observa-tions. It is also important to consider that our approach can be extended further to robotic applications where simple patterns of activity recorded by the EChG could be encoded into actua-tors.
References
Babajani-Feremi, A., Soltanian-Zadeh, H., 2010. Multi-area neural mass mod-eling of eeg and meg signals. Neuroimage 52, 793–811.
Bal, T., McCormick, D.A., 1996. What stops synchronized thalamocortical oscillations? Neuron 17, 297–308.
Bassett, D.S., Bullmore, E.T., 2009. Human brain networks in health and dis-ease. Curr Opin Neurol 22, 340–347.
Bazhenov, M., Timofeev, I., Steriade, M., Sejnowski, T.J., 2002. Model of tha-lamocortical slow-wave sleep oscillations and transitions to activated states. J Neurosci 22, 8691–8704.
Blackman, R.B., Tukey, J.W., 1959. The measurement of power spectra: From the Point of View of Communications Engineering. 190 pp., Dover Publica-tions Inc., New York, N.Y., USA.
Breakspear, M., Stam, C.J., 2005. Dynamics of a neural system with a multi-scale architecture. Philos Trans R Soc Lond B Biol Sci 360, 1051–1074. Bullock, T., McClune, M., Achimowicz, J., Iragui-Madoz, V.J., Duckrow, R.B.,
Spencer, S.S., 1995. EEG coherence has structure in the millimeter domain. Contreras, D., Destexhe, A., Sejnowski, T.J., Steriade, M., 1996. Control of spatiotemporal coherence of a thalamic oscillation by corticothalamic feed-back. Science 274, 771–774.
Cosandier-Rim´el´e, D., Merlet, I., Bartolomei, F., Badier, J.M., Wendling, F., 2010. Computational modeling of epileptic activity: from cortical sources to EEG signals. J Clin Neurophysiol 27, 465–470.
David, O., Harrison, L., Friston, K.J., 2005. Modelling event-related responses in the brain. Neuroimage 25, 756–770.
Deco, G., Jirsa, V.K., Robinson, P.A., Breakspear, M., Friston, K., 2008. The dynamic brain: from spiking neurons to neural masses and cortical fields. PLoS Comput Biol 4.
Delorme, A., Makeig, S., 2004. EEGLAB: an open source toolbox for analysis of single-trial EEG dynamics including independent component analysis. J Neurosci Meth 134, 9–21.
Drover, J.D., Schiff, N.D., Victor, J.D., 2010. Dynamics of coupled thalamo-cortical modules. J Comput Neurosci 28, 605–616.
Efron, B., 1979. Bootstrap methods: Another look at the jackknife. The Annals of Statistics 7, pp. 1–26.
Fingelkurts, A.A., Fingelkurts, A.A., 2010. Short-term EEG spectral pattern as a single event in EEG phenomenology. Open Neuroimag J 4, 130–156. Freeman, W.J., 1975. Mass Action in the Nervous System. Academic Press,
New York, NY, USA.
Freeman, W.J., 2005. A field-theoretic approach to understanding scale-free neocortical dynamics. Biol Cybern 92, 350–359.
Gollo, L.L., Mirasso, C., Villa, A.E., 2010. Dynamic control for synchroniza-tion of separated cortical areas through thalamic relay. Neuroimage 52, 947– 955.
Goodfellow, M., Schindler, K., Baier, G., 2011. Intermittent spike-wave dy-namics in a heterogeneous, spatially extended neural mass model. Neu-roimage 55, 920–932.
beim Graben, P., Kurths, J., 2008. Simulating global properties of electroen-cephalograms with minimal random neural networks. Neurocomputing 71, 999 – 1007.
Gray, R.T., Robinson, P.A., 2009. Stability and structural constraints of random brain networks with excitatory and inhibitory neural populations. J Comput Neurosci 27, 81–101.
Harrison, L.M., David, O., Friston, K.J., 2005. Stochastic models of neuronal dynamics. Philos Trans R Soc Lond B Biol Sci 360, 1075–1091.
Hill, S., Villa, A.E., 1997. Dynamic transitions in global network activity influ-enced by the balance of excitation and inhibtion. Network: computational neural networks 8, 165–184.
Hoaglin, D.C., Mosteller, F., Tukey, J.W. (Eds.), 2000. Understanding robust and exploratory data analysis. Wiley Classics Library, Wiley-Interscience, New York. Revised and updated reprint of the 1983 original.
Hutchins, J.B., Barger, S.W., 1998. Why neurons die: cell death in the nervous system. Anat Rec 253, 79–90.
Iglesias, J., Eriksson, J., Grize, F., Tomassini, M., Villa, A.E.P., 2005. Dynam-ics of pruning in simulated large-scale spiking neural networks. BioSystems 79, 11–20.
Iglesias, J., Villa, A.E.P., 2007. Effect of stimulus-driven pruning on the detec-tion of spatiotemporal patterns of activity in large neural networks. BioSys-tems 89, 287–293.
Iglesias, J., Villa, A.E.P., 2008. Emergence of preferred firing sequences in
large spiking neural networks during simulated neuronal development. Int J Neural Syst 18, 267–277.
Iglesias, J., Villa, A.E.P., 2010. Recurrent spatiotemporal firing patterns in large spiking neural networks with ontogenetic and epigenetic processes. J Physiol Paris 104, 137–146.
Innocenti, G.M., 1995. Exuberant development of connections, and its possible permissive role in cortical evolution. Trends in Neurosciences 18, 397–402. Knight, B.W., 2000. Dynamics of encoding in neuron populations: some
gen-eral mathematical features. Neural Comput 12, 473–518.
Langdon, W., 2010. 2-bit flip mutation elementary fitness landscapes, in: Auger, A., Shapiro, J.L., Whitley, L.D., Witt, C. (Eds.), Theory of Evolu-tionary Algorithms, Schloss Dagstuhl - Leibniz-Zentrum fuer Informatik, Germany, Dagstuhl, Germany. pp. 1–19.
Ly, C., Ermentrout, G.B., 2009. Synchronization dynamics of two coupled neural oscillators receiving shared and unshared noisy stimuli. J Comput Neurosci 26, 425–443.
Nunez, P.L., Srinivasan, R., 2006. Electric Fields of the Brain. Oxford Univer-sity Press, New York, NY, USA.
Okuhata, S.T., Okazaki, S., Maekawa, H., 2009. EEG coherence pattern during simultaneous and successive processing tasks. Int J Psychophysiol 72, 89– 96.
Perrig, S., Iglesias, J., Shaposhnyk, V., Chibirova, O., Dutoit, P., Cabessa, J., Espa-Cervena, K., Pelletier, L., Berger, F., Villa, A.E.P., 2010. Functional interactions in hierarchically organized neural networks studied with spa-tiotemporal firing patterns and phase-coupling frequencies. Chin J Physiol 53, 382–395.
Rakic, P., Bourgeois, J., Eckenhoff, M.F., Zecevic, N., Goldman-Rakic, P.S., 1986. Concurrent overproduction of synapses in diverse regions of the pri-mate cerebral cortex. Science 232, 232–235.
Rennie, C.J., Robinson, P.A., Wright, J.J., 2002. Unified neurophysical model of EEG spectra and evoked potentials. Biol Cybern 86, 457–471.
Roelfsema, P.R., Engel, A.K., K¨onig, P., Singer, W., 1997. Visuomotor integra-tion is associated with zero time-lag synchronizaintegra-tion among cortical areas. Nature 385, 157–161.
Shaposhnyk, V., Dutoit, P., Contreras-L´amus, V., Perrig, S., Villa, A., 2009. A framework for simulation and analysis of dynamically organized distributed neural networks. Lect Notes Comput Sci 5768, 277–286.
Sheeba, J.H., Stefanovska, A., McClintock, P.V., 2008. Neuronal synchrony during anesthesia: a thalamocortical model. Biophys J 95, 2722–2727. Singer, W., 1993. Synchronization of cortical activity and its putative role in
information processing and learning. Ann Rev Physiol 55, 349–374. Sotero, R.C., Trujillo-Barreto, N.J., Iturria-Medina, Y., Carbonell, F., Jimenez,
J.C., 2007. Realistically coupled neural mass models can generate EEG rhythms. Neural Comput 19, 478–512.
Thiagarajan, T.C., Lebedev, M.A., Nicolelis, M.A., Plenz, D., 2010. Coherence potentials: loss-less, all-or-none network events in the cortex. PLoS Biol 8. Timofeev I, B.M., 2005. Mechanisms and biological role of thalamocortical oscillations, in: Columbus, F. (Ed.), Trends in chronobiology research. Nova Science Publishers, Inc., pp. 1–47.
Ursino, M., Cona, F., Zavaglia, M., 2010. The generation of rhythms within a cortical region: analysis of a neural mass model. Neuroimage 52, 1080– 1094.
Villa, A.E.P., Tetko, I.V., 1995. Spatio-temporal patterns of activity controlled by system parameters in a simulated thalamo-cortical neural network, in: Hermann, H. (Ed.), Supercomputing in Brain Research: from tomography to neural networks, World Scientific Publishing, Singapour. pp. 379–388. Villa, A.E.P., Tetko, I.V., 1997. Efficient partition of learning data sets for
neural network training. Neural Netw 10, 1361–1374.
Villa, A.E.P., Tetko, I.V., Dutoit, P., De Ribaupierre, Y., De Ribaupierre, F., 1999. Corticofugal modulation of functional connectivity within the audi-tory thalamus of rat. J. Neurosci. Meth. 86, 161–178.
Wolters, G., Raffone, A., 2008. Coherence and recurrency: maintenance, con-trol and integration in working memory. Cogn Process 9, 1–17.
Womelsdorf, T., Schoffelen, J.M., Oostenveld, R., Singer, W., Desimone, R., Engel, A.K., Fries, P., 2007. Modulation of neuronal interactions through neuronal synchronization. Science 316, 1609–1612.
Wright, J.J., 1999. Simulation of EEG: dynamic changes in synaptic efficacy, cerebral rhythms, and dissipative and generative activity in cortex. Biol Cybern 81, 131–147.