HAL Id: hal-01616897
https://hal.archives-ouvertes.fr/hal-01616897
Submitted on 3 Apr 2020
HAL is a multi-disciplinary open access
archive for the deposit and dissemination of
sci-entific research documents, whether they are
pub-lished or not. The documents may come from
teaching and research institutions in France or
abroad, or from public or private research centers.
L’archive ouverte pluridisciplinaire HAL, est
destinée au dépôt et à la diffusion de documents
scientifiques de niveau recherche, publiés ou non,
émanant des établissements d’enseignement et de
recherche français ou étrangers, des laboratoires
publics ou privés.
Statistical and reliability analysis for mixed-mode
fracture tests applied to wood material
Rostand Moutou Pitti, Alaa Chateauneuf
To cite this version:
Rostand Moutou Pitti, Alaa Chateauneuf. Statistical and reliability analysis for mixed-mode fracture
tests applied to wood material. Wood Science and Technology, Springer Verlag, 2012, 46 (6),
pp.1099-1112. �10.1007/s00226-011-0462-7�. �hal-01616897�
Statistical and reliability analysis for mixed-mode
fracture tests applied to wood material
R. Moutou Pitti•A. Chateauneuf
Abstract The integrity of timber structures is mainly related to its capacity to resist crack propagation under various load conditions. However, this phenomenon is random by nature, and the need to incorporate statistical information is mandatory for practical use in structures. This paper aims at defining a probabilistic model in order to characterize the scatter of the toughness test results of timber. The instantaneous failure tests are performed using the mixed-mode crack growth specimen. The crack tip growth is recorded by a video camera for mixed-mode ratios of 15", 30" and 60", where the relative displacement of loading points is recorded by LVDT sensor. The experimental energy release rate is evaluated by the compliance method. As large scatter of the energy release rate is observed, the statistical analysis is performed by using the bootstrap simulation, in order to characterize the probabilistic models in the opening and shear crack modes. The reliability analysis is then performed in order to underline the impact of the statistical uncertainties on the rupture of wood material.
Introduction
The complexity of loading and material microstructure in mechanical and civil engineering often leads to random crack propagation combining the opening and the shear modes (Loidl et al. 2008). Nowadays, it remains necessary to increase the lifetime of timber structures, under sever and fluctuating environmental conditions. In timber structures, the heterogeneity and the orthotropic nature of the material
R. Moutou Pitti (&) ! A. Chateauneuf
Clermont Universite´, Universite´ Blaise Pascal, Institut Pascal, BP 10448, 63000 Clermont-Ferrand, France
e-mail: [email protected] R. Moutou Pitti! A. Chateauneuf
introduce more difficulties, especially when considering the viscoelastic properties (Moutou Pitti et al.2007), leading to a larger scatter of test results. It is therefore mandatory to characterize each mode of cracking in order to assess correctly the lifetime of the structure (Moutou Pitti et al.2010a).
In order to apply the statistical approaches, an experimental method separating the mixed-mode fracture mechanisms in wood is mandatory. Several technological solutions have been developed to provide the fracture parameters in wood material. Dubois et al. (2002) have proposed a DCB (double cantilever beam) specimen with variable moment of inertia to ensure stable crack growth in the opening mode. This geometry allows for the separation of fracture parameters and viscoelastic effects during creep tests. Previously, Valentin and Caumes (1989) have designed CTS (compact tension shear) specimen guaranteeing mixed-mode ratios in orthotropic media, such as wood. However, the drawback of this specimen consists in the instability of fracture as soon as the crack is initiated. By coupling with image analysis methods (Mekhtiev and Torgovnikov2004), Moutou Pitti et al. (2010b) have developed a solution combining the above advantages in order to evaluate the fracture energy under complex loadings for the mixed-mode ratios of 70" and 90". In the recent past (Tan et al.2010), literature review shows that several authors have applied reliability analysis to fracture mechanics on wood material and structures. Among others, Dominguez et al. (1999) have applied this approach to fatigue crack growth based on the effective stress intensity factor. Martinez and Calil (2003) have generalized this method to structural members of glued laminated timber, while Gonzalez Ballester et al. (2004) have applied it in image analysis techniques. The probabilistic assessment of safety parameters in timber structures has been carried out by Sousa et al. (2010). In wood plastic composites, Young et al. (2008) and Edwards et al. (2011) have considered the bootstrap confidence intervals for reliability analysis of structures.
In this paper, statistical and reliability analyses are carried out for mixed-mode crack growth process in wood structures. The separation of mixed-mode fracture can be performed either by M integral or by compliance methods. The proposed MMCG specimen, which is a compromise between DCB and CTS specimen, is considered. The testing procedure and the experimental device are described, and the energy release rates are obtained for the mixed-mode ratios of 15", 30" and 60". The characterization of the scatter of the energy release rate is carried out by using the bootstrap method. Finally, the reliability analysis is performed to underline the impact of test errors and material uncertainties on rupture of timber.
Mixed-mode fracture formulation Integral parameter
In order to separate the fracture modes during instantaneous crack growth in timber, Moutou Pitti et al. (2007) have proposed an adaption of the M integral initially developed by Chen and Shield (1977) as a curvilinear contour integral. As the finite element method provides higher precision for domain integration than for line
integration, the transformation of the initial curvilinear integration into a surface is performed using theh-method procedure suggested by Destuynder et al. (1983). The following expression is thus obtained:
Mh ¼1 2!
Z
X
rðuÞij ! vi;j% rðvÞij;k! ui
! "
! hk;jdX ð1Þ
whereh is a vector field continuously derivable and defined around the crack tip (Moutou Pitti et al. 2007); rij(u)
and rij(v)
indicate the real and virtual stresses, respectively; and u and v are real and virtual displacements, respectively. In this context, the mixed-mode separation is obtained by performing two distinct calcu-lations of real stress intensity factorsuKI anduKII (Moutou Pitti et al. 2007) for particular values of virtual stress intensity factorsvKIandvKII, such as:
uK I ¼ 8:Mh vK I¼ 1;vKII¼ 0 ð Þ C1 ; uKII¼ 8:Mh vK I ¼ 0;vKII¼ 1 ð Þ C2 ð2Þ
where C1and C2 denote the elastic compliances in opening and in shear modes, respectively. In this case, the two parts of the energy release rate, G1and G2, are given by (Moutou Pitti et al.2010a,b):
G ¼ G1þ G2 with G1¼ C1!ð u KIÞ2 8 and C2¼ C2! ðuKIIÞ2 8 ð3Þ Compliance method
The experimental evaluation of energy release rate can be performed by using the compliance method in imposed displacement configuration, as following (Moutou Pitti2008; Moutou Pitti et al.2010a):
GC1¼ F2 C 2! b! oC oa # $ d ð4Þ where FC is the critical load inducing a crack propagation length a, b is the spec-imen thickness, equal to 25 mm, and C is the compliance.
Experimental results
Wood specimen and Arcan fixture
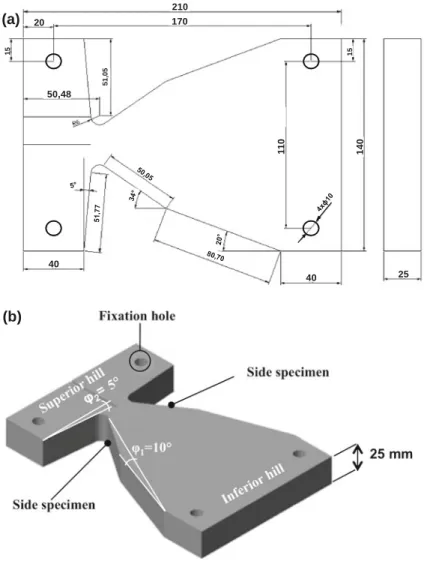
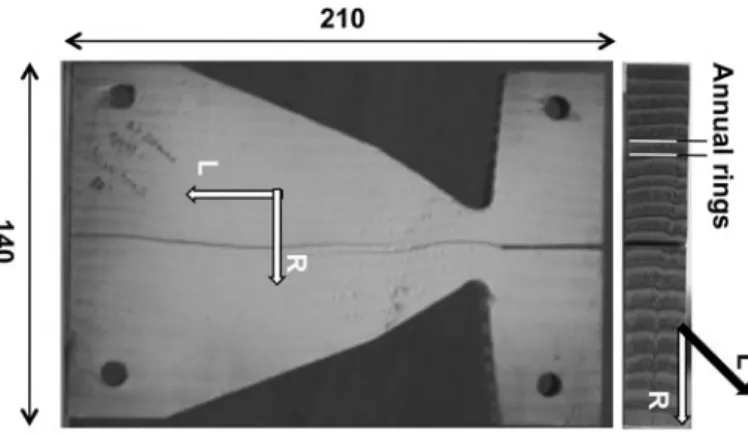
Figure1a shows the dimensions of the wood specimen, with an overall size 210 9 140 9 25 mm3. The side of the specimen has inclinations with angles of 5" and 10" from the edge and the inferior hill, respectively, as shown in Fig.1b. On both hills, four holes were perforated in order to fix the PVC Arcans. The distance d between the hole centers is 110 mm. The PVC Arcans, made of rigid plastic material, were performed to allow for mixed-mode configurations. The type of wood used in this test is Douglas fir (Pseudotsuga menziesii) and the orientation of the annual ring and the crack length are shown in Fig.2. Note that the width of the
annual ring varies between 3 and 5 mm and the crack is oriented following the (R/L) direction. An initial crack length is machined on the wood specimen in the direction of the fibers. The environmental conditions of the room tests, maintained constant during the whole test, are defined by a temperature of 22"C and a relative humidity of 33%. The wood specimens were kept under the same environmental conditions 15 days before fracture tests.
Experimental device
The MMCG specimen, shown in Fig.3, is defined by the combination of a modified DCB specimen (Dubois et al. 2002) and CTS specimen (Valentin and Caumes
(a) 210 170 50,48 40 40 25 20 140 15 15 51 ,05 11 0 (b)
1989), on the one hand, and the observation of stability range of energy release rate versus crack length computed numerically with Mh (Moutou Pitti et al.2010b), on the other hand. The main objective of this specimen is to allow for the decrease in the energy release rate during the tests.
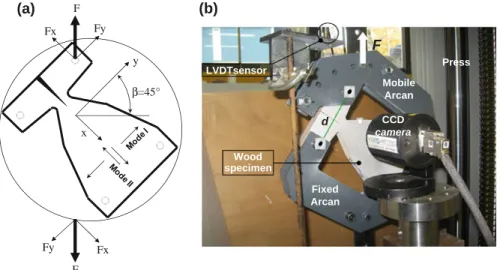
The wood specimen presented in Fig.2is fixed in a framed structure with Arc-formed handles containing symmetrical holes for load application according to various crack mode ratios b. The application of symmetric loads FI with angle b = 0" is equivalent to the opening mode, and the application of FII, with angle b = 90" corresponds to the shear mode. The mixed-mode fracture tests are obtained by applying the loads FIand FIIwith anglesb = 15", 30" and 60". The specimen is made of Douglas fir (Pseudotsuga menziesii) with longitudinal modulus of 15 GPa, transverse modulus of 0.6 GPa and shear modulus of 0.7 GPa. An initial crack of 20 mm is machined in the wood specimen.
Fig. 2 Orientation of the annual rings and the crack length
I
F
IIF
I IIF
+ I IIF
+ IIF
IF
( =90°) ( =90°) ( =0°) ( =45°) ( =45°) Crack initiationThe MMCG specimen is loaded by a press, and the crack tip growth is recorded by a video camera placed on a tripod oriented in the slant axis of the specimen in order to separate, in the same time, the mixed-mode ratios, as shown in Fig.4. The force F is separated into two forces Fx and Fy corresponding to the axis orientations (x, y) and the mixed-mode ratio in plane configuration. The specimen is loaded in tension by the electromechanical press, and the displacements in opening and shear modes are obtained (Moutou Pitti2008). A white color is applied on the face of the specimen in order to observe clearly the crack tip growth by increasing the contrast (Fig.4).
Load–displacement curves
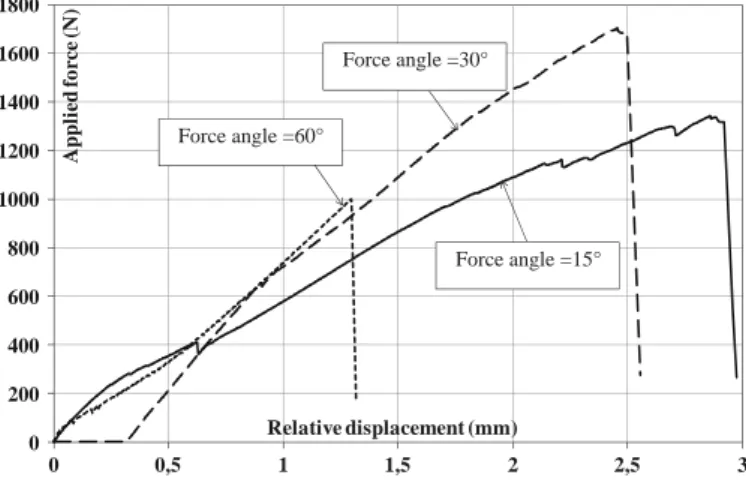
After precise synchronization of the experimental devices, the load–displacement curves are obtained and the crack length is plotted for different mixed-mode ratios: 15", 30" and 60" (Fig.5). Note that three fracture tests have been performed in each mixed-mode ratio, despite the limited number of the specimens remaining difficult to machine. However, due to the sudden brittle fracture, only one test with stable crack propagation is presented in this paper for each fracture mode. The crack length is evaluated by analysis of the recorded images. The synchronization of the test devices allows to detect the critical load FC corresponding to crack initiation and growth (this can be observed by small drops in the load–displacement curves). At the end of the test, the crack growth instability leads to specimen collapse. For mixed modes of 15", 30" and 60", the failure forces are FR= 1,350 N, FR= 1,700 N and FR= 1,000 N, respectively. Fy Fx F Fy Fx F β=45° x y F d CCD camera Mobile Arcan Fixed Arcan LVDTsensor Wood specimen Press (a) (b)
Energy release rate
According to the experimental load–displacement curves in Fig.5, the compliances are calculated by Eq.4. Then, by analyzing images given by optical methods, the critical energy release rate is obtained. Figure6 presents the parts of the energy release rate in opening and shear modes, respectively, versus the crack length, for the mixed-mode angles of 15", 30" and 60".
In parallel, the numerical elastic and orthotropic energy release rates are computed by the M integral (Eq.1) for the MMCG specimen. The elastic modulus, given by Guitard (1987), is introduced after corrections by comparing the numerical and the experimental displacements obtained in opening mode (Moutou Pitti2008). At the end, the numerical and experimental energy release rates are compared, and promising results are observed.
Statistical analysis
In this section, the statistical analysis is applied to experimental data in order to characterize the scatter in the energy release rate in terms of coefficient of variation and confidence intervals for the parameters.
Opening mode
Table1presents the six available test results for the energy release rate for opening mode G1. The point estimates of the statistical parameters are given in this table. The mean value is found to be 230.38 J/m2and the SD is 13.41 J/m2, corresponding to a coefficient of variation (COV) of 5.7%. Although the skewness (0.211) and the kurtosis (0.071) are far from those of normal distributions (0 and 3, respectively), the Lilliefors normality test shows that normal distribution cannot be rejected at 5%
0 200 400 600 800 1000 1200 1400 1600 1800 0 0,5 1 1,5 2 2,5 3 A ppl ie d fo rce (N ) Relative displacement (mm) Force angle =15° Force angle =30° Force angle =60°
confidence level. At the confidence level of 95%, the confidence interval (CI) for the mean estimate is given by the lower and upper bounds of 219.65 and 241.10 J/m2, respectively. In order to characterize the precision of the mean estimate, especially
0 50 100 150 200 250 300 40 45 50 55 60 65 Energ y rel ea se ra te G1 (J /m 2) Crack length (mm)
Energy release rate for crack opening
G1-15° G1-30° G1-60° (a) 0 2 4 6 8 10 12 14 16 40 45 50 55 60 65 E n er g y r el ea se r a te G 2 (J /m 2) Crack length (mm) Energy release rate for crack shear
G2-15° G2-30° G2-60° (b)
Fig. 6 Energy release rates: a opening part, b shear part
Table 1 Energy release rate for opening mode and statistical parameters Sample data (J/m2) 227.64–250.44–238.42–232.52–221.14–212.10 Mean (J/m2) 230.38 SD (J/m2) 13.41 Skewness 0.211 Kurtosis 0.071
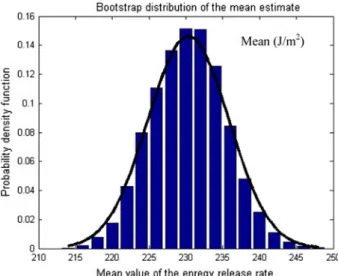
for low sample size (equal to 6 in the case here), two numerical methods were compared: the Jack-knife and the bootstrap methods. These two resampling methods are based on re-evaluating the statistic estimate by random sampling from the available data set; in this case, 10,000 samples were considered. The Jack-knife method consists of recomputing the statistic estimate, leaving out one or more observations at a time from the sample set (i.e., using subsets of available data). Meanwhile, the bootstrap method is based on random draw with replacement from the set of data points. Figure7 shows the distribution histogram of the mean according to the bootstrap method. The normal density is plotted as a continuous curve. Comparison between the bootstrap histogram and the normal pdf shows that the assumption of normal distribution is appropriate for the mean estimate with the parameters given in Table2.
In Table2, the point estimates, the SD and the 95% confidence intervals of the mean, obtained by the three methods: classical statistics, Jack-knife and bootstrap, are compared. It can be seen that although the number of specimens is low, the classical statistical method provides good results, while the bootstrap method gives the narrowest confidence interval. The bootstrap is shown to be less sensitive to data scatter under low number of specimens, which is in accordance with the state of the art.
Fig. 7 Bootstrap distribution of the mean estimate (10,000 samples)
Table 2 Point estimate, SD and 95% confidence interval for the mean (J/m2) Statistical method Point estimate SD Lower bound Upper bound Classical 230.34 5.47 219.65 241.10 Jack-knife 230.39 5.52 219.80 241.32 Bootstrap 230.35 5.02 221.11 240.67
Shear mode
Considering the shear mode toughness, the six test results are given in Table3. In this case, it can be seen that the values are more scattered than for the opening mode. The mean value is 6.56 J/m2and the SD is 2.90 J/m2, which corresponds to the COV of 45%. The 95% confidence interval for the mean estimate is given by the lower and upper bounds of 3.509 and 9.618 J/m2. In this case, the Lilliefors normality test rejects the null hypothesis (i.e., normality hypothesis) at the 5% significance level.
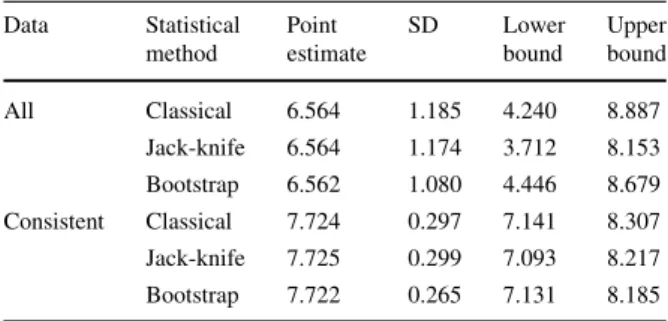
Table4 compares the three statistical results. It can be seen that the 95% confidence interval is very large for all three methods, where the bootstrap gives the narrowest CI varying from 4.446 to 8.679 J/m2. This large scatter is mainly due to the low value observed in the first point, i.e., 0.762 J/m2, which seems to be inconsistent when compared to the other tests. The inconsistency of this value can be explained by localized defects at the crack tip, which had not been detected before testing. In order to improve the mean estimate, the statistical analyses are performed only for consistent data by discarding the test point number 1, i.e., by considering tests from 2 to 6, leading to the results in Table4. In this case, the confidence interval becomes narrower (from 7.131 to 8.185 J/m2for bootstrap) and the coefficient of variation is reduced to 5.5%, which conforms to the value obtained for the opening mode.
Reliability analysis and statistical error
The reliability analysis consists of computing the failure probability under prescribed loading conditions (Lemaire et al. 2009). The failure condition is
Table 3 Scatter of the part of
the shear mode Sample data (J/m
2) 0.762–6.735–7.340–8.110–8.165–8.269
Mean (J/m2) 6.564 SD (J/m2) 2.904
Skewness -2.231 Kurtosis 5.113
Table 4 Comparison of various statistical results for full and consistent data Data Statistical method Point estimate SD Lower bound Upper bound All Classical 6.564 1.185 4.240 8.887 Jack-knife 6.564 1.174 3.712 8.153 Bootstrap 6.562 1.080 4.446 8.679 Consistent Classical 7.724 0.297 7.141 8.307 Jack-knife 7.725 0.299 7.093 8.217 Bootstrap 7.722 0.265 7.131 8.185
defined by the limit state function gðxiÞ separating the behavior space into two
regions: the safe domain, where gðxiÞ [ 0; and the failure domain where gðxiÞ ' 0:
In this case here, the analysis is carried out with respect to the crack propagation criterion given by gðG1c; G2c; G1A; G2AÞ ¼ 1 % G1A G1c% G2A G2c ð5Þ
where G1c and G2c are the critical energy release rates for modes 1 and 2, respectively, obtained by testing, and G1A and G2A are the applied energy release rates for these two cracking modes due to external loading. For this limit state function, the probability of failure is evaluated by integrating the joint density function over the failure domain:
Pr g½ ðG1c; G2c; G1A; G2AÞ ' 0) ¼
Z
g ' 0
f ðG1c; G2c; G1A; G2AÞ dG1cdG2cdG1AdG2A
ð6Þ where fðG1c; G2c; G1A; G2AÞ is the joint density function of the random variables; in
this function, it can be assumed that the strength variables, G1cand G2c, are inde-pendent of the loading variables, G1Aand G2A. The evaluation of the above integral can be performed by using the reliability methods indicated in Lemaire et al. (2009). In this case here, the first-order reliability method FORM is applied because of its efficiency and precision (Leonel et al.2010).
The reliability analysis aims at integrating the experimental data scatter in the assessment of structural integrity. The following analysis is performed in two steps: first, the design load is defined such that the failure probability is equal to the target of 10-4 and second, the data scatter is considered to evaluate the drop in the reliability level.
Reliability analysis in mixed mode
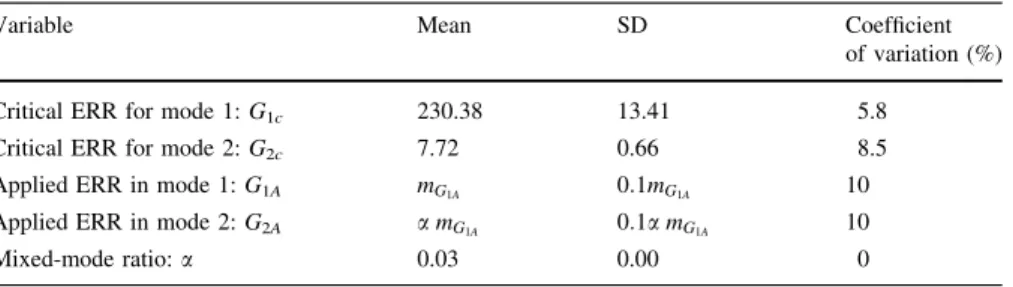
For the considered mixed-mode ratio, the strength parameters are defined by the statistical analysis performed in the above section, leading to the results in Table5. Loading is defined in terms of the mean applied energy release rate in mode 1 and the mixed-mode ratio, which corresponds to 15"; the coefficient of variation of
Table 5 Parameters of strength and loading variables
Variable Mean SD Coefficient of variation (%) Critical ERR for mode 1: G1c 230.38 13.41 5.8
Critical ERR for mode 2: G2c 7.72 0.66 8.5
Applied ERR in mode 1: G1A mG1A 0:1mG1A 10
Applied ERR in mode 2: G2A a mG1A 0:1a mG1A 10
loading is equal to 10%. In this case, the design parameter is the mean energy release rate mG1A.
For the target of 10-4, the reliability problem is solved and the design parameter is found to be mG1A ¼ 88:77 J/m
2, and the reliability results are shown in Table6.
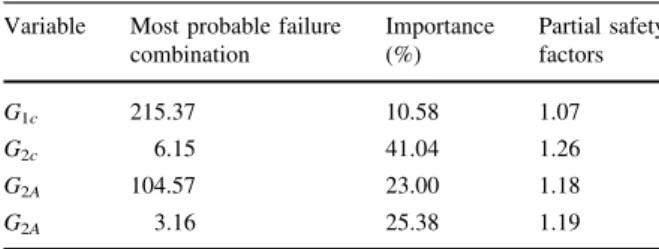
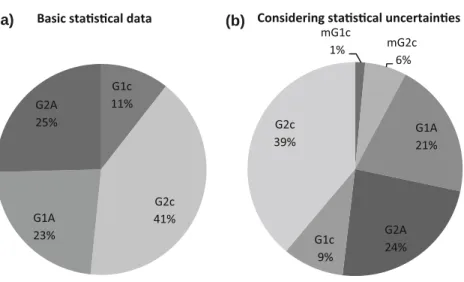
The most probable failure combination represents the occurrence of variables that is likely to lead to failure with a probability of 10-4. The variable importance (Fig.8a) provides the influence of uncertainties on the material reliability; it can be seen that the effect of the variable G1cis lower than that of the other variables, while G2cis the most important variable. This can be explained by the low coefficient of variation of G1cand by the sensitivity of G2cto the load variation. The partial safety factors give the values to be applied in order to ensure the prescribed reliability level. Naturally, the highest partial factor is associated with G2c.
Effect of statistical errors
Let us consider the statistical error induced by the low number of tests. The bootstrap method provides the uncertainties related to the estimate of the sample mean, as given in Tables2 and 4, leading to coefficients of variation of 2.2 and 3.4% for modes 1 and 2, respectively. In this case, the failure probability increases to 7.3 9 10-3when all data are considered and to 1.8 9 10-4when only consistent data are considered. Even for consistent data, the increase in the failure probability is 80% when the COV of the mean estimate is 3.4%. Figure8b shows the importance of the variables for consistent data, where the uncertainties related to the mean estimates are denoted mG1c and mG2c for modes 1 and 2, respectively. The statistical uncertainties in mode 2 (mG2c) show a non-negligible effect on the fracture probability.
Conclusion
The energy release rate in wood material has been evaluated by testing 2MCG specimen, where image analysis is combined with displacement measurements for different mixed-mode ratios. The scatter of the energy release rate in opening and shear modes was investigated, and the mean estimates were characterized by resampling methods, namely the Jack-knife and the bootstrap methods. The reliability analysis is applied for the design under safety target, as well as for the assessment of the effect of the uncertainties in the mean estimate. It was shown that
Table 6 Reliability results for
the design configuration Variable Most probable failure combination Importance (%) Partial safety factors G1c 215.37 10.58 1.07 G2c 6.15 41.04 1.26 G2A 104.57 23.00 1.18 G2A 3.16 25.38 1.19
although the coefficient of variation of the mean is relatively low, it has a significant effect on the increase in the failure probability. This increase is even very high when all test data are considered without removing the inconsistent information. It is therefore very important to consider not only the point estimates for design purpose but also the aleatoric uncertainties related to the variable as well as the epistemic uncertainties related to statistical parameters.
In the future, this work will be extended to take into account crack growth process under viscoelastic effects, which is often the case in wood structures. The main target is to develop a strategy giving at the same time the elastic properties of the material and the fracture parameters. The scatter of the test results should be considered in order to allow for better design rules through consideration of load and weather variations.
References
Chen FHK, Shield RT (1977) Conservation laws in elasticity of the J-integral type. J Appl Math Phys 28(1):1–22
Destuynder P, Djaoua M, Lescure S (1983) Some remarks on elastic fracture mechanics. J Appl Theor Mech 2(1):113–135
Dominguez J, Zapatero J, Moreno B (1999) Statistical model for fatigue crack growth under random loads including retardation effects. Eng Fract Mech 62(4):351–369
Dubois F, Chazal C, Petit C (2002) Viscoelastic crack growth process in wood timber, an approach by the finite element method for mode I fracture. Int J Fract 113(4):367–388
Edwards DJ, Guess FM, Timothy M, Young TM (2011) Improved estimation of the lower percentiles of material properties. Wood Sci Technol 45(3):533–546
Gonzalez Ballester MA, Pennec X, George Linguraru M, Ayache N (2004) Generalized image models and their application as statistical models of images. Med Image Anal 8(3):361–369
Guitard D (1987) Mechanics of composites and wood material, (in French) Ce´paudes Edition
(a) (b)
Fig. 8 Importance of the design variables: a without statistical uncertainties. b With statistical uncertainties
Lemaire M, Chateauneuf A, Mitteau J-C (2009) Structural reliability. Wiley. ISBN 978-1-84821-082-0 Leonel ED, Chateauneuf A, Venturini WS, Bressolette P (2010) Coupled reliability and boundary element model for probabilistic fatigue life assessment in mixed mode crack propagation. Int J Fatigue 32(11):1823–1834
Loidl D, Tschegg EK, Stanzl-Tschegg SE (2008) Fracturing of wood under superimposed tension and torsion. Wood Sci Technol 42(1):61–74
Martinez ME, Calil CJ (2003) Statistical design and orthogonal polynomial model to estimate the tensile fatigue strength of wooden finger joints. Int J Fatigue 25(3):237–243
Mekhtiev MA, Torgovnikov GI (2004) Method of check analysis of microwave-modified wood. Wood Sci Technol 38(7):507–519
Moutou Pitti R (2008) Mixed mode fracture separation in viscoelastic orthotropic materials: modelling and experimentation, PhD. Thesis, Limoges.http://www.unilim.fr/theses/2008/sciences/2008limo4025/ notice.htm
Moutou Pitti R, Dubois F, Sauvat N, Petit C (2007) Mixed mode fracture separation in viscoelastic orthotropic media: numerical and analytical approach by the Mhv-integral. Int J Fract 125(3): 181–193
Moutou Pitti R, Chateauneuf A, Dubois F (2010a) Statistical model for toughness in mixed mode crack propagation in timber structure. International Conference on Accelerated Life Testing. Reliability-based Analysis and Design, Clermont-Ferrand
Moutou Pitti R, Dubois F, Pop O (2010b) A proposed mixed-mode fracture specimen for wood under creep loadings. Int J Fract 167(2):195–209
Sousa HS, Lourenc¸o PB, Neves LC (2010) Safety evaluation of timber structures through probabilistic analysis. Adv Mater Res 133:337–342
Tan PL, Sharif S, Sudin I (2010) Roughness models for sanded wood surfaces. Wood Sci Technol. doi:
10.1007/s00226-010-0382-y
Valentin G, Caumes P (1989) Crack propagation in mixed mode in wood: a new specimen. Wood Sci Technol 23(1):43–53
Young TM, Perhac DG, Guess FM, Leon RV (2008) Bootstrap confidence intervals for percentiles of reliability data for wood plastic composites. For Prod J 58(11):106–114