HAL Id: hal-00295485
https://hal.archives-ouvertes.fr/hal-00295485
Submitted on 23 Aug 2004
HAL is a multi-disciplinary open access
archive for the deposit and dissemination of
sci-entific research documents, whether they are
pub-lished or not. The documents may come from
teaching and research institutions in France or
abroad, or from public or private research centers.
L’archive ouverte pluridisciplinaire HAL, est
destinée au dépôt et à la diffusion de documents
scientifiques de niveau recherche, publiés ou non,
émanant des établissements d’enseignement et de
recherche français ou étrangers, des laboratoires
publics ou privés.
Diurnal and annual variations of meteor rates at the
arctic circle
W. Singer, U. von Zahn, J. Weiß
To cite this version:
W. Singer, U. von Zahn, J. Weiß. Diurnal and annual variations of meteor rates at the arctic circle.
Atmospheric Chemistry and Physics, European Geosciences Union, 2004, 4 (5), pp.1355-1363.
�hal-00295485�
SRef-ID: 1680-7324/acp/2004-4-1355
Chemistry
and Physics
Diurnal and annual variations of meteor rates at the arctic circle
W. Singer, U. von Zahn, and J. WeißLeibniz-Institute of Atmospheric Physics, 18225 K¨uhlungsborn, Germany
Received: 15 October 2003 – Published in Atmos. Chem. Phys. Discuss.: 6 November 2003 Revised: 28 July 2004 – Accepted: 28 July 2004 – Published: 23 August 2004
Abstract. Meteors are an important source for (a) the metal
atoms of the upper atmosphere metal layers and (b) for con-densation nuclei, the existence of which are a prerequisite for the formation of noctilucent cloud particles in the polar mesopause region. For a better understanding of these phe-nomena, it would be helpful to know accurately the annual and diurnal variations of meteor rates. So far, these rates have been little studied at polar latitudes. Therefore we have used the 33 MHz meteor radar of the ALOMAR observatory at 69◦N to measure the meteor rates at this location for two full annual cycles. This site, being within 3◦ of the Arctic
circle, offers in addition an interesting capability: The axis of its antenna field points (almost) towards the North eclip-tic pole once each day of the year. In this pareclip-ticular viewing direction, the radar monitors the meteoroid influx from (al-most) the entire ecliptic Northern hemisphere.
We report on the observed diurnal variations (averaged over one month) of meteor rates and their significant alter-ations throughout the year. The ratio of maximum over min-imum meteor rates throughout one diurnal cycle is in Jan-uary and FebrJan-uary about 5, from April through December 2.3±0.3. If compared with similar measurements at mid-latitudes, our expectation, that the amplitude of the diurnal variation is to decrease towards the North pole, is not really borne out.
Observations with the antenna axis pointing towards the North ecliptic pole showed that the rate of deposition of me-teoric dust is substantially larger during the Arctic NLC sea-son than the annual mean deposition rate. The daylight me-teor showers of the Arietids, Zeta Perseids, and Beta Tau-rids supposedly contribute considerably to the June maxi-mum of meteor rates. We note, though, that with the radar antenna pointing as described above, all three meteor radi-ants are close to the local horizon but all three radiradi-ants were detected.
Correspondence to: W. Singer
(singer@iap-kborn.de)
1 Introduction
A meteoroid is a small particle travelling in interplanetary space. In the case that it enters the Earth’s upper atmosphere its interactions with the air molecules give rise to an extended trail of ionization (detectable by radars) and, if the meteoroid is large and fast enough, to a brief streak of light (the visible meteor). As common in the literature, we will apply the des-ignation ‘meteor’ in the following also to the radar-detected trail of ionization. The ablation of meteoroids during their high-speed entry into the Earth’s atmosphere is an important source for (a) the metal atoms of the upper atmosphere metal layers and (b) also for the formation of nanometer-sized con-densation nuclei (CN). The existence of these CNs is a pre-requisite for the subsequent formation of noctilucent cloud particles in the polar mesopause region. For a better un-derstanding of these phenomena, it is helpful to know ac-curately the annual and diurnal variations of meteor rates. These rates have been extensively studied at mid and low lat-itude, starting with the imposing work of Hawkins (1956) at Jodrell Bank (53◦N). Among his many results are the con-clusions that the space density of meteors along the length of the Earth’s orbit clearly peaks in June and that the radiants of the sporadic meteors are concentrated towards the plane of the ecliptic. In comparison, few studies have been pub-lished on meteor rates and their temporal variations at polar latitudes. Therefore we have integrated a 33 MHz SKiYMET all-sky meteor radar into the instrument cluster of the ALO-MAR observatory at 69◦N latitude and have measured the
radar meteor rates at this location for two full annual cycles. This site, being within 3◦of the Arctic circle, offers in
ad-dition an interesting capability: The axis of its antenna field points (almost) towards the North ecliptic pole (=NEP) once each day of the year. In this particular viewing direction, the radar monitors the meteoroid influx from (almost) the entire ecliptic Northern hemisphere. Hence, the radar is excellently suited to measure the spatial variations of that meteoroid in-flux, which originates in the ecliptic Northern hemisphere,
1356 W. Singer et al.: Meteor rates
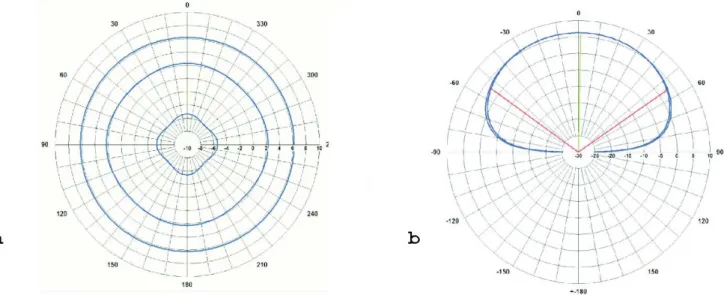
Fig. 1. Two-element crossed receive antenna of the SKiYMET radar. Panel (a): Horizontal radiation pattern with azimuthal cuts at 10◦, 60◦ and 80◦zenith angle; Panel (b): Vertical radiation pattern with zenithal cuts at 0◦and 45◦azimuth and a 3-dB beam width of 109◦(courtesy of Genesis Software).
along the path of the Earth about the Sun. Here we report on the observed diurnal variations (averaged over one month) of meteor rates and their significant alterations throughout the year
2 The radar instrument: its parameters and sites
This study was performed using a commercially produced SKiYMET all-sky interferometer meteor radar (Hocking et al., 2001). Its basic instrument parameters are:
frequency 32.55 MHz
peak power 12 kW
pulse width 13 µs pulse rep. frequency 2144 Hz
transmitting antenna 3-element crossed Yagi antenna receiving antenna 5-channel interferometer
of 2-element crossed Yagi antennas sampling resolution 0.94 ms
height range 78–120 km angular resolution 2◦
The radar antennas apply crossed antenna elements to en-sure a near uniform azimuthal sensitivity to meteor echoes as shown in Fig. 1a for the receiver antenna. The system uses a 5-antenna interferometer on reception, resulting in a range accuracy of 2 km and angular accuracy of 1 to 2◦in meteor location. The dependence of the receiver antenna gain on the elevation is shown in Fig. 1b. It is rather uniform for zenith angles less than, say, 60◦and tends towards zero for echoes close to the local horizon. We note that the system detects only meteor trails oriented perpendicular to the radial
direc-tion from the radar to the meteor trail. Still, the gain pattern implies a rather well behaved detection efficiency for mete-ors from all directions except for those entering close to the vertical.
Meteor entry velocities can be estimated from about 5% of the detections using the phase oscillations prior and after the peak in the signal amplitude and a radiant determination is possible on a statistical basis (for details see Hocking et al., 2001).
A theoretical estimate for the limiting meteor sensitivity of the radar is obtained using the minimum detectable power
Pnoise at the antenna determined from a sky noise map for
45 MHz at 69◦N (Campistron et al., 2001) after Eqs. (1) and (2), where k is Boltzman’s constant.
Pnoise =(TA+Tr)kB = {TA+T0(F −1)} (1)
TA=T32.55 MHz=T45 MHz(32.55/45)−2.5 (2) We use the bandwidth of the receiver, B=50 kHz, and correct also for the small additional receiver noise at
T0=290 K with its noise figure, F =4. Using a sky tem-perature TA=8000 K a value of Pnoise=1.3·10−14W results.
Only echoes about 10 dB above the cosmic noise floor will be detected, so the practical detection threshold power is
Pt h=1.3·10−13W. For a peak power Pt of 12 kW and a
ca-ble loss of about 1 dB, a radar frequency f , the speed of light
c, and an antenna directivity (D=5.4) at a minimum range R of 80 km, the minimum threshold power corresponds accord-ing to Eq. (3) to a minimum detectable electron line density of qlim=3.6·1012electrons/m (McKinley, 1961).
qlim= {(Pt hR3)/(2.5 · 10−32PtD2(c/f )3)}1/2 (3)
M =40 − 2.5 log qlim (4)
01-Jan-00 01-Jan-01 01-Jan-02 01-Jan-03 01-Jan-04 0 2000 4000 6000 8000 10000 12000 m et eor s/ day 54°N 69°N
Fig. 2. Annual variation of daily mean meteor count rates at
Julius-ruh (54◦N) and Andenes (69◦N) between November 1999 and April 2004.
This qlimcorresponds to a meteor of radio magnitude +8.6
using the relation between magnitude and electron line den-sity given by Eq. (4).
From November 1999 until August 2001, the radar was operated at our field station Juliusruh, Germany, with ge-ographic coordinates 54.6◦N, 13.4◦E. Thereafter the radar was moved to the ALOMAR observatory, Norway, with geographic coordinates 69.3◦N, 16.0◦E (von Zahn, 1997). There the radar is located 2.6◦N of the Arctic circle and is in continuous operation since the end of September 2001 (Singer et al., 2003).
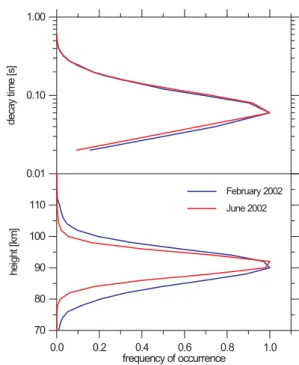
The daily meteor count rates are characterized by a strong annual variation (Fig. 2). The largest values are observed in summer (June) and the lowest count rates are detected in win-ter (February), both, at mid-latitudes as well as at Arctic lat-itudes. The Leonid shower of November 2002 is also clearly noticeable. Typical distributions of the meteor occurrence in dependence on height and on decay time are depicted in Fig. 3. The distributions are normalized to their peak val-ues. The meteor layer peaks at about 90 km in winter with a half width of about 19 km. In summer, the peak altitude is approximately 92 km and the layer is narrower with a half width of about 12 km.
For any site on the Arctic circle, the NEP passes through the zenith once a day. We show in Fig. 4 an idealized sketch of this viewing geometry. In this figure, the actual elevation pattern of Fig. 1b is idealized to a mushroom shape. We re-mind the reader, though, that the actual elevation pattern cuts out from detections those meteors which enter nearly verti-cally. Otherwise, meteoroids can be observed which enter in (almost) all directions from the ecliptic Northern hemi-sphere, none can be observed entering from the South eclip-tic hemisphere. Such geometry seems well suited to study the variation of meteoroid fluxes along the path of the Earth about the Sun. For this geometry to occur, the local time needs to be 06:00 LT, 24:00 LT, 18:00 LT, and 12:00 LT close to the spring equinox, the summer solstices, the autumn
0.0 0.2 0.4 0.6 0.8 1.0 frequency of occurrence 70 80 90 100 110 hei ght [k m ] 0.01 0.10 1.00 dec ay tim e [s ] February 2002 June 2002
Fig. 3. Monthly mean distributions of the meteor occurrence at
Andenes. The peak rates are 9271 meteors in February 2002 and 47 753 meteors in June 2002.
Fig. 4. Schematic of the viewing geometry of a SKiYMET radar
located on the Arctic circle. The mushroom-like feature at the radar site is to mimic the idealized elevation pattern of the instrument sensitivity. Meteor trails have to be at a right angle to this feature in order to be detectable by the radar.
1358 W. Singer et al.: Meteor rates
Fig. 5. Illustration of the radar capability to look towards the North
ecliptic pole once each day of the year.
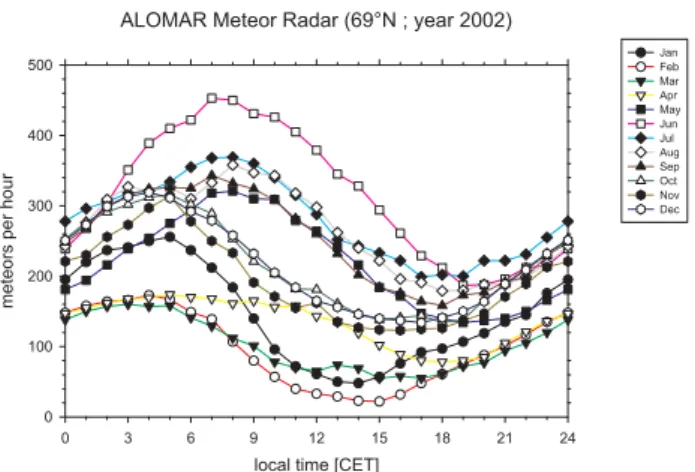
Fig. 6. Monthly means of the diurnal variations in meteor rates
throughout the year 2002.
equinox and the winter solstices, respectively (Fig. 5). We recognize that the ALOMAR site is located 2.6◦N of the Arctic circle. This offset is, however, only of the same size or smaller than the diameter of most meteor streams and there-fore we consider it unimportant for our following considera-tions.
3 Diurnal variations of meteor rates
We show in Fig. 6 monthly means of the meteor rates as ob-served at the ALOMAR site and as function of Central Eu-ropean Time (CET). The latter is only a few minutes differ-ent from the local solar time at the radar site. Total meteor count rates covering the height range 75 to 120 km were cal-culated from the raw data after removal of multiple detec-tions and counting ambiguous detecdetec-tions in range only once. Only unambiguous detections were allowed for meteors with altitude above 100 km. Furthermore, there was no attempt made to eliminate shower meteors from these statistics.
Un-Table 1. The ratio of maximum over minimum meteor rates throughout one diurnal cycle for the year 2002 (The *February value is a mean of 2002 and 2003).
Jan. Feb.* March April May June
5.6 5.1 2.8 2.3 2.5 2.5
July Aug. Sept. Oct. Nov. Dec.
2.0 2.0 2.2 2.4 2.6 2.4
der these rules, the instrument yields meteor rates in the order of 250±200 meteors per hour.
Absolute maximum and minimum meteor rates are reached near 07:00 LT in June and 15:00 LT in February, respectively, their ratio being about 20 (a day-by-day anal-ysis of February data shows that the absolute minimum of meteor rates is reached during the first week of February). The fact that the meteor count rate maximizes in June is of great significance for the aeronomy of noctilucent clouds. It very likely means that also the total meteoric mass flux max-imizes during June. The latter is assumed to be the dominant source for condensation nuclei (CN) in the altitude range 75 to 90 km. The existence of these CNs is a prerequisite for the formation of noctilucent cloud particles in the polar mesopause region (von Zahn and Berger, 2003).
The ratio of maximum over minimum meteor rates throughout one diurnal cycle is given in Table 1 for each month of the year 2002. In January and February this ratio is about 5, from April through December 2.3±0.3. If compared with similar measurements at mid-latitudes (e.g. Nakamura et al., 1991), our expectation, that the amplitude of the di-urnal variation is to decrease towards the North pole, is not really borne out.
In order to evaluate the reproducibility of the diurnal vari-ations, we show in Fig. 7 monthly mean variations of me-teor rates for June and February for both the years 2002 and 2003. According to Fig. 6, these are at our observation site the months with maximum and minimum total meteor rates, respectively. Very conspicuous are not only the large differ-ences in meteor rates between the two months, but also the variability of the local times at which the maximum and min-imum rates occur. If the diurnal variation would be driven solely by the orbital motion of the Earth about the Sun, the maxima and minima should occur at 06:00 and 18:00 LT, re-spectively. Actual deviations from this first-approximation values reach up to 5 h or 75◦of a full diurnal cycle. Clearly, higher order effects than just the orbital motion of the Earth contribute significantly to the shape of the diurnal variation curve.
0 4 8 12 16 20 24 local time [CET]
0 100 200 300 400 500 m et eor s per hour
ALOMAR Meteor Radar (69°N, year 2002 + 2003)
Feb Jun
2002 2003
Fig. 7. Monthly means of the diurnal variation in meteor rates for
February and June of the years 2002 and 2003.
4 Annual variation of observed meteors
4.1 Annual variation of diurnally averaged meteor rates Monthly means of the diurnal variations in meteor rates as observed by our ALOMAR meteor radar have been shown already in Fig. 6 and indicate a clear maximum of this rate during the month of June, the minimum in February. This general character of the observed annual variation can be rec-ognized also in Fig. 2, the presentation of our raw data.
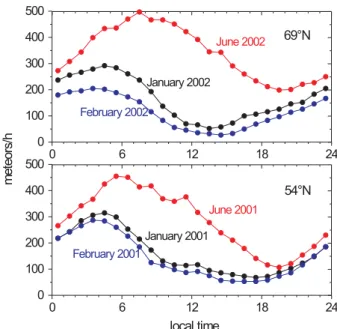
We compare in Fig. 8 the annual variation of meteor rates as observed at different Northern latitudes by our meteor radars at 69◦N (ALOMAR) and 54◦N (Juliusruh), respec-tively. The relative change from maximum to minimum rate has become somewhat smaller in going to a lower latitude, but no major difference is discernible. A strong June/July maximum and February minimum of meteor rates was found much earlier also by Hawkins (1956) with his radar located at 53◦N (Jodrell Bank) who summarizes his result as follows: “There is a dense complex of orbits in the region traversed by the Earth during the months May to August”. We note, though, that there exists a small difference in the local time at which the June maxima occur. For our 54◦N radar this
near 06:00 LT, for Hawkins’ 53◦N radar it is more in the
late morning hours. Any significance of this small difference remains to be studied.
4.2 Annual variation of observed meteors arriving from the ecliptic Northern hemisphere
As explained in Sect. 2, at our observation site the NEP passes close to the zenith once a day. The local times that this happens are e.g. 02:25, 00:23, and 22:25 LT for 15 May, 15 June, and 15 July, respectively. We can follow this coin-cidence throughout the year and Fig. 9 shows the number of meteors observed over a period of one hour, each centered
0 6 12 18 24 0 100 200 300 400 500 69°N 0 6 12 18 24 0 100 200 300 400 500 m et eor s/ h 54°N local time June 2002 January 2002 February 2002 June 2001 January 2001 February 2001
Fig. 8. Monthly means of the diurnal variation in meteor rates for
January, February, and June at mid-latitudes and Arctic latitudes.
0 30 60 90 120 150 180 210 240 270 300 330 360 day of year 50 100 150 200 250 300 350 m et eor s/ h 2002 2003 2004
Fig. 9. Annual variation of the meteor rate with the NEP close to
the zenith at the radar site. Plotted are the number of meteors for a 1 h period, centered on the local time of closest approach of the NEP to the zenith in the years 2002, 2003, and 2004.
on the local time of passage of the NEP close to the zenith. Even under this special viewing geometry, a strong annual variation of meteor rate is clearly present and with the maxi-mum rate occurring in June. This is one more proof that the total meteoric flux entering the Earth’s atmosphere from the North ecliptic hemisphere depends strongly on the position of the Earth along its orbit about the Sun, that is on ecliptic longitude.
To analyse the situation further, we will now study the al-titude distribution of the observed meteors. Figure 10 show the altitude distribution of all detected meteors during the one hour of “NEP-close-to-zenith” for the days of maximum
1360 W. Singer et al.: Meteor rates
0 20 40 60 80 100
meteors per hour 70 90 110 70 90 110 hei ght [k m ] 70 90 110 2002
ALOMAR Meteor Radar
8-June 00:21-01.21 UT
13-June 00:00-01:00 UT
29-June 23:00-24:00 UT
2003
Fig. 10. The altitude distribution of all detected meteors during
the one hour of “NEP-close-to-zenith” for the dates of maximum activity of the three June daylight showers (8 June – Arietids, 13 June – Zeta Perseids, 29 June – Beta Taurids). The meteor rates are shown separately for the years 2002 and 2003.
activity of the three June daylight showers. Black lines in-dicate the observations of 2002, the red ones those of 2003. The distribution peaks at 92 km in early June and at 88 km in late June. This may indicate a lessening influence of the fast, early-June Arietids on the gross distributions. The occur-rence peak of the Arietids was found by Browne et al. (1956) also near 92 km in their Jodrell Bank observations. Their occurrence distribution extends, however, to 110 km altitude at undoubtedly higher radiant altitudes than studied by us. The difference of meteor rates observed by the two radars at altitudes above 95 km could well be caused by a rapid de-crease of detection efficiency of our SKiYMET radar for me-teor trails at and above this altitude. We note, though, that trails of Leonid meteoroids have been clearly detected even above 110 km by our SKiYMET radar (Singer et al., 2000) which is probably helped greatly by the high entry velocity (and thus ionization efficiency) of these meteoroids. Hence, the loss of detection efficiency of our radar above 100 km is not necessarily a sharp cut-off.
The question has been raised whether all or part of the strong annual variation in meteor rates as shown here in Figs. 2 and 9 could be caused by annual variations of the atmospheric density or density scale height at meteor alti-tudes? This topic has been theoretically studied by e.g. El-lyett and Kennewall (1980) who conclude that such a
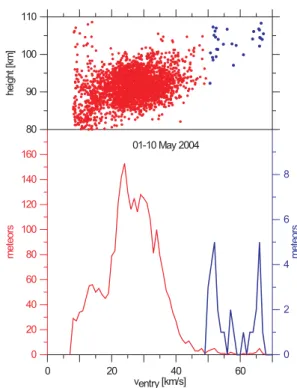
sug-0 20 40 60 80 100 120 140 160 m et eor s 0 20 40 60 ventry [km/s] 80 90 100 110 hei ght [k m ] 0 2 4 6 8 m et eor s 01-10 May 2004
Fig. 11. The height distribution of entry velocities and their
occur-rence observed at ALOMAR during the Eta Aquarid shower in May 2004. The blue line represents meteors with entry velocities greater than 50 km/s at an enhanced scale.
gestion is at least plausible. The location of our radar is unique in the sense that it observes a mesopause region which might well be called the best-investigated of all. This mesopause region above the Andya Rocket Range and ALO-MAR (69◦N, 16◦E) has been studied for decades using in-struments aboard sounding rockets and meteorological rock-ets as well as ground-based lidars, radars, and night glow spectrometers. We thus try to summarize some relevant re-sults of this work.
The meteor rates, observed by the ALOMAR meteor radar, maximize close to 90 km altitude (Fig. 10). It so happens that at this altitude, a minimal seasonal change of number density occurs. The ratio of number densities in (January–March) over those in (July+August), as obtained from rocket-borne ionization gages is 0.5, 1.0, and 1.8 at 80, 90, and 100 km altitude, respectively (Rapp et al., 2001). More generally speaking, if one takes the mean June density as reference, the densities from spring through autumn stay within the range of ±10%. In fact, the variations are so small that the error bars allow a density in spring which can be ei-ther smaller or larger than in June. According to our Fig. 9, the meteor rate varies, however, by a factor of almost 2 from late March/early April to June. This increase can clearly not be attributed to the seasonal density change at 90 km altitude. Can a change in density scale height Hn explain part or
all the change in meteor rate? In the altitude range 90 to 100 km, Hn is smallest in the period July+August, but it
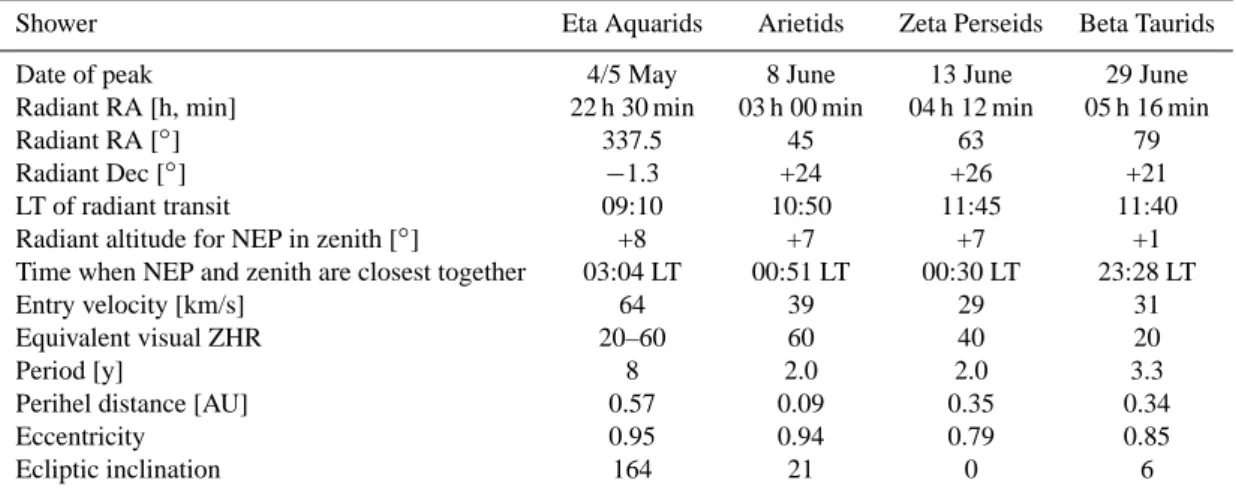
Table 2. Summer daylight showers (from literature).
Shower Eta Aquarids Arietids Zeta Perseids Beta Taurids
Date of peak 4/5 May 8 June 13 June 29 June
Radiant RA [h, min] 22 h 30 min 03 h 00 min 04 h 12 min 05 h 16 min
Radiant RA [◦] 337.5 45 63 79
Radiant Dec [◦] −1.3 +24 +26 +21
LT of radiant transit 09:10 10:50 11:45 11:40
Radiant altitude for NEP in zenith [◦] +8 +7 +7 +1
Time when NEP and zenith are closest together 03:04 LT 00:51 LT 00:30 LT 23:28 LT
Entry velocity [km/s] 64 39 29 31
Equivalent visual ZHR 20–60 60 40 20
Period [y] 8 2.0 2.0 3.3
Perihel distance [AU] 0.57 0.09 0.35 0.34
Eccentricity 0.95 0.94 0.79 0.85
Ecliptic inclination 164 21 0 6
is only a factor 1.34 larger in January–March period (Rapp et al., 2001). It seems unlikely that this factor can produce the observed factor-2-change in meteor rate. Furthermore, if large density scale heights lead automatically to small me-teor rates as argued by Ellyett and Kennewall (1980), then the rate should be smaller in September/October than January– March. This is not observed.
As the density scale height is a function of ambient tem-perature, we should check the available temperature informa-tion too: (a) In the L¨ubken (1999) temperature climatology, the 90 km temperature stays in the very narrow temperature range of 135±2 K from early June until 1 August, or in other words, it “bottoms out” for no less than 7 weeks. The same feature is found by M¨ullemann (2003), only 1 K higher. (b) In the Singer et al. (2004) climatology a similar, though not identical “bottom” of the 90 km temperature is notable. It ex-tends from about day-of-year (d.o.y.) 170 (19 June) to d.o.y. 220 (8 August). (c) In the Singer et al. (2004) climatology, a rapid rise of the 90 km-temperature happens from d.o.y. 220 (8 August) until d.o.y. 270 (27 September). In this relatively short period, the 90 km-temperature rises from about 135 K to 195 K. This scenario represents the disappearance of the low-level mesopause at the end of the polar summer. The earlier published data of (Singer et al., 2003) show the same two basic features of the 90 km-temperature with the temper-ature increase at the end of the polar summer concentrated into an even shorter transition period (late August until the end of September).
If one compares these features of the temperature varia-tions with those of the meteor rate (as shown in our Fig. 9), we conclude: The “bottoming-out” temperature feature in June/July can hardly be discerned in the meteor rate varia-tion. The maximum meteor rate about mid-June is sustained for only one month and is neighbored by lesser values on ei-ther side (May and July). Furei-thermore, the rapid September increase in 90 km-temperature (and hence scale height) is not
reflected in the observed meteor rates as shown in Fig. 6 for which the steepest decrease of meteor rate occurs about one month before the period of rapid temperature increase.
In summary, the observed properties of the mesopause above ALOMAR do not support a notion that a major part of the observed annual variation in meteor rate is caused by annual variations in the ambient atmosphere.
4.3 Summer daytime showers
Meteor radars have long identified a number of prominent meteor showers in summer. The strongest of the May/June period are listed with some of their properties in Table 2 (ra-diants from Kronk (2003); other parameters from McKinley (1961)). It is remarkable that all four are “daylight” showers in the sense that their radiant transits occur some times be-tween 09:00 and 12:00 LT. The Eta Aquarid shower in early May shows up clearly in our radar data despite low count rates, only 28 meteors with entry velocities above 50 km/s have been observed within 10 days (blue line and dots in Fig. 11). This enhanced visibility is most likely due to the high entry speed vat≈64 km/s of these shower meteoroids
which cause their electron line density q to be enhanced over that of slower meteors by about vat3.4(Bronshten, 1983). From both peaks of the velocity distribution for entry velocities greater than 50 km/s similar radiants could be determined (50–54 km/s: RA 22 h 37 min, Dec −1◦; 64–68 km/s: RA 22 h 41 min; Dec −1◦). The agreement of the two indepen-dent results is quite satisfying.
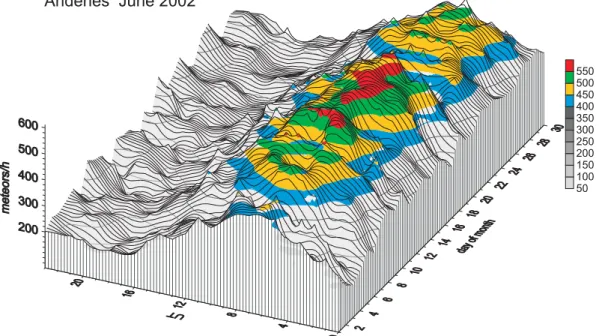
In a mass plot of the hourly meteor counts at Andenes in June 2002 (Fig. 12) three peaks are clearly recognizable between 06:00 and 10:00 UT which are related to the Ari-etids, Zeta Perseids, and Beta Taurids as shown below. In 2002 our observed meteor rate peaks between 7–8 June (Ari-etids), between 11–18 June (Zeta Perseids), and between 25– 29 June (Beta Taurids). The contribution of the three daytime
1362 W. Singer et al.: Meteor rates
Table 3. Summer daylight showers (from observations at 69◦N).
Shower Arietids Zeta Perseids Beta Taurids
Date of radiant estimate 2002 7–8 June 11–18 June 26–28 June
Shower velocity range [km/s] 36–44 28–30 30–34
Radiant RA [h, min] 03 h 10 min±20 min 04 h 14 min±20 min 06 h 02 min±20 min
Radiant Dec [◦] +27±3 +31±3 +23±3
Meteors, with shower velocity Nshower 72 127 71
Meteors, all velocities Nall 947 3907 1332
Ratio Nshower/Nall[%] 8 3 5
Andenes June 2002
50 100 150 200 250 300 350 400 450 500 550Fig. 12. The diurnal variation of hourly meteor counts observed at Andenes in June 2002.
0 20 40 60 0.0 0.2 0.4 0.6 0.8 1.0 1.2 frequenc y of oc cur re nc e 20 40 60 ventry [km/s] 20 40 60 7-8 June 2002
5-6 June 2003 11-18 June 200211-18 June 2003 25-29 June 200325-29 June 2002
Arietids Zeta Perseids Beta Taurids
Fig. 13. Normalized occurrence of entry velocities during the
day-time meteor showers at Andenes in June 2002 and 2003.
showers to the total meteor rate has been estimated in the fol-lowing way.
For each of the shower periods meteors are selected for a narrow range of entry velocities centred to the corresponding shower velocity (see Table 3 and Fig. 13) and from these meteors a radiant is determined. We found in all cases well defined radiants (Table 3) which are in good agreement with the radiants given in Table 2. The ratio of meteors in the selected shower velocity band to all meteors for which entry velocities were obtained is generally less than 10%.
A general weakness of signatures from these three June showers for our observation conditions can be expected from the low altitude of their radiants. For our “NEP-close-to-zenith” condition, the radiants of the Arietids, Zeta Perseids, and Beta Taurids are only 8◦, 7◦, and 7◦, respectively, above the local horizon. This should put their meteor trails at rather higher altitudes at which the detection sensitivity of the radar is already strongly reduced. Therefore, we are not really surprised to see so little trace of these showers in our data.
Yet, it means that the strong June maximum in meteor rates persists even without a significant contribution of these day-light showers. This finding is somewhat different from that of Ueda and Maegawa (2001). They attribute much of their June maximum in meteor rate, derived from forward-scatter radio observations at 36◦N, to the activity of the daylight showers.
5 Conclusions
The diurnal variation of meteor rates as observed at a site close to the Arctic circle, is still quite appreciable. The ratio of maximum over minimum meteor rates throughout one di-urnal cycle is 2.3±0.3 from April through December and is even higher in the remaining months.
The annual variation of meteor rates is described as fol-lows: A strong peak of meteor rate is found for the month of June. This is true while considering all detected meteors (i.e. all LT and all altitudes) and also for those detected under our special “NEP-close-to-zenith” condition. In June and un-der “NEP-close-to-zenith” conditions, almost all of the me-teors are detected at altitudes below 100 km with their rate maximizing close to 90 km altitude. A large number of the echoes occur at elevation angles at and below 35◦. These altitude and elevation distributions seem to suggest that the meteors observed by our radar in June come from sporadic meteoroids arriving from the North ecliptic hemisphere with reasonably large ecliptic inclinations and low to moderate at-mospheric entry velocities. The contribution of the daytime showers is probably not larger than 5 to 8%.
Acknowledgements. This work has been supported in part by grant BR 2023/1-1 of the Deutsche Forschungsgemeinschaft, Bonn, Germany, and the radar operations at Andenes by grant HPRI-CT-1999-00002 of the European Union. The SKiYMET radar system was designed and manufactured by Genesis Software, Adelaide, Australia, and Mardoc Inc., London, Ontario, Canada. Edited by: D. Janches
References
Bronshten, V. A.: Physics of Meteor Phenomena, D. Reidel Publ. Co., Dordrecht, Holland, 356, 1983.
Browne, I. C., Bullough, K., Evans, S., and Kaiser, T. R.: Charac-teristics of radio echoes from meteor trails, II: The distribution of meteor magnitudes and masses, Proc. Phys. Soc., B69, 83–97, 1956.
Campistron, B., Despaux, G., Lothon, M., Klaus, V., Pointin, Y., and Mauprivez, M.: A 45 MHz sky temperature map obtained from the observations of five ST radars, Ann. Geophys., 19, 863– 871, 2001.
Ellyett, C. D. and Kennewell, J. A.: Radar meteor rates and atmo-spheric density changes, Nature, 287, 521–522, 1980.
Hawkins, G. S.: A radio echo survey of sporadic meteor radiants, Mon. Not. Roy. Astron. Soc., 116, 92–104, 1956.
Hocking, W. K., Fuller, B., and Vandepeer, B.: Real-time deter-mination of meteor-related parameters utilizing modern digital technology, J. Atmos. Solar. Terr. Phys., 63, 155–169, 2001. Kronk, G. W.: Comets and Meteor Showers, http://comets.
amsmeteors.org/, 2003.
L¨ubken, F.-J.: Thermal structure of the Arctic summer mesosphere, J. Geophys. Res., 104, 9135–9149, 1999.
McKinley, D. W. R.: Meteor Science and Engineering, McGraw-Hill, New York, 309, 1961.
M¨ullemann, A.: Temperaturen, Winde und Turbulenz in der polaren Sommer-mesosphre, Ph.D. thesis, 158, Rostock University, Ros-tock, Germany, 2003.
Nakamura, T., Tsuda, T., Tsutsumi, M., Kita, K., Uehara, T., Kato, S., and Fukao, S.: Meteor wind observations with the MU radar, Radio Sci., 26, 857–869, 1991.
Rapp, M., Gumbel, J., and L¨ubken, F.-J.: Absolute density measure-ments in the middle atmosphere, Ann. Geophys., 19, 571–580, 2001.
Singer, W., Hoffmann, P., Mitchell, N. J., and Jacobi, C.: Meso-spheric and lower thermoMeso-spheric winds at middle Europe and Northern Scandinavia during the Leonid 1999 meteor storm, Earth, Moon and Planets, 82–83, 565–574, 2000.
Singer, W., Bremer, J., Hocking, W. K., Weiß, J., Latteck, R., and Zecha, M.: Temperature and wind tides around the summer mesopause at middle and arctic latitudes, Adv. Space Res., 31, 9, 2055–2060, doi:10.1016/S0273-1177(03)00228-X, 2003. Singer, W., Bremer, J., Weiß, J., Hocking, W. K., H¨offner, J.,
Don-ner, M., and Espy, P.: Meteor radar observations at middle and Arctic latitudes Part 1. Mean temperatures, J. Atmos. Sol.-Terr. Phys., 66, 607–616, 2004.
Ueda, M. and Maegawa, K.: Results of forward-scatter radio echo observations in 2000, in Proceedings of the Meteoroids 2001 Conference, edited by Warmbein, B., ESA SP-495, 413–418, 2001.
von Zahn, U.: Achievements of ALOMAR, in Proc. 13th ESA Symp. on European Rocket and Balloon Programmes and Re-lated Research, edited by Kaldeich-Sch¨urmann, B., ESA SP-397, 141–159, 1997.
von Zahn, U. and Berger, U.: Persistent ice cloud in the mid-summer upper mesosphere at high latitudes: Three-dimensional modeling and cloud interactions with the ambient water vapor, J. Geophys. Res., 108, D8, 8451, doi:10.1029/2002JD002409, 2003.