E
Ennggiinneeeerriinngg SSyysstteem
mss D
Diivviissiioonn
Working Paper Series
ESD-WP-2005-07
C
HARACTERIZING
T
HREE
E
NGINEERING
S
YSTEMS
M
ETHODS FOR
S
UPPORTING
R
EGIONAL
S
TRATEGIC
T
RANSPORTATION
P
LANNING
A
PPLIED TO
F
REIGHT
S
YSTEMS
Sgouris P. Sgouridis
1, Joseph M. Sussman
2, and Christopher Glazner
31Doctoral Candidate, Engineering Systems Division, MIT
2JR East Professor of Civil and Environmental Engineering and Engineering Systems Division, MIT
3Doctoral Candidate, Engineering Systems Division, MIT
INTRODUCTION
In a previous work the authors described the potential offered by the Complex Large-scale Interconnected Open Socio-technical (CLIOS) Process (1) when used as a meta-process for structuring Regional Strategic Transportation Planning (RSTP) (2). This paper expands on one step of the proposed process (“Step 5: Seek Insight about system behavior”) and investigates how three generic engineering systems methods (Design Structure Matrices (DSM) (3), System Dynamics (SD) (4), and System Architecture (SA) (5)) can contribute towards a greater understanding of the transportation system and the complex environment it is embedded in.
As suggested in (6), the transportation paradigm has had three major eras: (i) infrastructure, (ii) transportation systems, and (iii) post-transportation systems. The infrastructure era focused on the physical design of facilities to meet the needs of the users. The focus was on serving user demand, building physical infrastructure capacity, and improving mobility in a modally-oriented fashion. The second era emerged in the late 1950s and 1960s when people like Marvin Manheim (7) and A.Scheffer Lang at MIT and William Garrison at Berkeley introduced a more nuanced economics-based view of transportation systems in which capacity provision is informed by supply/demand analyses, accessibility, and the consideration of networks across modes (intermodalism). Finally, the third era is under way: it is realized that transportation systems are interacting in a complex environment both physical and institutional and have direct and indirect economic, environmental, and social impacts which should be taken into account when considering the improvements in societal welfare offered by transportation investments. Balancing those impacts in a sustainable fashion characterizes the third era. The two previous transitions have been facilitated by improvements in our understanding of complex systems with fields like network theory, operations research, and applied economics providing the tools for the transitions. The increasingly available information-processing capacity allows the CLIOS Process aided by DSM, SD, and SA to be used as an integration tool that can manage the levels of complexity exhibited as the transportation planning community proceeds in the transition towards the third era.
We demonstrate the use of these tools and discuss them in the area of freight transportation planning. In this context, the transition to a CLIOS view of transportation systems extends into environment, trade, land use, regulations, and institutional planning in a way that integrates those pieces. Our goal is not to create the ultimate transportation planning process – this is after all a region-specific endeavor – but to put on the table an initial blueprint of a
process that ties together strands considered disparate in the current discourse on freight transport: institutional and physical domains, transportation flows and trade, production effluents and consumption, pricing of externalities and pricing of transport use, planning for infrastructure and planning for operations, public and private goals and interests. These strands
will be hard to tie together but doing so is a necessary exercise if sustainable transportation is to be achieved. And sustainable transportation is not necessarily present in a region where consumption and resource use is the most efficient based on contemporary marginal costs but rather in a region that will be able to flourish in the long-run based on balancing internal and external costs and benefits, preparing for shocks (e.g. depletion of fossil fuel resources known as “peak oil” (8)), and cooperating for mitigation and avoidance of preventable harms (e.g. the phenomenon of global climate change attributed to greenhouse gas emissions (9)).
As we discuss in the next section, there is a substantial gap between the potential of transportation planning and its current status. More specifically we find that in the U.S. freight
transportation planning is being conducted using well-structured frameworks; yet it lacks broadness in scope. On the other hand, while the European Union does not embrace a specific framework for transportation planning, it has quite a broad scope when it comes in assessing the effects and importance of freight transportation. Our proposed framework bridges that gap by incorporating both broadness in scope (a necessity for meaningful sustainable development planning) and structure (that eases some of the organizing work for the planner and provides common standards for the processes to be evaluated on).
The Freight Transport System (FTS) relative to SCM
The management of freight transport in the broader context was traditionally part of logistics service provision defined as the managing of all needed resources for the completion of any
given activity. It may include acquisition, movement and storage of materials and information as well as the transport of personnel. Supply Chain Management is both narrower and broader than
the logistics concept. It is narrower in the sense that it is used mainly in the context of large-scale commercial (and military) operations and enterprises. It is broader in the sense that ideally it explicitly considers the whole set of links (supply chain) that lead from upstream raw materials acquisition to downstream end product retailers and finally consumers as shown in Figure 1 rather than simply the immediate upstream neighbors.
(10) defines SCM as “a set of approaches utilized to efficiently integrate suppliers,
manufacturers, warehouses and stores, so that merchandize is produced and distributed at the right quantities, to the right locations, and at the right time, in order to minimize systemwide costs while satisfying service level requirements.” In this definition the need for some kind of
vertical integration among the tiers of the supply chain emerges as critical while the implicit goal of SCM is shaped to establish the globally optimum cost structure for given service level requirements.
(11) attributes the emergence of the SCM model
(a) to the increased competition in the global markets due to liberalization and consumer preference,
(b) the emergence of new information and communication technologies (ICT) that enabled actions that were previously infeasible, and
(c) the success of the pioneering Toyota model. To these main motivations we would add
(d) the global diversity in regulations, labor costs, and taxes that provided substantial economic regional competitive advantages (12) to be gained by internationalization of supply chains in addition to the traditional comparative regional ones and
(e) the advances in transportation technology and the deregulation of freight transport that allowed for diminishing transport lead-times, efficient intermodal changes, and decreasing real costs per transported unit.
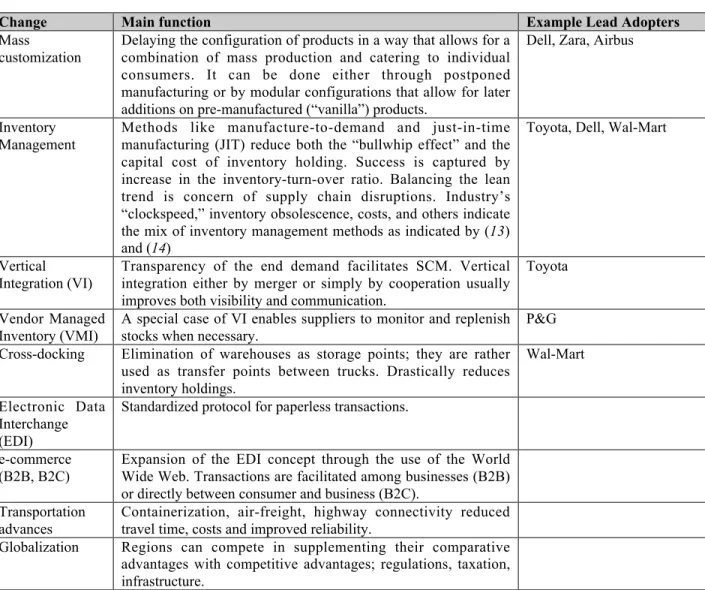
Finally, increased competition among companies that market consumer products has various impacts on their behavior and the requirements that firms put on their supply chain. Table 1 summarizes the type and impact of the more important changes in SCM.
TABLE 1 Types of Change adopted by SCM.
Change Main function Example Lead Adopters
Mass
customization
Delaying the configuration of products in a way that allows for a combination of mass production and catering to individual consumers. It can be done either through postponed manufacturing or by modular configurations that allow for later additions on pre-manufactured (“vanilla”) products.
Dell, Zara, Airbus
Inventory Management
Methods like manufacture-to-demand and just-in-time manufacturing (JIT) reduce both the “bullwhip effect” and the capital cost of inventory holding. Success is captured by increase in the inventory-turn-over ratio. Balancing the lean trend is concern of supply chain disruptions. Industry’s “clockspeed,” inventory obsolescence, costs, and others indicate the mix of inventory management methods as indicated by (13) and (14)
Toyota, Dell, Wal-Mart
Vertical Integration (VI)
Transparency of the end demand facilitates SCM. Vertical integration either by merger or simply by cooperation usually improves both visibility and communication.
Toyota Vendor Managed
Inventory (VMI)
A special case of VI enables suppliers to monitor and replenish stocks when necessary.
P&G
Cross-docking Elimination of warehouses as storage points; they are rather
used as transfer points between trucks. Drastically reduces inventory holdings.
Wal-Mart Electronic Data
Interchange (EDI)
Standardized protocol for paperless transactions.
e-commerce (B2B, B2C)
Expansion of the EDI concept through the use of the World Wide Web. Transactions are facilitated among businesses (B2B) or directly between consumer and business (B2C).
Transportation advances
Containerization, air-freight, highway connectivity reduced travel time, costs and improved reliability.
Globalization Regions can compete in supplementing their comparative
advantages with competitive advantages; regulations, taxation, infrastructure.
It is practically impossible to isolate one single effect that these SCM practices have on FTS; some create more demand by increasing the frequency and decreasing the volume of shipments while others favor consolidation and thus create a downward trend in demand. What is clear is that it is regions with greater connectivity that are better placed for leveraging their comparative advantages in the global economic arena. The long-term question for the transportation planners is how to balance longer term viability and better environmental sustainability by focusing on consolidating and energy-efficient means for providing adequate capacity in transportation that is not stifling demand. In the next section we begin to address this question.
FTS relative to Contemporary Transportation Planning
Transportation planning, in its generic form, is a process that begins from understanding the
current (and future) transportation needs of an area and provides ways to meet those needs in an effective manner. Transportation planning had traditionally been concerned with infrastructure building and maintenance, but it more recently also includes operational aspects and measures to
improve transport flows like Intelligent Transportation Systems (ITS) as well as demand management techniques such as pricing.
The adjective strategic in transportation planning produces four associations for the process: firstly it stresses the linkage of transportation with the overall development plans of a region – its economic, environmental and social state; secondly it implies a systemic view of the transport system where all modes are considered as cooperative in the development plan; thirdly, it implies a long-term general plan view rather than a short term project-specific one; finally, because of the intricacies created by the interaction of the above, the importance of institutional issues emerges and potentially creates another level of planning for institutional change.
Lastly, the term regional sets the boundaries for the process. (15) define regions as “functioning economic entit[ies].” Regions can be bounded differently on various levels: geographically they can be limited by physical barriers, politically by borders (international or intra-national), economically by the level of interactions among urban centers. For each of these cases there are in turn levels that influence the actual geographic area covered by the region. In transportation, all these views of regions are pertinent. In this work we will refer to regions that comprise a metropolitan area, a whole nation, or even clusters of (parts of) nations. A region’s geographic extent may include one or more metropolitan centers, several smaller cities and rural areas. Although a region may indeed cross political borders, government cooperation is critical for any successful regional planning.
The definition of goals for transportation planning can be deceptively straight forward: a plausible goal could be the provision of a reliable and cost-effective transportation system that
will have adequate capacity to serve the transportation needs of a region for the planning timeframe.
Since the transportation of freight is a derived demand, the capacity of a system capable of transporting freight is also derived and hence, the capacity of such system has to approximately match the current or anticipated demand for freight. This leads Hicks (1977) as quoted by (16) to describe the same vision transformed to fit the freight transportation sector, but highlighting the importance of reduction of external costs or “disbenefits.” In Hicks’ words: [the
goal of freight transportation policy planning is] the discovery and effective implementation of measures which will reduce the total social cost of goods movement to the lowest possible level commensurate with the freight requirements and objectives of society.
In the RSTP-related literature, several goals are included ranging from economic growth and/or development, to sustainability, decoupling and environmental considerations, to promotion of safety, and - post 9/11 - to security and resiliency of the network as well as of the individual supply chains. In Table 2 we review some of these potential goals in greater detail.
TABLE 2 Potential Large-scale RSTP goals.
Goal Description Economic
growth
Used as justification for infrastructure investments by governments but the academic literature points out that infrastructure is a necessary but not sufficient condition for growth (See (17) and (18)). Direct transport-related contribution on GDP can reach up to 10% (According to BTS (2003) for-hire transportation activities in the US contributed 3% of the country’s GDP in 2001 while if we consider transportation final demand, that is all activities that were related to transportation, this contribution reaches 10.4% of total GDP. )
Economic Development
Requires a more systemic line of thinking. (12) emphasizes the fact that a regional competitive advantage cannot be based solely on transportation infrastructure and a reasonable tax policy. (17) cites different studies that lead to varying conclusions on the economic effects of transport infrastructure, indicating that there is no “silver bullet” in tackling economic development
Sustainability (19) indicate that it is concerned with the transportation system’s connections with the other
sectors of the economy, environment, and society.
Decoupling Decoupling implies a reduction of transportation intensity. For freight transport this would
mean that the growth of the GDP should be independent or at least not heavily correlated with ton-mile growth, or some argue simply with the emissions from the sector. Part of the decoupling success is based on the “dematerialization” of the economy where the weight, volume, and quantity of goods is being reduced while their value is increasing.
Safety Reducing the number and intensity of accidents caused by freight modes. It involves both the
actual modes, e.g. truck weight and load configuration and railroad crossings, as well as monitoring the hazardous materials (hazmat) transfers.
Security Post 9/11 safety considerations were expanded to include prevention of malicious intentional
incidents. Tracking of suppliers and more intensive inspections were among the reactions.
Resiliency Simultaneously, the ability of supply chains to withstand large-scale unanticipated shocks was
questioned. Interestingly enough the obvious response to induce robustness is strategic inventory accumulation that may partially reverse the trend towards leaner supply chains.
North American and European countries have exhibited keen interest in the concepts of RSTP. From looking into their respective methods for conducting freight-oriented transportation planning, we found two rather different approaches. On the one hand the U.S. approach is contained within well-structured guidelines as proposed frameworks usually promulgated by the federal DOT (see the U.S. DOT freight planning advisories (20).) What this approach seems to be lacking is a systemic perspective on the economic and environmental interactions that relate to transportation planning. (2) discuss the shortcomings of current transportation planning in greater detail and summarize the various types of transportation plans currently in use.
In the European Union planning guidelines have been less structured but on the other hand encouraged planning agencies in individual countries to consider and respond to a greater set of societal goals. The most recent planning guidelines is the White Paper for common transport policy: “European Transport Policy for 2010: Time to decide”(21). It is notable for the ambitious sustainability agenda that it promulgates but also for explicitly referencing the need for comprehensive policy planning across the board (pg. 15/Section V, the relevant areas are identified as: economic policy, land-use planning, social policy, urban transport policy, internalization of external costs, opening of markets (de-regulation), and transport research) which aligns very well with the arguments raised in this paper. The European planning process can thus be characterized as top-down; the goals and general guidelines are set on the highest echelons informed by research projects. Individual countries like the U.K. and Canada have also
mobilized towards reducing carbon emissions from transport since the ratification of the Kyoto Protocol (22, 23).
As part of our effort, we attempt to combine the best of the two worlds, by constructing a rigorous framework for freight transportation planning that is based on systems perspectives and modeling tools. In the next section we discuss why such an approach can be useful for the planners and expand on the methods used to support it.
RSTP/SCM AS A CLIOS META-PROCESS
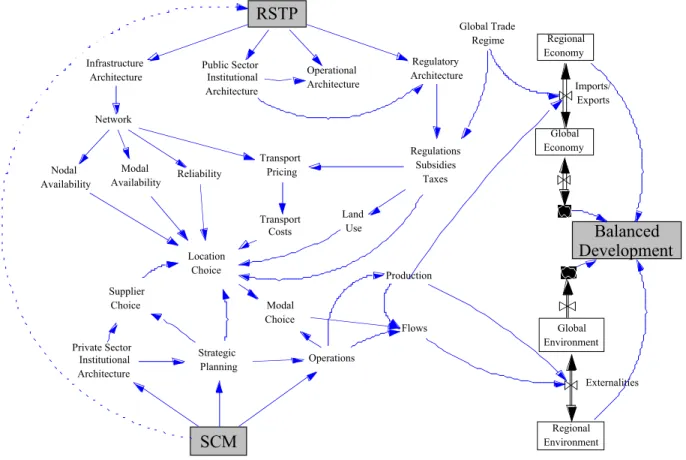
As becomes evident in the preceding section, comprehensive transportation planning for freight is ultimately focused on facilitating regional development. But as we show in Figure 1, there is a host of complex interactions that have ambivalent impacts on the growth and sustainability of regional development. We propose the use of an integrated RSTP/SCM process as an aid in managing this complexity and supporting meaningful transportation planning.
RSTP
Infrastructure
Architecture Public SectorInstitutional Architecture Operational Architecture Regulatory Architecture SCM Private Sector Institutional Architecture Operations Network Regulations Subsidies Taxes Regional Economy Regional Environment Global Environment Global Economy Imports/ Exports Externalities Global Trade Regime Flows Balanced Development Transport Costs Nodal Availability Modal Availability Land Use Transport Pricing Reliability Supplier Choice Location Choice Production Strategic Planning Modal Choice
FIGURE 1 Schematic primary interactions in the RSTP/SCM system (Prepared with Vensim ®).
The RSTP/SCM process uses the CLIOS Process as a meta-process as outlined in (2). The CLIOS Process is comprised of 12 steps within three stages: Representation, where the objectives of the process are stated and the structure and behavior of the system is analyzed and diagrammatically modeled; Design – Evaluation – Selection, where policies (or strategic
alternatives) to satisfy the objectives are created, assessed and bundles are selected;
Implementation, where the selected policies are implemented.
Step 5 is the last step of the Representation stage and the focus of this paper. The interested reader can find all the steps of the CLIOS Process detailed in (24). Before proceeding, we should note that the RSTP/SCM process was developed based on a generic hypothetical region in which we identified a set of common freight movements as described in (25) and a plausible institutional background. This way we created a relatively simplified model of the problem by ignoring context-specific characteristics which is still nuanced enough to capture the prominent interactions of the real world.
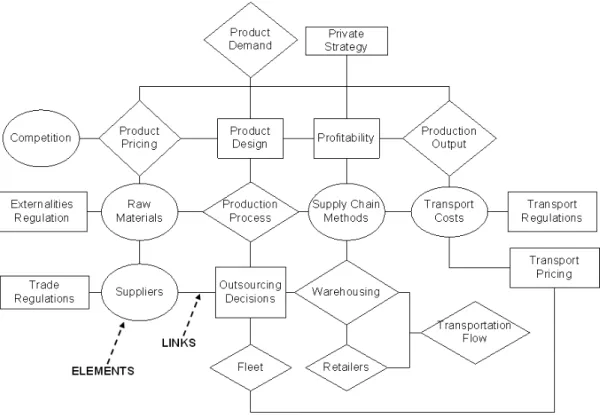
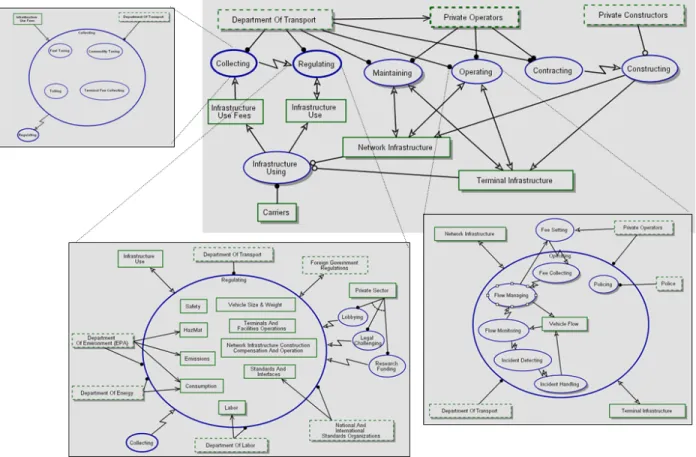
FIGURE 2 Illustrative CLIOS Diagram Developed for the RSTP/SCM Process (Displays the Manufacturing/SCM Subsystem).
In the steps of the RSTP/SCM process leading to Step 5, the freight transportation system of our imaginary region was structured into major subsystems and the institutional sphere as we do for all CLIOS Systems. In this case, we used five major subsystems – Transportation, Economy, Environment, Land-use, and Manufacturing/SCM – and a surrounding institutional sphere containing the organizations germane to this situation. Probing into the interactions shown in Figure 1 allowed us to populate each subsystem with elements and actor groups in order to offer incisive analytical detail. For example, the transportation subsystem included the infrastructure network, the flows on the network, and the fleet composition; in addition we represented how public institutions affected infrastructure and pricing through regulatory action but also the influence of the economics of supply chains on flow volume. As an example, the CLIOS System diagram of another critical subsystem, Manufacturing/SCM, is shown in Figure 2. This diagram
summarizes how supply chains are affected both by strategic decisions on the private sector side as well as the trade and environmental regulation regime on the public sector side. These CLIOS System diagrams serve as starting points for additional analysis in Step 5.
Step 5: Seek insight about the system behavior
How one actually achieves the objective of this representation step – that is to gain insight about the system – will usually differ among CLIOS Systems as will the kind and depth of the insights. In general terms, gaining insight means understanding the behavior of the system, identifying interactions that are important, as well as significant positive and negative feedback loops. In the following we propose four structured ways of approaching insight generation (there are doubtless others): (i) interaction among experts, (ii) design structure matrix (DSM), (iii) systems dynamics (SD), and (iv) system architecture (SA) decomposition. While any of the four can be used in isolation. We suggest that better results can be obtained by combining the insights from these methods.
The first –interaction among experts – normally takes place throughout the CLIOS Process. It involves gauging the knowledge of stakeholders and experts on the system through personal interviews and questionnaires. Since our system at its current stage is mainly a conceptual model we will rely on the latter three ways of understanding system behavior and finding the major points of leverage in the system.
We view these methods as complementary with each one contributing to the whole. The CLIOS System diagrams provide the basis of understanding, capture the complexities of the institutional sphere and, due to their intuitive appeal, can be used for engaging non-specialists in the process. Further analysis will be supported by the structuring and understanding provided by the CLIOS System diagrams. The DSM may provide additional insight by clustering of components within subsystems or by highlighting non-intuitive additions to those clusters. The SD modeling, with a greater emphasis on causal interactions and quantification, brings to light emergent behaviors due to the dynamics of the system, allows for experimenting, but with the risk of a potentially misleading sense of accuracy. Finally, SA facilitates the expansion of the design space for introducing alternatives and promotes analysis on different levels revealing details that may have been lost in the mainly macro-level approach of the previous techniques. In the following sections we present the application of each method in the RSTP/SCM context and the potential insights to be gained.
Design Structure Matrix Analysis
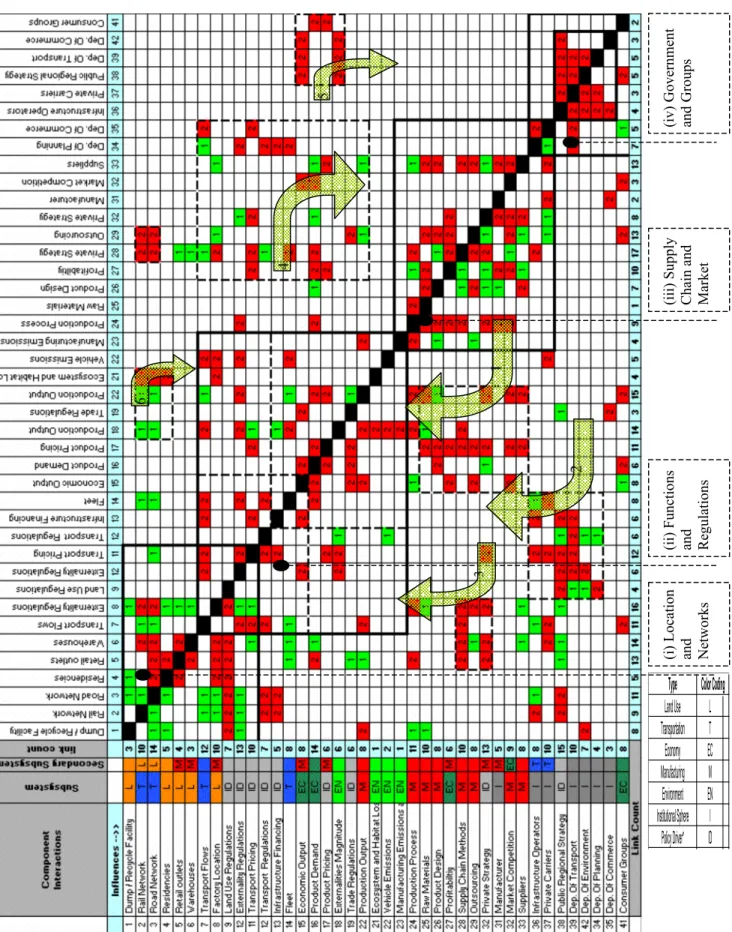
Even with a simplified model, the number of links and elements in the CLIOS System diagrams rises quickly and can make visual representation unwieldy and cluttered. As an alternative non-diagrammatic to represent this complex system in a concise and complete manner, we can use the Design Structure Matrix (DSM) methodology, primarily developed for product design and system analysis (3). It provides a summary of the links as well as tools for analyzing the structure. Figure 3 shows the processed DSM for the RSTP/SCM process. Each element of the CLIOS System diagrams is assigned to a column and a row. When an element influences another element, that is a link exists between them in the CLIOS System diagrams, a mark denotes this relationship on the appropriate square. DSM allows for less important links that would not be normally shown in the CLIOS System diagrams to avoid cluttering, to be represented by
ascribing a relative weight. In Figure 3, the squares marked with 1 denote primary links and those with 2 denote secondary impact.
In order to visualize system behavior using the DSM, we need to process it so that the internal structure can become visible. One way to do so is to cluster the matrix in a way so that tight interconnections are revealed. The analysis tools designed for DSM are focused on partitioning and clustering the matrix. In this case we used the trial version of PSM32, a commercially available software package for DSM by Problematics Inc., to cluster this CLIOS System. The results of this first-order clustering and some manual re-ordering can be seen in Figure 3.
The four main clusters of tight interactions that appear are: (i) Locations and networks, (ii) Economic functions, market, and regulations, (iii) Supply chain, and (iv) Government and groups. What becomes apparent from Figure 2 is that this system encompasses a high degree of integration. This lack of “modularity” suggests that any planning effort should be based on comprehensive models– one cannot expect to change one aspect or one cluster of the system without impacting other clusters. These types of interactions are shown as block arrows in the table in addition to clusters across the main diagonal. These off-diagonal clusters or “blocks” are marked by an arrow that indicates the direction of influence from cluster to cluster. The more significant blocks that emerge are: 1. the influence of supply chains on the markets (Cluster (ii)); 2. The influence of government on the regulations (upper left of Cluster (ii)); 3. The influence of supply chains on locations (especially retailers, warehouses, and factories of Cluster (i)); 4. The influence of regulations and functions (Cluster (ii)) on supply chains; and 5. The influence of economic output and externalities on government.
Type Land Use L Transportation T Economy EC Manufacturing M Environment EN Institutional Sphere I Policy Driver* ID Color Coding
FIGURE 3 A Possible Clustering of the DSM for the Regional Freight System.
(i) Location and Networks (ii) Functions and Regulations (iii) Supply Chain and Market (iv) Government and Groups
Beyond knowing how clusters form and influence each other we can identify individual “hub” components. “Hub” components are those with the greater number of outgoing and/or incoming links. The most “influential” components, those with the most outgoing links, appear to be the public regional strategy, the road and rail networks, the product demand, and the private strategy. Supply chain methods, location of manufacturing, production output, magnitude of externalities, and outsourcing seem to be the elements with the most incoming links. The components with the higher rankings are among the ones that planners should consider when looking for ways to affect change but if the system is close to a desired equilibrium state then they may want to avoid upsetting those parameters.
Given the tight interactions and persistent feed forward dynamics of the system the way that a change in one of those components affects performance may not be intuitive; for this reason it is useful to have a dynamic model of the system like the one suggested in the next section.
System Dynamics Analysis
The representation of a system through System Dynamics follows the procedure and notation described in detail by (4). In the following we will discuss the qualitative model for the most important interactions in our simplified regional system. The engine of SD modeling is causal loop diagrams. In our case the diagrams that were generated magnified the clusters identified in Figure 3.
A causal loop model distills the basic functions of the CLIOS System diagrams and emphasizes the physical aspects as opposed to their institutional background. At the heart of the model is a chain of stocks and flows that represent a full material product life cycle. The various levels of raw material extraction, actual production, inventory acquisition, sales, discarding, and re-use are represented. Each of the flows that utilize the transport network translates into actual transport flow. There are four loops that are active in this part of the model:
(1) as the product sales increase so does economic output and product demand, but
(2) as sales increase the stock of products in use the demand increase is slowed since a greater percentage of total potential customers are satisfied. Finally,
(3) and (4) are adjusting the price to reflect demand and inventory but transport cost per shipment is also influencing the final price.
Economic activity influences capacity of two procedures: by directly giving a signal to capacity changes on the manufacturing side as well as by allowing infrastructure maintenance and expansion through revenues from taxing and/ or transport pricing.
A large part of the model consists of the representation of the influence of the transportation flows on the network. The two main connecting variables with the rest of the model are the amount of flow (indicated as transport flow) and the transport cost per shipment that in turn influences product pricing. These two variables are connected with loops that represent fuel use and fuel cost, emissions restrictions and pricing, congestion, as well as a bigger loop that calibrates total production based on demand that is in turn affected by transport cost. Other influences include the long term effects of transport pricing to relocation of facilities as well as the effects of passenger traffic both on congestion and emissions. Finally there are a number of variables that represent regulatory influences like fuel taxes, vehicle fuel efficiency regulations, and emissions restrictions.
The major addition of the causal-loop SD model over the DSM model is that it focuses on the dominant functions of the variables/elements by offering a clearer view of the loop
interactions and a sense of dynamic development through time. This latter feature is SD’s greatest advantage and can mainly be utilized through simulation which requires quantification. Of course, quantification into a simulation model may not be widely acceptable across stakeholders initially and may be difficult since many components are qualitative. Even with these caveats, simulation can greatly enhance the understanding of the system (i.e. insight), if used as a suggestive and not predictive tool, and if reasonably validated.
Using a calibrated model and simulation, the researcher can identify the relative impact of the various regulatory influences (26). Given that there are many embedded loops, the model can measure the sensitivity of the major variables (transport flow and economic output) in changes in the other model parameters. Of special interest are the effects of parameters that exhibit delayed change (infrastructure development, delays from measuring of pollution to implementing regulation, or from depleting fuel reserves and affecting fuel price) or of the effect of regulations that may have ambivalent impact or be highly contested. For example, a policy to shift freight off highways (e.g. through pricing or mandating) may have negative impact on revenues for maintaining the existing network. This policy could be resisted not only by the shippers but by highway departments; that would resist restrictions on their revenues (27).
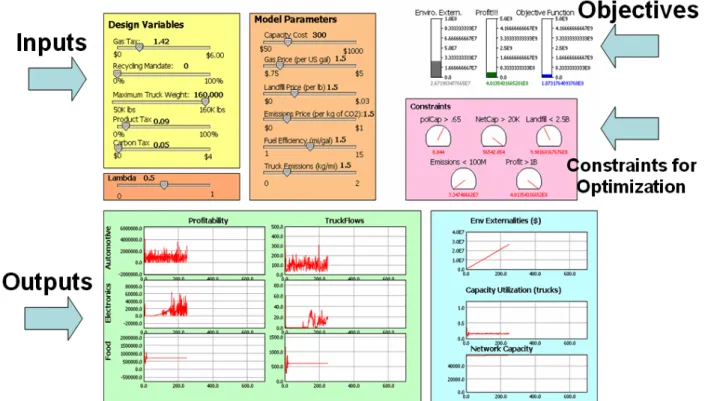
A proof-of-concept simulation of this type that was combined with an optimization engine was developed using the AnyLogic software v5.1 by XJtek. We chose to model three contrasting industries in our hypothetical region—an automotive industry, an electronics industry, and a food distribution network. Each one of these industries has fairly different freight demands, and creates revenue and impacts the environment in different ways and at different rates, allowing for increased insight into the effects of policies on highly differentiated industries. Since this was a demonstration project we used only five design variables: gas tax level, truck weight limit, levels of recycling, product tax, and carbon emissions tax during production (see Figure 4 for a dashboard view of the control panel) as a way to see which policy areas (and not only transportation) would impact the system more severely. In addition, we used more than one hundred individual parameters to represent a range of real-world characteristics typically beyond the control of transportation planners, ranging from the efficiency of the vehicles used to the demand curves for individual products.
An additional advantage of this type of modeling work is that it allows for automated optimization procedures to be used resulting in Pareto fronts along the trade-space of the objectives. For a more complete presentation of the model and the obtained results the reader is referred to (26).
But even when the planners have a model to represent the system functions, it may be necessary to think of the different ways that the system may be structured beyond the legacy system that has been evolved over time. In this exercise, more efficient structures may surface; the system architecture paradigm is one way that planners can use to expand their possible design space as discussed in the following section.
FIGURE 4 Dashboard View of Demonstration SD Simulation Model. Systems Architecture (SA)
This methodology also derives from the product development field of study. SA is characterized by flexibility in the development process since it aims to provide a boost of creativity for developing innovative products and systems. In the product development area, SA precedes more detailed work. On the contrary when dealing with an evolutionary system like transportation where the system is pre-existing and there is institutional legacy, SA analysis can be used primarily as a means to free the mind of the planners and explore solutions that may contradict intuitive or pragmatic expectations.
In using the SA process, first the system needs to be seen in its context. The main elements of FTS in the above representation are the infrastructure, the equipment, and the agents that operate it (from organizations to human drivers). The infrastructure element is constituted by the networks, terminals, storage facilities and the equipment element includes network vehicles and terminal equipment. The operand of this representation is the freight that is being transported, or transformed from its initial position to one in which it has added value. The beneficiaries of this transformation process are the consignors (shippers) and consignees (receivers) which could also be represented as producers and consumers.
The FTS system is incorporated within the greater context of society, which includes organizations (as operators, beneficiaries, and managers), other supporting infrastructures (e.g. the power grid, the fuel extraction and refining industry, the equipment manufacturing plants), as well as systems that use the same infrastructures but for different purposes (e.g. the passenger transportation system, and the defense system).
From a functional perspective as well from a structural perspective, an FTS system can be studied in three distinct levels: the micro level that encompasses the actions of receiving, transporting and delivering goods; the mid level that includes the transporting organization; and the macro level that involves the processes for planning, constructing, maintaining and operating the infrastructure that is necessary for the micro-level functions to take place. The mid and macro levels are functioning in a way that satisfies the needs of both beneficiaries and accommodate the operand specifications (cargo). The levels also reflect differences in timeframes with expanding time horizons as one goes from micro- (hours to weeks), to mid- (days to months), to macro-(months to decades).
After preparing the system context, the SA process provides the problem statement and concept of the studied system and begins the decomposition of the system into components. One useful methodology for decomposition in SA analysis is Object-Process Methodology (OPM) as developed by (28). One example of a functional decomposition of an FTS can be seen in Figure 5.
FIGURE 5 Macro-level Functional Decomposition of an FTS: Regulations and Infrastructure Building.
The advantages and insights from this approach would be generated when the results of the SA analysis are compared to existing situations. In our example, having a “solution-neutral” approach might lead the planners to consider sea-shipping in addition to or as a replacement of the land-based modes. On a different aspect the dependence on the fossil fuel industry may be questioned. Finally, the current transportation planning process is based on aggregate
transportation needs satisfaction; the planning level (macro) is primarily disconnected from the user level (mid and micro) as shown by the expanded “Regulating” function of Figure 4 where the functions connecting the private sector and the function is lobbying, courts, and privately sponsored research. Changing that connectivity and having the planning to take into account, anticipate, react to, or even precipitate changes in the SCM processes of the firms in the region is not part of the current transportation planning state-of-the-art.
CONCLUSIONS ON THE PROPOSED RSTP/SCM PROCESS AND FURTHER RESEARCH
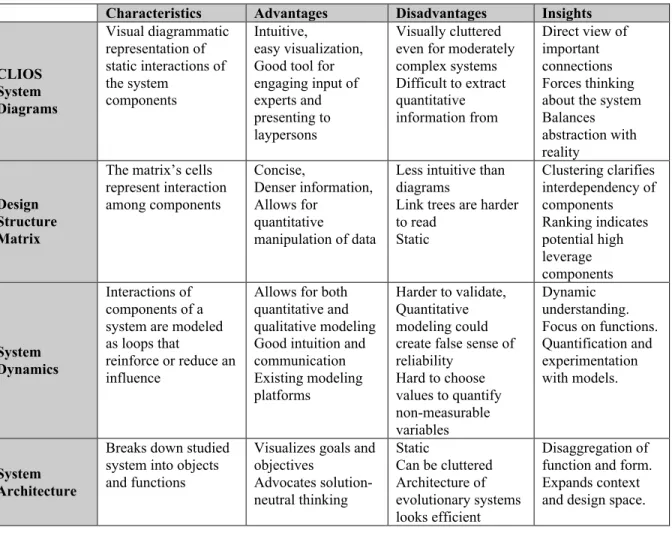
With the RSTP/SCM process structured as a CLIOS meta-process we argue that it is feasible to create a transportation planning process that is informed by and favorably impacts the supply chains. The three methods that we proposed for the RSTP/SCM process are summarized in Table 3 based on their characteristics, advantages, disadvantages and usefulness.
TABLE 3 Comparative Summary of Proposed CLIOS Methods of Analysis: CLIOS Diagrams, Link Matrix, System Dynamics, and System Architecture
Characteristics Advantages Disadvantages Insights
CLIOS System Diagrams Visual diagrammatic representation of static interactions of the system components Intuitive, easy visualization, Good tool for engaging input of experts and presenting to laypersons
Visually cluttered even for moderately complex systems Difficult to extract quantitative information from Direct view of important connections Forces thinking about the system Balances abstraction with reality Design Structure Matrix
The matrix’s cells represent interaction among components Concise, Denser information, Allows for quantitative manipulation of data
Less intuitive than diagrams
Link trees are harder to read Static Clustering clarifies interdependency of components Ranking indicates potential high leverage components System Dynamics Interactions of components of a system are modeled as loops that
reinforce or reduce an influence
Allows for both quantitative and qualitative modeling Good intuition and communication Existing modeling platforms Harder to validate, Quantitative modeling could create false sense of reliability Hard to choose values to quantify non-measurable variables Dynamic understanding. Focus on functions. Quantification and experimentation with models. System Architecture
Breaks down studied system into objects and functions
Visualizes goals and objectives Advocates solution-neutral thinking Static Can be cluttered Architecture of evolutionary systems looks efficient Disaggregation of function and form. Expands context and design space.
We also argued that a process integrating transport, trade, and the environment is needed if sustainability becomes a central goal in transportation policy making. For example, by using
the SD model we can appreciate that changing product consumption affects transport with more than one mechanism or that imposing regulatory restrictions on the production process can have ambiguous outcomes depending on the ability of the sector to react to the change without altering throughput. These kind of events can cause ripple effects on the economy of the region which can lead into reinforcing feedback loops or balance out without leading to crises. To cite another example, pricing freight transport externalities would increase freight rates which may increase end-price which in turn may lead competitors to enter the market and eventually lead to a price-war and economic downturn; conversely, it may balance out.
The essential conclusion that can be drawn up to now is that freight transportation planning is a complex process with impacts that can not be predicted with certainty but that achieving better insight is certainly possible. The high clockspeed changes of the global economy – especially when it comes to high-tech industries – make regional economic development difficult to predict and as a consequence this uncertainty compounds the uncertainty faced regarding the returns on investment for transportation projects. The complexity of the problem is increased when the goals of sustainable development are added to a focus just on economic development. In the former case the process we propose has, in principle, additional advantages since the environmental impacts and the tools to influence them are integrally considered in the process.
To conclude, this paper discussed the importance of understanding (i) the supply chains of the industries that operate in a region when conducting regional strategic transportation planning and (ii) the needs of freight shippers and carriers beyond simple capacity enhancements should be considered. As a way to do so meaningfully, the authors proposed the CLIOS based RSTP/SCM process and demonstrated the use and insights gained from three engineering system methodologies: Design Structure Matrices, System Dynamics, and System Architecture. These methods become especially relevant when sustainability is among the policy goals of the transportation planner and of the public sector. In this case greater levels of cooperation and understanding of complex interactions are needed if the policy goal is to be achieved. Implementing such a process can be hindered by all sorts of barriers especially considering that up to now societies based on the consumption/production capitalistic market model have been relying on non-renewable resources for their development following a possibly non-sustainable path to growth. The latter should not be a cause of despair but instead a challenge for “a group of nations to take the lead and demonstrate the art of the impossible,” as (29) urges.
A Final Word on Further Research
Until now, having a balance sheet of impacts for a given product from the manufacturing process to transportation and usage/operation (i.e. from the total life-cycle perspective) has not been considered as worthy of consideration for regulatory regimes. But, it may be possible to use transportation as a springboard to control and monitor the resource-intensiveness of the product life-cycles. One potential way to do so is to tie the pricing of the transportation service to the total externality costs of the products transported; that is creating a content-based discriminatory pricing scheme similar to those used for centuries (30) but with the added twist of accounting for externality costs. This scheme, that we have called SAF/ER (for Sustainability-Adjusted Freight/Environment Rates) could be tested for efficacy and impacts both in a qualitative political model as well as in a quantitative one.
REFERENCES
1. Dodder, R.S., et al. The Concept of the "CLIOS Process": Integrating the Study of Physical and Institutional Systems Using Mexico City as an Example. MIT ESD Symposium. 2004. Cambridge, MA.
2. Sussman, J., S. Sgouridis, and J. Ward, A New Approach to Transportation Planning: Regional Strategic Transportation Planning as a CLIOS. Transportation Research Record (In press), 2004.
3. DSM. Design Structure Matrix Website, at http://www.dsmweb.org/. 2004 [cited. 4. Sterman, J., Business dynamics: systems thinking and modeling for a complex world.
2000, Boston: Irwin/McGraw-Hill. xxvi, 982 p.
5. Crawley, E., et al. The Influence of Architecture in Engineering Systems. in MIT Engineering Systems Symposium. 2004. Cambridge, MA: MIT. Available at:
http://esd.mit.edu/symposium/monograph.
6. Sussman, J., The Evolution of Transportation: How Technology and Deployment Relate -- The Case of ITS. 2005, MIT. Council of Universities Transportation Centers (Luncheon Speech). Paper in Preparation.
7. Manheim, M.L., Fundamentals of transportation systems analysis. MIT Press series in transportation studies; 4-. 1979, Cambridge, Mass.: MIT Press. v.
8. Deffeyes, K.S., Hubbert's Peak: The Impending World Oil Shortage. 2001: Princeton University Press.
9. IPCC, (Intergovernmental Panel on Climate Change) Climate Change: the Scientific Basis. 2001: Cambridge University Press.
10. Simchi-Levi, D., P. Kaminsky, and E. Simchi-Levi, Designing and managing the supply chain: concepts, strategies, and case studies. 3rd ed. 2003, Boston:
Irwin/McGraw-Hill. xxii, 321 p.
11. Runhaar, H., Freight Transport: at any price? in DUP Science. 2002, Delft: Netherlands.
12. Porter, M., Regions and the New Economics of Competition, in In Global City-Regions, A.J. Scott, Editor. 2001, Oxford University Press: New York, NY. p. pp. 139-157.
13. Fine, C. and D. Whitney, Is the Make-Buy Decision Process a Core Competence? C.M. MIT, Editor. 1996, Center for Technology, Policy and Industrial Development. 14. Chopra, S. and M. Sodhi, Managing Risk to Avoid Supply-Chain Breakdown. MIT
Sloan Management Review, 2004(Fall): p. 53-61.
15. Sussman, J. and C. Conklin, Regional Strategies For The Sustainable Intermodal Transportation Enterprise (ReS/SITE): Five Years of Research. Transportation Research Record: Journal of the Transportation Research Board TRB Record, 2000.
16. Ogden, K.W., Urban goods movement: a guide to policy and planning. 1992, Aldershot, Hants, England; Brookfield, Vt., USA: Ashgate. xix, 397 p.
17. Polenske, K., Competitive Advantage of Regional Internal and External Supply
Chains, in Regional Science Perspectives in Economic Analysis, Benjamin H. Stevens, M.L. Lahr and R.E. Miller, Editors. 2001, Elsevier Science, B.V.: Amsterdam, The Netherlands. p. pp. 259-284.
18. Lakshmanan, T.R. and W.P. Anderson, White Paper: Transportation Infrastructure, Freight Services Sector and Economic Growth, F.H.A. U.S. Department of
Transportation, Editor. 2002, Center for Transportation Studies. Boston University. Available at: http://www.ncgia.ucsb.edu/stella/meetings/20020115/Lakshmanan.pdf. 19. Hall, R. and J. Sussman, Sustainable Transportation – A Strategy for System Change.
Under review: International Journal of Sustainable Development, 2004.
20. DOT, U.S., (U.S. Department of Transportation, Federal Highway Administration) The Metropolitan Transportation Planning Process: Key Issues -- a Briefing Notebook for Decision-makers. 2004.
21. Commission, E., White Paper – European Transport Policy for 2010: Time to decide. 2000, Office of Official Publications for the European Communities. Luxemburg. 22. Green, P., Moving Forward on Climate Change: A Plan for Honouring our Kyoto
Commitment, M.o.P.W.a.G. Services, Editor. 2005, Government of Canada. Ontario, Canada.
23. Academy, R., Transport 2050: The Route to Sustainable Wealth Creation. 2005, The Royal Academy of Engineering. London, UK.
24. Sgouridis, S., Integrating Regional Strategic Transportation Planning and Supply Chain Management: Along the Path to Sustainability, in Engineering Systems Division. 2005, MIT Thesis for the Master in Technology and Policy / Master in Transportation: Cambridge MA.
25. Niles, J., Trucks, Traffic, and Timely Transport: A Regional Freight Logistics Profile, M.T. Institute, Editor. 2003, College of Business San José State University. San Jose. 26. Glazner, C. and S. Sgouridis, Optimizing Freight Transportation Policies for
Sustainability: A Simulation-Based Investigation of Freight Transportation Policy Planning and Supply Chains. 2005, MIT. Working paper. To be submitted for publication.
27. ECMT, E.R.C., Transport and spatial policies: the role of regulatory and fiscal incentives. 2004, Paris, Washington, D.C.: European Conference of Ministers of Transport, OECD Publications and Information Centre [distributor]. 180 p.
28. Dori, D., Object-Process Methodology: A Holistic System Paradigm. 2002, Heidelberg: Springer.
29. Banister, D., European transport policy and sustainable mobility. Transport, development and sustainability. 2000, London; New York: Spon Press. 255 p.
30. Odylzko, A., The Evolution of Price Discrimination in Transportation and its Implications for the Internet. Review of Network Economics, 2004. 3(3).
TABLES
Table 1 Types of Change adopted by SCM Table 2: Potential Large-scale RSTP goals
Table 3: Comparative Summary of proposed CLIOS methods of analysis: CLIOS Diagrams, Link Matrix, System Dynamics, and System Architecture
FIGURES
Figure 1: Schematic main interactions in RSTP/SCM system Figure 2: Schematic main interactions in RSTP/SCM system
Figure 3: A Possible Clustering of the DSM for the Regional Freight System Figure 4: Dashboard View of Demonstration SD Simulation Model