https://doi.org/10.4224/20386110
READ THESE TERMS AND CONDITIONS CAREFULLY BEFORE USING THIS WEBSITE.
https://nrc-publications.canada.ca/eng/copyright
Vous avez des questions? Nous pouvons vous aider. Pour communiquer directement avec un auteur, consultez la
première page de la revue dans laquelle son article a été publié afin de trouver ses coordonnées. Si vous n’arrivez pas à les repérer, communiquez avec nous à PublicationsArchive-ArchivesPublications@nrc-cnrc.gc.ca.
Questions? Contact the NRC Publications Archive team at
PublicationsArchive-ArchivesPublications@nrc-cnrc.gc.ca. If you wish to email the authors directly, please see the first page of the publication for their contact information.
Archives des publications du CNRC
For the publisher’s version, please access the DOI link below./ Pour consulter la version de l’éditeur, utilisez le lien DOI ci-dessous.
Access and use of this website and the material on it are subject to the Terms and Conditions set forth at
Evaluating Rooftop and Vertical Gardens as an Adaptation Strategy for Urban Areas
Bass, B.; Liu, K. K. Y.; Baskaran, B. A.
https://publications-cnrc.canada.ca/fra/droits
L’accès à ce site Web et l’utilisation de son contenu sont assujettis aux conditions présentées dans le site LISEZ CES CONDITIONS ATTENTIVEMENT AVANT D’UTILISER CE SITE WEB.
NRC Publications Record / Notice d'Archives des publications de CNRC:
https://nrc-publications.canada.ca/eng/view/object/?id=7825a6d3-761f-45fd-a845-b1f783ca36b5 https://publications-cnrc.canada.ca/fra/voir/objet/?id=7825a6d3-761f-45fd-a845-b1f783ca36b5
Evaluating Rooftop and Vertical Gardens as an Adaptation Strategy for Urban Areas
Brad Bass; Bas Baskaran
NRCC-46737
Project Number A020
Project Title Evaluating Rooftop and Vertical Gardens as an
Adaptation Strategy for Urban Areas
Principle Investigators
Brad Bass
Adaptation & Impacts Research Group Environment Canada
Bas Baskaran
Institute for Research in Construction National Research Council
National Research Council Canada
Conseil national de recherches Canada
Executive Summary
Green roof infrastructure has become a multi-million dollar industry in Germany and is gaining popularity in other European countries as well. Green roof
infrastructure is more than just soil and plants on a roof, but consists of specialized membranes and drainage barriers to support the growing of vegetation on top of buildings. The benefits of this technology were researched and presented in the Canada Mortgage and Housing Corporation Report Greenbacks from Green Roofs (Peck at el., 1999). Many of the advantages of these technologies, such as the reduction of stormwater runoff, the reduction of cooling loads and the reduction of the urban heat island suggested that this technology could play a role in helping Canadian cities adapt to climate change. The goal of this research was to assess these benefits in a Canadian context.
The report also investigated the potential of even a newer technology, vertical gardens, essentially moving the vegetation from the roof to the walls, in an urban environment. Vertical gardens could refer to vine-covered walls, but they could also include additional infrastructure components to support the growing of vegetation on a wall or as part of a window shade. Both technologies were
assessed using observations and modelling, and both were assessed with regards to the urban heat island and the reduction of indoor temperatures. The reduction of stormwater runoff was only evaluated for green roof infrastructure.
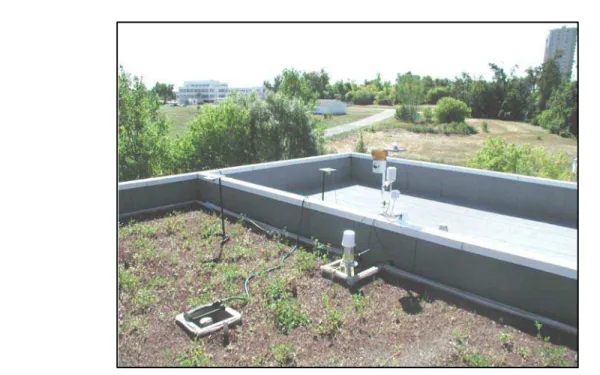
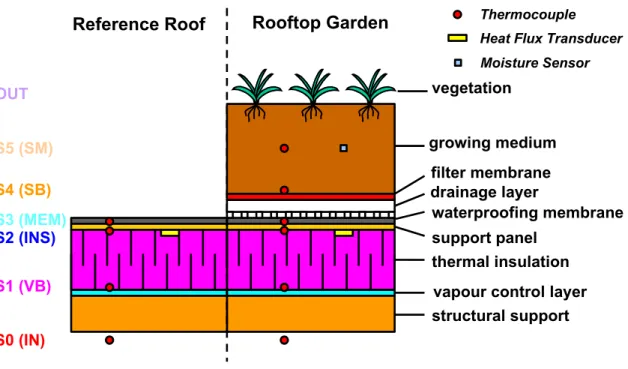
The performance of green roof infrastructure was studied by field monitoring of an experimental field site, the Field Roofing Facility (FRF), at the National Research Council (NRC) campus in Ottawa. The FRF consisted of two roof sections, a green roof and a modified bituminous roof that is representative of what is typically found on flat roofs in Canadian cities. The two roof sections were identical in principal components and differ only in the green roof components. The roofs were instrumented to measure temperature profile, heat flow, solar radiation and
stormwater runoff. The observations were also used to comment upon membrane durability. The thermal performance was also simulated with Visual DOE and a hydrology model was constructed to simulate stormwater retention.
The vertical gardens were tested on the roof of the Earth Science Building at the University of Toronto. The test consisted of comparing the surface temperature of the garden with the surface temperature of a vertical wall and comparing shaded with unshaded temperatures. The thermal performance of the garden was also tested using Visual DOE. AutoCad and LightScape were used to illustrate how one prototype might be adapted to a real building.
The green roof was found to reduce the summer cooling load and the surface temperature of the roof. The Green Roof delayed runoff, reduced the rate and volume of runoff. These results corresponded with the simulation models. The vertical gardens were also shown to reduce summer cooling load, even more dramatically than the green roof. Both technologies reduced surface temperatures sufficiently to suggest that significant reductions of the urban heat island would be attainable if these technologies were adopted on a widespread basis.
There are barriers to more widespread adoption of this technology in Canada. Two of these barriers, the lack of technical and evaluative information for Canada and the lack of awareness were directly addressed by the research in this report. This work was carried out by a partnership between Environment Canada,
specifically the Adaptation and Impacts Research Group, and the NRC, specifically the Institute for Research in Construction. The partnership also included several Canadian Roofing Associations, major roofing companies and the University of Toronto. This work was funded by the Science, Impacts and Adaptation Table of the Climate Change Action Fund, Environment Canada, the NRC and members of the Rooftop Garden Consortium at NRC.
Table of Contents
Page
Executive Summary i
Table of Contents iii
1 Introduction 1
2 Rational for Green Roof Infrastructure and Vertical Gardens 6
3 The Green Roof Hydrology Model 16
4 Observation of Green Roof Infrastructure 43
5 Vertical Gardens 74
6 Green Roofs, Vertical Gardens and Energy Consumption 84
7 Conclusions 87
8 References 100
1 Introduction
The majority of Canadians live in cities, and it is reasonable to assume that their first encounter with the impacts of climate change will occur in urban areas. In 1999, the Science, Impacts and Adaptation Table of the Climate Change Action Fund supported a study to evaluate the potential of adapting urban areas to climate change with rooftop and vertical gardens. The principle investigators in this project were Dr. Bas Baskaran of the Institute for Research in Construction (IRC) at the National Research Council (NRC) and Dr. Brad Bass of the Adaptation and Impacts Research Group (AIRG) within the Meteorological Service of Canada, which is a part of Environment Canada. The research also involved other
partnerships with members of the roofing industry and the Faculty of Engineering and the Institute of Environmental Studies at the University of Toronto. Both of the principal research groups were able to build on their experience in evaluating construction material performance under climate variability and the impacts of and adaptation strategies to climate change.
Canadian cities currently face a range of environmental problems; some of them connected to climate. Interviews with chief accounting officers and Heads of Public Works Departments in the Great Lakes Basin revealed that stormwater runoff, water quality and air quality were amongst the most important environmental issues of concern in urban areas. Each of these problem areas can be
ameliorated or exacerbated by variations in the climate. Too much precipitation increases stormwater runoff leading to combined sewer overflow (CSO).1 Higher temperatures can increase the rate of ozone formation, and in combination with heat stress can result in additional deaths or hospital admissions for respiratory problems.
Climate change is expected to result in the more frequent occurrence of extreme temperatures and precipitation events. These changes will heighten many ongoing environmental problems in Canada’s cities. Expected changes in precipitation frequency could lead to heavier albeit less frequent rainfall events leading to increased CSO events. The CSO events could exacerbate water quality problems particularly in combination with warmer temperatures and higher rates of
evaporation. Higher average temperatures may not be as problematic for air quality and heat stress as a higher frequency and intensity of heat waves that are projected in some scenarios.
1
Combined sewer overflow occurs because the stormwater drainage system does not exist or has limited capacity. Under heavy rain events, the excess stormwater is channeled through the sewage system. This rush of water can flush pollutants into a receiving body of water before they can be removed at a sewage treatment plant.
Urban areas tend to exacerbate these problems due to the replacement of vegetation with impervious surfaces relative to other land uses. Impermeable surfaces increase the flow of runoff during a storm event and contribute to CSO events. Replacing vegetation with typical urban surfaces also creates an urban heat island (UHI), an elevation of temperature relative to the surrounding rural or natural areas. The UHI occurs because more of the incoming solar radiation is absorbed by dark surfaces such as rooftops and pavement in the city and reradiated as longwave radiation or heat.
Below a certain temperature, the demand for electricity is inelastic. Above this threshold, every degree C increase can increase electricity consumption by 5%, increasing emissions of the fossil fuels required for its generation. Although the UHI may be as small as 2oC, that may be sufficient to move the temperatures above this threshold due the additional demand for air conditioning and requirements for refrigeration. The increased temperatures also increase the aforesaid problems associated with heat stress and the rate of ozone formation. Vegetation can reduce all of these impacts. It can reduce the stormwater peak by reducing the rate at which rainwater reaches the surface, and vegetated surfaces are highly permeable, which also reduces the amount of stormwater. Vegetation reduces the UHI because of evapotranspiration. Incoming solar energy that is used for evapotranspiration cannot be absorbed and reradiated as heat. Studies in Oregon demonstrated that non-vegetated areas could exceed temperatures of 50oC in July while vegetated areas remain at 25oC (Luvall and Holbo, 1989). Vegetation can also further alleviate air and water quality problems by filtering pollutants through the leaves or the roots. In addition, vegetation in urban areas has been shown to increase mental well being, biodiversity and residential property values.
Planting trees at ground level is the most common strategy for restoring vegetation. In addition to reducing the urban heat island and GHG emissions through reducing energy consumption, shade trees can further offset GHG emissions through the sequestration of carbon in their woody mass. However, higher land use densities or space restrictions in some parts of the city restrict the space required to allow trees to reach their full potential. In these cases, rooftop gardens or green roof infrastructure2 could provide many of the same benefits, and would take advantage of the unused roof space that is available in most urban areas. In addition,
2
Within industry, a shift to the term “green roof infrastructure” is occurring as it implies that putting vegetation on a roof involves more than just piling soil and planting seeds. There are multiple layers below the growing medium for drainage and protection from leakage and root penetration through the roof.
depending on its colour, the heat from bare rooftops can exacerbate the urban heat island (Terjung and O’Rourke, 1981a,b) and the associated air quality problems. Most discussions of the UHI focus on the temperatures of surfaces or the canopy level UHI, which occurs at the level at which most people live. We only feel
surface temperatures directly when in contact with these surfaces, but they heat up the surrounding atmosphere. For the canopy level, the primary affect is in the evening. Heat from rooftops affects the temperature of the boundary layer, the layer of the atmosphere extending roughly from rooftop level up to the level where the urban influence is no longer “felt” (Oke, 1976). This additional heating occurs throughout the day and influences the chemistry of air pollution and temperatures above the roof (see below). Nakamura and Oke (1988) found that temperatures in the urban canyon and temperatures in the lower part of the urban boundary layer, are usually very similar. Thus, higher temperatures above the roofs can affect temperatures at canopy level, and in areas with only one or two story buildings, the roofs may be at the canopy level.
Reducing the rooftop temperatures would further reduce the use of energy for space conditioning in both the summer and the winter. In the summer, a typical insulated, gravel-covered rooftop temperature can vary between 60oC and 80oC (Peck et al., 1999). These temperatures increase the cooling load on a building in two ways. Since the internal temperature underneath the roof is typically lower than the temperature above the roof, the heat will always flow through the roof into the building. In addition, modern high-rise buildings are constantly exchanging the internal and external air. Because of the high roof temperatures, the temperature of this external air that is brought into the building’s ventilation system may be warmer than the ambient air, requiring additional energy for cooling.
Evapotranspiration from rooftop vegetation could cool the roof, reducing the amount of heat flow into the building through the roof. The lower rooftop temperature would also reduce the temperature of the external air that is
exchanged with the building’s air. The temperature of this air could also be reduced if the rooftop garden is designed so as to shade the intake valves. Temperatures as low as 25oC have been observed (Peck et al., 1999). During the winter, the rooftop garden would provide additional insulation, which would reduce the flow of heat through the roof.
Green roofs are found throughout Europe. In the early 1960’s green roof technology was developed in Switzerland and enhanced in many countries,
particularly Germany. In the 1970’s, a significant amount of technical research was carried out on root repelling agents, waterproof membranes, drainage, and
lightweight growing media and plants. By the year 1996, 10 million square meters of roofs in Germany had been covered with gardens. In European countries such
as France, Germany and Austria, green roofs are viewed as an effective strategy for increasing green space in cities, reducing stormwater runoff and achieving other environmental benefits.
An even greater amount of space for vegetation may be available on the exterior walls of the buildings in urban areas, and growing vegetation on walls could create vertical gardens. Vertical gardens increase the amount of vegetative surface in urban areas, increasing evapotranspiration and evaporative cooling, and can be used for direct shading as well. Whereas green roofs directly affect the boundary layer UHI, vertical gardens can reduce the canopy level UHI. In areas that are suitable for trees, they can also to be used to cover windows that cannot be shaded by trees due to the height or specific design features of a building.
Vertical gardening is a comprehensive term referring to any manner in which plants can be grown on, up, or against the wall of a building such as a vine, as part of a window shade, as a balcony garden, or in a vertical hydroponic system. As a window shade, plants can be grown in a planter box installed below a window, or hanging plants can be suspended above a window and used as a part of an awning. To allow some natural light into the room, the vertical garden could be installed on a moveable louver, or installed as part of adjustable awning, so that it could be maneuvered to intercept only direct sunlight. Additional design
considerations are also required to cope with high wind speeds for plants and planter boxes located above eight stories.
At a workshop with stakeholders representing the roofing industry, architecture, landscape architecture, engineering and municipal government was held in November 1998 to identify barriers to widespread adoption of green roofs and vertical gardens. One barrier was the lack of information on performance within Canada. This research was developed with three specific objectives as a means to address that barrier. The three specific objectives were to:
• Assess the use of rooftop and vertical gardens as an adaptation strategy in urban areas.
• Assess the durability of the technology with respect to leakage and root penetration.
• Develop partnerships with roofing industry and Green Communities to promote the development and adoption of rooftop and vertical gardens.
The study was divided up into two major and additional minor components. The centrepiece was the construction of a green roof field site, the first of its kind in the world. This site consisted of a small house with a roof that could be reconfigured in a variety of different ways. For this study, half of the roof was built according to standard construction practices while a green roof was installed on the other half.
Both halves were instrumented in a similar manner to measure surface
temperature, surface radiation, vertical temperature profiles through the roof, heat flux through the roof and stormwater runoff.
The second major component was the construction of a green roof hydrology model for Canada, which included snow accumulation and melt in order to facilitate a climatic simulation. The model was written with a Windows visual interface so as to increase its utility to other users. Smaller components of the study included a simulation of the insulation and shading potential of green roofs and vertical gardens and a comparison of temperatures between vertical gardens and other urban surfaces in order to assess the potential for reducing the urban heat island.
2 Rational for Green Roof Infrastructure and Vertical Gardens
Page
2.1 Climate Change Impacts 7
2.2 Vegetation and the Energy Balance in Urban Areas 8
2.3 Reducing the Urban Heat Island: An Analytical Approach
How Green Roof Infrastructure and Vertical Gardens Reduce the Urban Heat Island
10
2.4 Stormwater Management
How Green Roof Infrastructure Reduces Stormwater Runoff
2.1 Climate Change Impacts
By 2005, 50% of the world’s population will live in cities (Bindé, 1998), and in the industrialized world, the figure has already surpassed 80%. The growth in urban populations has and will continue to create a unique set of environmental
problems, both within cities and in the surrounding areas, due to the large
demands for food, energy and water. Many of these problems are either directly caused or exacerbated by the removal of vegetation to accommodate urban expansion. It is expected that many of these problems will be further exacerbated by climate change, particularly climate change impacts that exacerbate heatwaves and the associated health problems, rapid temperature changes, stormwater runoff, water quality, biodiversity and food security.
Specific climate change impacts in the Great Lakes-St. Lawrence Basin include a net decrease of 46% in basin water supply in the (Mortsch and Quinn, 1996), adverse impacts on unmanaged and managed (e.g. agriculture) ecosystems (Mortsch and Quinn, 1996), an increase in heat-related mortality in Toronto (Chiotti et al., 2002b) and the potential for the re-emergence of malaria (Chiotti et al., 2002b). Some of the findings in the water sector are contradictory: climate change will exacerbate existing problems (Dore and Burton, 2001) or the distribution of water or wastewater treatment are not sensitive and will not be affected by drought (Moraru et al., 1999). While studies of the energy sector (Chiotti et al., 2002a) or the health sector (Chiotti et al., 2002b) demonstrate the relevance of climate change and variability to urban centres, these are preliminary assessments, and part of longer-term projects.
The investment required to cope with climate change should not be minimized. For example, the funding of urban drainage infrastructure is in the order of billions of dollars and annual maintenance is in the order of hundreds of millions of dollars. One important aspect of maintenance is the detection, repair and reduction of leaks as leakage accounts for 10-30% of municipal water supplies (Bruce et al., 2000). Increased occurrences of CSO could put a bigger strain on this
infrastructure, partly because the investment in water treatment infrastructure in Ontario’s municipalities has been about half the required level during the past 20 years (Fortin and Mitchell, 1990).
Heatwaves, extreme snowfalls, new diseases and water shortages to some extent are already emerging in the Grea Lakes-St. Lawrence basin. Although more
people die from cold stress than heat stress in Canada, heat related mortality might become a more frequent part of Ontario’s future due to warmer temperatures, and is already a larger problem than cold stress in the City of Toronto. Heatwaves also exacerbate air quality problems by accelerating the formation of smog and
refrigeration. Toronto has already developed a heat-health alert system, and
hospitals will need their own contingency plans to deal with the expected increased frequency of heat waves. This section discusses the benefits of urban vegetation, presents an analysis of the radiation balance and the impact of green roofs and vertical gardens and reviews previous work on stormwater management.
2.2 Vegetation and the Energy Balance in Urban Areas
Viewed from the air or from space, with an infrared sensor, the heat signature of a city would be much closer to a rock quarry than a forest. This is significant as summer temperatures in a quarry can reach 50oC while the forest canopy remains at 25oC (Luvall and Holbo, 1989). Vegetation accounts for the temperature
difference because it makes moisture available for evapotranspiration, the
combination of evaporation of water from plant tissue and the evaporation of water from the soil. Evapotranspiration utilizes a significant amount of incoming solar energy cooling both the leaf surface as well as the air. The energy used for evapotranspiration is embodied in the water vapour, which prevents it from being converted into heat at the surface.
A lower fraction of vegetative cover in the city reduces the available moisture to direct incoming solar radiation towards evapotranspiration. The non-vegetated surfaces absorb the incoming solar radiation and reradiate it as heat. This heat artificially elevates urban temperatures, a phenomenon known as the urban heat island (Sailor, 1998). The higher temperatures increase the demand for air conditioning which pumps more waste heat into the environment, increasing the heat island. Air conditioning requires electricity that is often generated by the burning of fossil fuels leading to increased greenhouse gas (GHG) emissions. Yet, without air conditioning, the higher temperatures will increase the incidents of morbidity and mortality due to heat stress (Kalkstein and Smoyer, 1993). The evapotranspiration and the associated reduction in surface temperatures indicates that exergy is being used or stored. Exergy is a measure of the quality of the energy, or the amount of energy that is available to do work. Higher amounts of stored exergy are associated with higher levels of ecological integrity (Schneider and Kay, 1994) and higher levels of biodiversity (Bass et al., 1998). Schneider and Kay (1994) proposed that ecosystems develop so as to utilize exergy more
effectively. The higher surface temperatures of clear-cut areas, rock quarries and other non-vegetated areas do not utilize exergy as indicated by their higher surface temperatures. Non-vegetated landscapes also only sustain a much lower diversity of life, and raise questions as to whether non-vegetated areas, such as the rock quarry and the clear-cut are appropriate models for urban areas and urban sustainability.
There are other environmental problems associated with the urban heat island and the lack of vegetation in a city. Higher temperatures are associated with increasing severe episodes of ground-level ozone or smog. With increased use of air
conditioning comes the increased risk of releasing additional chlorofluorocarbons into the atmosphere, chemical compounds that are responsible for the reduction of the stratospheric ozone that is necessary to protect us from harmful amounts of ultra-violet radiation. The combustion of fossil fuels to generate electricity contributes other pollutants into the atmosphere, such as sulfur dioxide, nitrous oxides and particulate matter, which have been linked to respiratory health problems.
If vegetation is situated so as to cover building surfaces then evaporative cooling can reduce the need for air conditioning by reducing the air temperature
immediately adjacent to the building. Artificial evaporative cooling systems have been shown to reduce air conditioning by 20-25% (Abernathy, 1988). Vegetation can further reduce the use of air conditioning through shading and insulating a surface. In previous tests, it has been estimated that shading from trees might reduce energy usage from 20 – 30% (McPherson et al, 1989, Hunn et al., 1993, Akbari et al., 1997). In cold-winter climates, wind decreases energy efficiency by 50%. A row of trees, planted fairly close to a wall improves energy efficiency by reducing contact between wind and the building surface (Minke and Witter, 1982). Vegetation will reduce energy emissions through reductions in the urban heat island, through shading windows from direct sunlight and through insulation from in both the winter and summer. Reducing energy usage directly on a particular building will reduce emissions of many pollutants into the atmosphere, but the indirect effect of reducing the urban heat island will also have an impact on urban air quality. For example, in Southern California, simulation models have suggested that reducing the urban heat by 2oC would be equivalent to converting half of the motor vehicles to zero-emission electric engines (Taha et al., 1997). A significant reduction in the urban heat island could be achieved in the Los Angeles basin with a 1% increase in vegetation (Sailor, 1995).
Light-coloured surfaces can also reduce the temperature of urban surfaces by reflecting a high percentage of the incoming solar energy so that it is not absorbed and reradiated as heat. However, it is not clear that the potential reductions in the urban heat island are as large as the reductions that could be achieved with vegetation. Reductions in cooling load will probably be greater with green roofs due to the additional shading from the vegetation and extra insulation provided by the growing medium. In addition, the material used to create the light surfaces fades and must be replaced every two to five years, depending on the product. The use of light-coloured surfaces will also not address the other environmental problems that have arisen due to the removal, or are exacerbated by the absence,
of vegetation, such as water pollution, lack of habitat for wildlife and stormwater runoff. From a thermodynamic perspective, although the surface temperatures of light-coloured surfaces are relatively lower than is typical for urban areas, these surfaces are not utilizing exergy, and thus are closer to the rock quarry in some respects, than to the forests.
Green roof infrastructure can reduce a building’s energy demand on space conditioning through direct shading, evaporative cooling from the plants and the soil, and additional insulation values from both the plants and the growing medium. A 20cm (8in.) layer of growing medium or substrate plus a 20-40cm (8-16in.) layer of thick grass has a combined insulation value equivalent to 15cm (6in.) of mineral wool insulation (RSI 0.14; R 20) (Minke, 1982). Under a green roof, indoor
temperatures (without cooling) were found to be at least 3-4°C (5-7°F) lower than hot outdoor temperatures between 25-30°C (77-86°F) (Liesecke, 1989).
Temperature measurements on a 75mm (3in.) green roof at the Fencing Academy of Philadelphia showed that while the bare roof reached 32°C (90°F), the
temperature underneath the planting media on the green roof was no higher than 16°C (61°F) (EBN, 2001). A study by Oak Ridge National Laboratory showed that a vegetated roof of 0.46-0.76m (1.5-2.5ft.) of soil reduced the peak sensible
cooling needs of a building by about 25% (Christian, 1996). In addition, the green roof did not have a cooling penalty like commercial buildings with high roof
insulation levels. A computer simulation of green roofs indicated that they could improve the thermal performance of a building by blocking solar radiation and reducing daily temperature variations and annual thermal fluctuations
(Eumorfopoulou, 1998) or by reducing heat flux through the roof (Palomo Del Barrio, 1998).
2.3 Reducing the Urban Heat Island: An Analytical Approach How Green Roofs and Vertical Gardens Reduce the Urban Heat Island Surface temperature is considered to be a primary indicator of the urban heat island. Assessing the surface temperature and the reduction in the urban heat island requires sophisticated models of the atmosphere and the land surface. However, the contribution of any surface to the urban heat island and the
reductions in surface temperature can be estimated from the radiation balance on the roof and the wall (Brown and Gillespie, 1995). The important components are the incoming solar radiation (Rs) and surface reflectance of Rs, called albedo and
What produces heat is the longwave or infrared radiation that is reradiated from a surface after it has absorbed the incoming solar radiation. Longwave radiation is also produced in the atmosphere and re-radiated to the surface (L↓). The total radiation absorbed (Rabs) by a surface without vegetation or moisture is computed
as below:
Rabs = (1 - α) Rs + L↓ [2.1]
Assuming a dark surface with an albedo of 0.3, a typical July Rs of 600 Wm-2, the
downward longwave radiation is 300 Wm-2 at 15oC (Brown and Gillespie, 1995). Rabs = (1 - 0.3) 600 + 300 [2.2]
Rabs = 720 Wm-2 [2.3]
The surface temperature, T(oC) can be computed with the formula relating energy to temperature developed by Stefan and Boltzmann.
Energy (Wm-2) = (5.67 x 10⁻⁸) x (T + 273)4 [2.4] The value of 5.67 x 10⁻⁸ is the Stefan-Boltzmann constant, which relates the radiance of a black body to temperature, and is symbolized by the Greek letter σ. T + 273 changes degrees Celsius to degrees Kelvin or K. Thus the Equation [2.4] could be rewritten as
E (Wm-2) = σ x (ToK)4 [2.5] or
Rabs = σ x (ToK)4 [2.6]
Rearranging Equation [2.6] provides a value for surface temperature. T(oC) = (Rabs/σ)1/4 - 273 [2.7]
and in this case,
This estimate in Equation [2.8] corresponds with the previously reported observations.
If vegetation was affixed to the surface, evapotranspiration could reduce the absorbed energy by as much as one-half. Using a more conservative estimate for Rabs, of 420 Wm-2 in Equation [2.7], results in a temperature closer to 20oC. This
estimate is close to the 25oC reported in the literature, and the lower value is
probably due to the value suggested for L↓ in Equation [2.1] (Brown and Gillespie, 1995). To estimate the temperature of a wall, and the impact of vertical gardens, it is necessary to reduce the incoming solar radiation, Rs in Equation [1]. Although a
precise estimate can be derived based on the use of sine functions, a rule-of-thumb estimate equates six hours of sunshine on a roof to 2.5 hours on a wall which reduces Rs to 250 Wm-2. This produces a surface temperature of 29oC in
Equation [2.7], and the corresponding decrease in surface temperature, with a vertical garden, can be derived by reducing Rabs accordingly.
Previous observations indicate that vertical gardens do reduce the heat flow into the building, and their surface temperature is lower than a bare wall, which is necessary to reduce the urban heat island. A series of experiments in Japan suggested that vines could reduce the temperature of a veranda with a
southwestern exposure (Hoyano, 1988). Vines were effective at reducing the surface temperature of a wall. In Germany, the vertical garden surface
temperature was 10oC cooler than a bare wall when observed at 1:30 PM in September (Wilmers, 1988).
A series of observations were collected in South Africa on English ivy, Boston ivy, Virginia creeper and grape vines (Holm, 1989). All the vines were grown at a cover depth of 200 mm to emulate the thermal improvement to a typical South African house. The plants were installed over steel sheets that were compared to black and white panels. Temperatures collected behind all panels were less than the outdoor temperature, but the largest reduction of 2.6oC was behind the vegetated panel. For a building consisting of two 10mm fiber-cement sheets with 38mm of fiberglass insulation, a computer simulation estimated that a vertical garden reduced summer daytime temperatures on the surface by 5oC. These results are not as dramatic as the cooling effect on a horizontal surface, such as a roof, but given the amount of wall space in urban areas, the potential impact of vertical gardening is expected to be quite dramatic.
2.4 Stormwater Management
How Green Roofs Can Reduce Stormwater Runoff
A large component of urban water resource management is moving rainwater and snowmelt away from buildings and roads as fast as possible. The replacement of vegetation by hard surfaces in urban areas has significant impacts on water quantity. Since large parts of the city are now impermeable to water, it has to be diverted through artificial systems, taxing the capacity of the sewage system, or it runs off over the surface. Stormwater runoff has contributed to problems in water quantity and quality and during extreme precipitation events, it can lead to flooding and erosion. Urban runoff can also contain high levels of heavy metals and
nutrients. Stormwater can be managed through storage, infiltration and retention. Alternatives to hard infrastructure include downspout disconnection, rain barrels, cisterns, swales adjacent to parking lots, retention ponds, artificial wetlands and living machines, and the use of porous materials for roads, driveways and parking lots as well as urban forestry, rooftop gardens and vertical gardens.
Additional tree cover has reduced urban stormwater runoff by 4-18% (Sanders, 1986) and the pollutants end up being bound in the substrate of vegetation instead of being discharged into the environment. On a rooftop garden, rainwater is stored in the substrate and used by the plants or returned to the atmosphere by
evapotranspiration. Observations carried out in Berlin indicate that a substrate depth of 20-40 cm can hold 10 – 15 cm of water, translating into runoff levels that were 25% below normal (Minke and Witter, 1982). Studies in Berlin showed that rooftop gardens absorb 75% of precipitation that falls on them, which translates into an immediate discharge reduction to 25% of normal levels (Stifter, 1997). Generally, summer retention rates vary between 70-100% and winter retention between 40-50%, depending on the rooftop garden design and the weather conditions. A grass covered roof with a 200-400mm (8-16in.) layer of substrate can hold between 100-150mm (4-6in.) of water (Minke, 1982).
Excess water is stored in a drainage layer, and will enter the municipal drainage system, but at a much slower rate and lags the peak flow of runoff, thus helping to reduce the frequency of CSO events, which is a significant problem for many major cities in North America. In Portland, Oregon a rooftop garden with a 7-cm
vegetation layer produced no runoff during a three-month summer period although the retention was not as high during a continuous heavy rainfall. A mixed layer of sedum and grass on 51mm (2in.) of soil on the roof of his garage could retain up to 90% of rainfall, and it became less effective only during continuous and heavy rainfall (Thompson, 1998). Preliminary results from Portland, Oregon also
summer rain event (when the soil started out fairly dry) before water started to runoff (EBN, 2001). This stormwater retention potential of rooftop gardens has led to a bonus density incentive programs in Portland for developers who install a green roof.
Similar statistics do not exist for vertical gardens, but it would vary by design. A vine-covered wall would delay the runoff or allow a slow infiltration into a
permeable ground cover. It will be most effective when rain is accompanied by strong winds, and is blown into the wall of a building. A window shade design that involves plants in soil, or another substrate, would have similar benefits to a rooftop garden in that water could be stored in the soil, used by the plants and returned to the atmosphere by evapotranspiration. A hydroponic system might also be
designed to capture stormwater.
Rooftop gardens can significantly reduce the cost of retaining stormwater in
underground tanks and tunnels (Peck et al., 1999). A rooftop garden composed of sedums and 8 cm of substrate costs $110.00 Cdn / m2, or $11.00 Cdn / m2 over 10 years and can retain 3 – 4 cm of rainwater. The approximate cost of the roof membrane with a root repellant layer is $55.00 Cdn / m2, or $5.50 Cdn / m2 over 10 years. In Toronto, the average annual precipitation translates into 80 cm per square metre of roof area or 0.8 m3 of water. The approximate cost of an
underground stormwater storage tank in Toronto is $500.00 – 1000.00 Cdn per m3. The City of Toronto has built a new storage tunnel with a capacity of 85,000 m3. The tunnel is designed to handle 20 million m3 of water from April through October, which represents 25 million m2 of surface area, mostly in the form of roads and parking lots. The approximate cost of the tunnel is $50 million Canadian, $588.00 / m3, or $58.80 / m3 per annum over 10 years.
Assuming a retention rate of 85%, over a 10 year period it costs $16.50 Cdn per annum to retain 0.68 m3 of stormwater or $24.26 Cdn / m3 in a rooftop garden. There are more than 334 million m2 of roof area in the City of Toronto and 2.4 million m2 of new roof area will be added over the next ten years. Although not all of this roof space is adequate to support vegetation, and not all of it will have an impact, the amount of available roof space is more than adequate. In addition, the amount of space available for vertical gardens is even larger.
Vertical and rooftop gardens can also be used to improve water quality. Heavy metals such as cadmium, copper, lead and zinc can be bound in the substrate, as much as 95% of (Johnston and Newton, 1996). In Europe both rooftop gardens (Thompson, 1998) and vertical gardens (Johnson and Newton, 1996) are being designed to treat wastewater that would normally be discharged as raw sewage. In addition to delaying and reducing runoff, rooftop gardens can improve the quality of the runoff. Vegetated surfaces can act as natural filters for any of the water that
happens to runoff it (North American Wetland Engineering, 1998). Forster (1993) found that the water quality of roof runoff ranged from relatively clean to severely polluted depending on the roof, its location and the particular rain event. Runoff samples obtained from an experimental roof system in Germany indicated the main sources of roof runoff pollution came from local sources (e.g. PAH from heating systems), dissolution of the metal components on the roof and background air pollution (Forster, 1999). Metals such as cadmium, copper, lead and zinc were taken out of rainwater by rooftop gardens (Johnson, 1996).
3 The Green Roof Hydrology Model
Page
3.1 Introduction 17
3.2 The Green Roof Hydrology Model 17
3.2.1 Modelling Approach 17
3.2.2 Components of the Model 19
3.2.3 Snowmelt 20
3.2.4 Water Release and Runoff from Snowmelt 21
3.2.5 Snowmelt Calculation 22
3.2.6 Snow Melt Infiltration Modelling 23
3.2.7 Rainfall-Runoff Modelling 25
3.2.8 Interception Model 25
3.2.9 Evapotranspiration Model 28
3.2.10 Infiltration Modelling 31
3.3 Programming Progress-Interface Development 39
3.4 Calibration and Validation 39
3.5 Stormwater Runoff Simulation 39
3.1 Introduction
A simulation model of a green roof was developed in order to assess the potential reductions of stormwater runoff from different buildings, in different cities across a range of climates. As a green roof is a special type of catchment in terms of soil type, depth and vegetation, the model was based on the simulation of major hydrological processes. The research was designed so as to use observations from a field roofing facility to calibrate the model, and then use the other data to validate the model’s performance. Due to the delays in constructing the field roofing facility, stormwater runoff data were not available. Instead, various components of the model were tested individually with other data sets. The model was developed primarily as a research tool. Beyond this specific research, it is hoped this model could be used for future research and for
educational purposes. However, the philosophy from the start has been to build it using a visual programming language so that it could provide the basis for a tool that could be used by other stakeholders to assess the capacity of any particular green roof design. In addition, the evapotranspiration component of the model will hopefully be used to estimate the impact of evaporative cooling on the summer energy consumption for cooling, which is missing from all available energy models.
3.2 The Green Roof Hydrology Model 3.2.1 Modelling Approach
Various approaches are available for simulating precipitation and runoff processes. These software range from the simple water balance to more complicated
processes based on distributed hydrologic models. They cover hydrologic processes involving vegetation and single to multi-layer soil processes. In a hydrological simulation, each of these models has advantages and disadvantages over the others with regard to data requirements, computing time and resources. Application of any particular model empirical, water balance, conceptual-lumped and physically based models often depends on the specific objectives of the exercise, the need for analytical, future scenario and geographic flexibility and the requirements for precision in the estimates. The choice of models in this research was highly dependent on the need for future flexibility in terms of climate scenarios and geographic region, the differing needs of various stakeholders and the nature of a green roof.
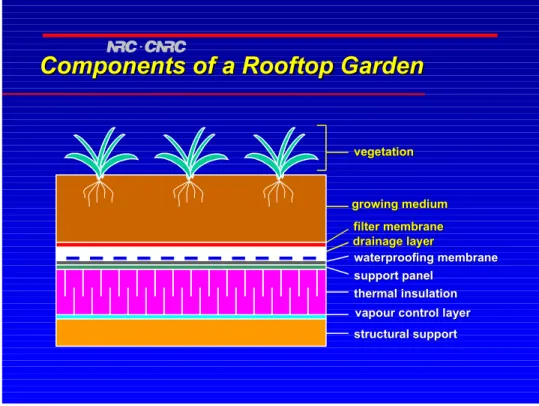
Compared to a natural catchment, a green roof (Figure 3.1) has three distinct differences. First, the vertical dimension of the soil profile will be different from that of the natural catchment. In most cases, it will be a mixture of a lightweight growing medium and synthetic components to prevent leakage and root
penetration through the roof. Second, the diversity of vegetation in the most common green roof is restricted to various grasses, wild flowers or vegetation that grows well in shallow soils under a range of moisture conditions. Third, some physical processes involved in lateral runoff generation (such as interflow and baseflow) are not as important as they are in larger catchments and are excluded for simplicity, although they could be added at a later time.
structural support
structural support
vapour control layer
vapour control layer
thermal insulation thermal insulation support panel support panel waterproofing membrane waterproofing membrane drainage layer drainage layer filter membrane filter membrane growing medium growing medium vegetation vegetation
Components of a Rooftop Garden
Components of a Rooftop Garden
Figure 3.1: Structure of the rooftop garden in the pilot study site in Ottawa
Vertical and horizontal processes have been incorporated in the model. The vertical processes of water movement include interception, storage, evaporation, infiltration, soil-moisture storage, evapotranspiration, percolation or drainage, snowpack accumulation and melt. The horizontal processes only include surface
runoff. Components of the vertical and lateral processes are integrated during the simulation run.
3.2.2 Components of the Model
The model has two major components: a snow component (Figure 3.2) and a rainfall-runoff component (Figure 3.3). The model is divided into two major
components because the model is intended for simulating summer runoff, but the winter is required to run multi-year simulations in northern latitudes. However, there are different hydrological processes during winter and summer. These two components are linked in that the summer model receives its initial moisture content from the winter snow model. The two components can be run as stand-alone models to allow the summer model to be used in areas that only experience rainfall. In that case the model will require initial moisture content in the spring.
Percolation
Rain Soil Moisture Runoff Infiltration Available Water on Land Surface Snow + Snowmelt Snow PackThe snow model runs on a daily time-step, and an hourly time-step is used in the summer model. The daily time step for winter is suitable as runoff from snow can involve major storage followed by relatively rapid release, and snow can
accumulate over long periods. Release in liquid form depends on the energy available to melt snow, not on the initial precipitation rate. Compared to water that is stored in soil, much of this runoff is shielded from high rates of
evapotranspiration as it passes quickly from its frozen state to runoff.
3.2.3 Snowmelt
Runoff from snow requires three conditions. First, snow must warm enough to melt. Second, snow must become wet enough to allow liquid water to drain. At this stage, the snow is said to be “ripe”. Third, soil or surface conditions must allow runoff to occur. The first phase involves the snow’s energy balance. Before
melting can start, snow must reach a temperature of 0oC (32oF). The amount of energy needed to bring the snowpack up to 0oC is referred to as its “cold content”, the difference between the snowpack temperature and (0oC) is its “temperature deficit”. The cold content can be estimated from the amount of snow present (snow water equivalent as mass per area) and its temperature.
Once the temperature of the snowpack has reached 0oC, the transformation from solid ice to liquid water requires a large addition of energy, 0.3337 MJ per kilogram or 80 calories per gram (the latent heat of fusion for water). Even with a very cold snowpack, much more energy is required to melt the snow than to raise its
temperature to 0oC. When heat is transferred evenly, a snowpack will reach 0oC throughout its depth before it melts. It is then said to be “isothermal” at 0oC. Because snow transfers heat relatively slowly, especially at low densities, it is some times possible to have melt at the top or bottom of the pack when other parts are still below 0oC.
Energy to melt snow can come from several sources: direct solar radiation, energy re-radiated from vegetation, clouds, and other surfaces (longwave radiation) or heat transferred from air, ground, rain or the condensation of water vapour. The relative importance of different energy sources depends on the time of year, the physical setting, vegetation and other cover, weather, and other factors. Seasonal snowmelt associated with spring warming typically reflects increases in solar radiation, re-radiated energy, and heat transferred from warm air. As the
snowpack ages and picks up dust and other particles, it reflects less solar radiation and absorbs more energy, adding to the tendency to warm and melt.
Heat transfer from air can be particularly important during periods with sustained, warm winds. When warm, moist air encounters snow, significant energy can be
released by the condensation of water vapour. Rain falling on snow can transfer heat to the extent that its temperature is above freezing. Warm, moist air often accompanies rain; during rainy periods, condensation is likely a more important energy source for snowmelt than the rain itself.
Heat conducted from the ground is a relatively minor source of energy, but in autumn it can be important for melting early-season snows. In winter, ground heat may maintain low rates of soil water and ground water recharge. Accumulated over the entire season, this can be significant and may help maintain baseflow in streams.
The amount and type of vegetation strongly influence energy inputs to snow, but the effects can be complex and counter-intuitive. Consider solar radiation gain and longwave radiation gain and loss. With no trees, snow in open areas receives the most direct solar radiation but the least longwave radiation. Snow in areas with high forest cover gains little energy from direct solar radiation, but this loss is compensated by increased longwave radiation from trees.
Energy gain by snow in areas with sparse to intermediate forest cover depends on the degree of shading and amount of energy re-radiated from trees, both of which depend on forest canopy density and form and sun angle. Forest density also affects the transfer of energy by wind. Dense canopies shield snowpack from the wind. In relatively open stands, the presence of some trees may increase
turbulence and enhance heat transfer. The net effects of forest cover on snowmelt are debated, but removal of trees by fire or timber harvest generally seems to accelerate melt. Because snow interception decreases and snow accumulation increases, up to a point, with removal of trees, total runoff from snowmelt often increases as well.
The effects of shorter vegetation stands on snowmelt are probably much less than those for forests, but they have received less attention outside of crop and
rangelands. These effects probably reflect differences in snow accumulation, though differences in plant water use also affect soil and groundwater recharge. 3.2.4 Water Release and Runoff from Snowmelt
Snow is a porous medium. Like soil, it retains some liquid water in its pores before water drains under the force of gravity. Pursuing this analogy, just as a soil has a field capacity, a snowpack has a “holding capacity”. The liquid-water-holding capacity depends on snowpack density and structure but is generally low (<5% by volume); in a deep snowpack the available storage must be filled before melt water is released. A snowpack that has warmed to 0oC and is at its liquid-water-holding capacity is said to be “ripe”. Any additional melting will release water.
Under some circumstances, sometimes dramatic, runoff over snow can occur. Rain falling on snow may not infiltrate if a low-permeability crust has formed at the surface and if the rainfall rate is high. Snowmelt runoff generated in one part of a landscape may flow over crusty snow or frozen soil that is further downslope. However, the insulating affects of snow allow soils to remain unfrozen if enough snow is deposited early in the cold season, and snow cover remains throughout the winter. Soil is most likely to freeze if snow cover is absent, very thin, or intermittent.
3.2.5 Snowmelt Calculation (i) Rain-free condition
Empirical Equation: M = Mf (Ti – Tb)
Where
M = snow-melt in mm
Mf = snow-melt factor (3.66-5.7 for the Southern Ontario)
(Gray and Prowse, 1992) Ti = index temperature
Tb = base temperature (set as 0oC).
(ii) During Rain
For a rain event, the melt factor is modified as follows: Mf = (0.74 + 0.007P) (Ti – Tb)
Where P = precipitation (in mm). Snowmelt is calculated by:
M = Mf (Ti – Tb).
(iii) Cold Content Calculation
Cold content is the energy required, measured in depth of precipitation, to raise the temperature of the snowpack to 0oC:
Where
SWE = snow water equivalent (cm)
Ts = temperature deficit of the snowpack (oC) Wc = cold content.
(iv) Calculation of Retention Storage
Retention storage is the total amount of melt or rain that must be added to a snowpack before liquid water is released:
Sr = Wc + f(SWE + Wc)
Where
Sr = retention storage in cm
f = hygroscopic and capillary force (g/g). 3.2.6 Snow Melt Infiltration Modelling
Infiltration to frozen soils involves the complex phenomenon of coupled heat and mass transfer through porous media; therefore, the process is affected by many factors. The most important include the hydrological, physical and thermal properties of the soil, the soil moisture and temperature regimes, the rate of release of water from snow cover, and the energy content of the infiltrating water (Granger et el., 1984). In the absence of major structural deformations in a profile, e.g., cracks or other macropores, the major physical property of a frozen soil governing its ability to absorb and transmit water is its moisture content. This arises because of the reduction to the hydraulic conductivity caused by the constriction or blockage of the flow of water by ice-filled pores and the effects of these pores on the tortuosity and lengthening of the flow paths and the distribution and continuity of the air-filled pores. The existence of an inverse relationship between infiltration and frozen soil moisture has been demonstrated or postulated by many investigators (Motovilov, 1979; Granger and Dyck, 1980; Kane, 1980). Following Popov’s concerns with long-range forecasting of spring runoff for lowland rivers in the former Soviet Union (Popov, 1972), Gray et al.(1985) grouped
Restricted: An ice lens on the surface or at shallow depth impedes infiltration. The
amount of meltwater infiltrating the soil is negligible, and most of the snow water goes directly to runoff and evaporation.
Limited: Infiltration is governed primarily by the snow cover water equivalent and
frozen water content of the 0 to 300 mm soil layer.
Unlimited: Soils containing many large, air-filled macropores, allowing for the
infiltration of most or all of the meltwater.
When evaporation and storage losses are neglected, the runoff coefficients to be assigned to soils whose infiltration potentials are defined as “restricted” or
“unlimited” in a practical modelling scheme would be 1.0 or 0, respectively. Thus, the problem remaining is one of defining the relationship between infiltration, snow-cover water equivalent, and frozen soil moisture content for the limited case. Following Granger et al. (1984) the following four equations have been incorporated in the snow model to estimate infiltration where SWE>INF.
562 . 0 ) ( * 222 . 3 SWE INF = (1) [θp: 0.30-0.45] 586 . 0 ) ( * 210 . 2 SWE INF = (2) [θp: 0.45-0.55] 548 . 0 ) ( * 034 . 2 SWE INF = (3) [θp: 0.55-0.65] 603 . 0 ) ( * 477 . 1 SWE INF = (4) [θp: 0.65-0.75] Where
3.2.7 Rainfall-Runoff Modelling
The major processes involved in the rainfall-runoff modelling are evaporation and evapotranspiration, interception, runoff, infiltration and percolation (Figure 3.3).
Evapotranspiration Evaporation Percolatio Soil Runoff Infiltration Available Water onLand Rain Interception
Figure 3.3: Rainfall-runoff process
3.2.8 Interception Model
Interception is that portion of the precipitation falling in a watershed that is intercepted by vegetal cover and other aboveground objects (Singh, 1989).
Interception covers a variety of processes that result from the temporary storage of precipitation by vegetation or other surface cover. Part of the intercepted
precipitation moistens and adheres to these objects and then returns to the atmosphere through evaporation. The interception process that has been incorporated in the model is shown in Figure 3.4.
of capacity Rain = P Throughfall Precipitation excess P *(1- Dc) ∆Si Evapotranspiration P * Dc Canopy Density = Interception storage capacity =Si (max)
Figure 3.4: The interception process as incorporated in the model
∆Si = (P * Dc) –Ein
Where
∆Si = change in interception storage per unit area of canopy, when current
interception storage is less maximum storage capacity P = Rainfall per unit area of catchment
Dc = canopy density-area of canopy per unit area of catchment
Throughfall in excess of interception storage capacity is estimated by: Tin = (Sin(t−1) +∆Si(t) −Smax
∆Si = (P * Dc) – Ein
∆Si = change in interception storage (mm)
P = Rainfall per unit area of catchment
Dc = canopy density-area of canopy per unit area of catchment
Ein = evapotranspiration from the interception storage /unit area (mm)
Sin (t-1) = interception storage at time (t-1)
∆Si(t) = increment to interception storage at time t
Smax = maximum interception storage capacity
The window from the interception model is shown in Figure 3.5. It requires two parameters, the canopy density and the interception storage capacity, which may be similar to turf or grasslands for the standard green roof technology but would change with different uses such as food production and other types of landscapes. Explain where these are found, provide default values, etc, i.e. what does the user need to know.
Figure 3.5: Interception Module of the Model
3.2.9 Evapotranspiration Model
(i) Evaporation and Evapotranspiration
Evapotranspiration (ET) is the sum of the volume of water used by vegetation (transpiration) and that evaporated from soil and intercepted precipitation on the surface of the vegetation. In addition to the affect of climate variability on free-water surface evaporation, evapotranspiration is also governed by other soil and vegetative factors (Kristensen and Jansen, 1975).
If the soil water is not limiting, then evaporation from saturated soils is
approximately equal to evapotranspiration from a free water surface and is called potential evaporation (PE). When soil water is limited, evaporation is known to occur in several stages and is controlled first by climatic factors and then by soil characteristics; it is called actual evaporation (AE). Likewise, if water is not a
limitation and the area is completely shaded by vegetation, then ET occurs at potential rate. Some professionals regard PE and Potential ET as synonymous, although in some practical water-management situations, it may be desirable to differentiate them (Wright, 1982). Penman (1956) defined potential ET as the amount of water transpired at night by a short green crop, completely shading the ground, of uniform height, and never short of water.
Various models are available for estimating potential evapotranspiration. Among them, Penman (1948), Thornthwaite (1948), Peman-Monteith (1964) and Priestley-Taylor (1972) are important and have received a great deal of attention in the literature. The green roof hydrology model uses the Priestley-Taylor Model due to its simplicity and less onerous data requirements.
(ii) Priestley-Taylor Method
If net radiation data are available, then the following simple equation (Priestley and Taylor, 1972) can be used:
E = ( )*( ) Hv Rn γ α + ∆ ∆ (1) E = potential evapotranspiration (mm)
α =1.3 is a constant (Maidment et al., 1988) (may slightly vary from site to site)
∆ = slope of the saturated vapour pressure curve (kPaC-1)
γ = psychrometric Constant (kPaC-1)
Rn = net radiation (MJm-2)
G = soil heat flux (MJm-2)
HV = latent heat of vapourization (MJKg-1)
HV = 2.5 - 0.0022 * T (2)
e(a) = 0.1 * exp(54.88 - 5.03 * ln(T + 273) - 6791 / (T + 273)) (3)
∆ = (e(a) / (T + 273)) * (6791 / (T + 273) -5.03) (4)
γ = 6.6*10-4 * PB (5)
PB = 101 - 0.0115 * ELEV + 5.44e10-7 * (ELEV)2 (6)
ELEV =elevation (m)
G = 0.12 * (T(i) - (T(i-1) + T(i-2) + T(i-3)) / 3) (7)
G is assumed to be zero
The window from the evapotranspiration component (Figure 3.6) also allows the user to select the Penman and Penman-Monteith algorithms depending on data availability or preference.
3.2.10 Infiltration Modelling
(i) Horton equation with soil-moisture accounting
Horton (1933) proposed the exponential decay equation to model the infiltration of water into the soil:
f(t) = fc +(fo-fc)exp(-kt)
in which
f(t) = infiltration rate at any time t fo = initial infiltration rate
fc = final infiltration rate
k = exponential decay coefficient.
However, the reduction of the infiltration rate during a storm event may be viewed as reflecting not merely the passage of time but rather the accumulation of water in the soil, a process that continues until the soil becomes saturated. So, rather than considering the infiltration rate as an explicit function of time, it can be considered instead as being dependent on the actual soil moisture content (Tan and
O’Connor, 1996).
In order to relate the infiltration rate to the soil moisture content, Tan (1994) has proposed the following equation similar to the equation of Horton (1933). The equation was used in the spell out in full if available SMAR conceptual model (Tan and O’Connor, 1995). f = fc +(fo-fc)exp[-α ( act cap act S S S − )]
From the above equation, it can be seen that when the actual soil moisture content Sact approaches the soil moisture capacity Scap, the infiltration rate f tends to a
steady rate fc,and when the soil moisture content Sact approaches zero, the
infiltration rate f approaches the maximum fo.
The calculation of the actual infiltration proceeds as follows:
•
•
•
at t =0, f*∆t =0
if there is no rain, f(t). ∆t =0
if rainfall > potential infiltration then actual infiltration = minimum(potential infiltration, soil moisture deficit)
•
•
•
•
•
•
if rainfall < potential infiltration then actual infiltration =minimum (rainfall, soil moisture deficit).
The current soil moisture = Sact (t-1) + f. ∆t
The Drainage (DR) rate = fc *(1-(soil capacity-current soil moisture)/(soil
capacity-field capacity))3
Sact (t) =Sact (t-1) + f. ∆t –Eact. ∆t -DR *∆t
The calculation of actual evapotranspiration in this algorithm proceeds as follows:
- At t =0, Eact*∆t =0
- Else if
- current soil moisture (S currnt)(t) > Fc (Field capacity) then Eact. ∆t =Epot. ∆t
- Else if
- Eact*∆t = (S currnt)(t)* Epot *∆t/Fc
The excess runoff is calculated as follows: - if f. ∆t < rain. ∆t,
- rainfall_access (Raccess) = rain. ∆t - f. ∆t for f. ∆t <moisture deficit
- if cumulative infiltration satisfies the soil capacity then - rainfall_access (Raccess) = rain. ∆t
The window for the modified Horton algorithm, and the required inputs are shown in Figure 3.7.
Figure 3.7: Modified Horton infiltration module of the model
(ii) Green-Ampt Method
Based on Darcy’s law, Green and Ampt (1911) proposed a simple infiltration mode that is useful for modelling specific events. The model has following five
assumptions:
a. The soil surface is covered by a pool whose depth can be neglected. b. There is a distinctly definable wetting front.
c. The wetting front can be viewed as a plane separating a uniformly wetted infiltrated zone from a totally infiltrated zone. Thus the soil moisture profile is assumed to be a step function (Milly, 1985).
d. Once the soil is wetted, the water content in the wetted zone does not change with time as long as infiltration continues. This implies that the hydraulic conductivity K in the wetted zone does not change with time during infiltration.
e. There is a negative constant pressure just above the wetting front. The cumulative infiltration is computed using the Green-Ampt Mein-Larson (GAML) model (Mein and Larson, 1973) as presented by Chu (1978) for the case of unsteady rainfall and multiple times to ponding. Chu (1978) computed an indicator, Cu (m) that determines if ponding occurs within a given interval of rainfall
intensity given that there is no ponding at the beginning of the interval as
− − − − − = K i r d K i V i R u C 1 1 ψθ where
R = cumulative rainfall depth (m)
V = cumulative rainfall excess depth (m) r = rainfall rate m.s-1
K = saturated hydraulic conductivity (m/hour)
θd = soil moisture deficit (m.m-1) = η- θv
θv = initial volumetric content (m.m-1) ψ = matric suction at the wetting front (m).
If Cu is positive, ponding occurs before the end of the interval; if it is negative no ponding occurs. The time to ponding tp (s) is computed as:
1 1 1 * 1 1 1 − + − − + − − − − = ti i r i V i R K i r d K p t ψθ
ts is computed from
{
}
− + − − = − R V − d d V R d Kt i tp i tp s ψθ ψθ ψθ ln11 [ 1]/ 1 1 ) 1 1 ( − / − − + − = i p i i tp R t t r R t is computed from s p i t t t t= − +Cumulative infiltration Fp is computed from
) 1 ( d p d p F In Kt F ψθ ψθ + + =
The above equation is solved by successive substitution.
) 1 ( + = p d p F K f ψθ
The indicator for the end of ponding Cp during an interval, assuming that the
surface was ponded at the beginning of the interval is i
i i
p R F V
C = − −
If Cp is positive, ponding continues, if it is negative ponding ceases within the
interval. When there is no ponding within an interval, the cumulative infiltration is computed as 1 − − = i i i R V F
Figure 3.8: Green-Ampt infiltration module of the model
(iii) Process Based Equation
Although the Horton and the modified Horton algorithm can be used for climatological simulations, they do not simulate the actual physical process of infiltration. The physical process is more widely applicable to different regional climates and climate scenarios. It is based on Richard’s equations of flow. The Richard’s equation for one-dimensional flow can be written as
)] 1 ).( ( [ ). ( = − z h h k z t h h c δ δ δδ δ δ
Where
c(h) = soil water capacity can be obtained from soil water characteristics =
dh dθ
θ = initial water capacity
h = pressure head
The solution of Richard’s equation could be explicit and implicit.
Explicit solution − ∆ − − − ∆ − ∆ ∆ + = + + − − + ( 1) ( 1) . 1 2 / 1 1 2 / 1 1 z h h k z h h k z c t h h j i j i j i j i j i j i j i j i j i
k is the hydraulic conductivity, which can be estimated from by taking arithmetic mean of the two adjacent nodes, and i and j refer to the spatial and temporal increments. ) ( 5 . 0 1 5 . 0 ± ± = i + i j i k k k Implicit Solution Crank-Nicolson (C-N) Approximation
The C-N approximation averages the space derivatives at the j+1 and j-th time levels to obtain an approximation at the j +1/2 level. A C-N formulation of the Richard’s equation yields,
) 2 ( 2 ) 2 ( 2 ) ( 1 1 1 1 2 2 / 1 2 / 1 1 1 1 1 2 2 / 1 2 / 1 1 2 / 1 z h h h h z k z h h h h z k t h h c ij ij ij ij j i j i j i j i j i j i j i j i j i + − − − ∆ ∆ − ∆ − − − + ∆ = ∆ − − + − + + − + + + + + + + +
The system of equations generated by the above equation is tridiagonal. Estimates of are obtained by linearization techniques.
and