HAL Id: hal-01343818
https://hal.inria.fr/hal-01343818
Submitted on 10 Jul 2016
HAL is a multi-disciplinary open access
archive for the deposit and dissemination of
sci-entific research documents, whether they are
pub-lished or not. The documents may come from
teaching and research institutions in France or
abroad, or from public or private research centers.
L’archive ouverte pluridisciplinaire HAL, est
destinée au dépôt et à la diffusion de documents
scientifiques de niveau recherche, publiés ou non,
émanant des établissements d’enseignement et de
recherche français ou étrangers, des laboratoires
publics ou privés.
Distributed under a Creative Commons Attribution| 4.0 International License
Automatic Microbenchmark Generation to Prevent
Dead Code Elimination and Constant Folding
Marcelino Rodriguez-Cancio, Benoit Combemale, Benoit Baudry
To cite this version:
Marcelino Rodriguez-Cancio, Benoit Combemale, Benoit Baudry. Automatic Microbenchmark
Gen-eration to Prevent Dead Code Elimination and Constant Folding. 31st IEEE/ACM International
Conference on Automated Software Engineering (ASE 2016) , Sep 2016, Singapore, Singapore.
�hal-01343818�
Automatic Microbenchmark Generation to Prevent Dead
Code Elimination and Constant Folding
Marcelino
Rodriguez-Cancio
University of Rennes 1, France[email protected]
Benoit Combemale
University of Rennes 1/INRIA,France
[email protected]
Benoit Baudry
INRIA, France[email protected]
ABSTRACT
Microbenchmarking consists of evaluating, in isolation, the performance of small code segments that play a critical role in large applications. The accuracy of a microbenchmark depends on two critical tasks: wrap the code segment into a payload that faithfully recreates the execution conditions that occur in the large application; build a scaffold that runs the payload a large number of times to get a statistical esti-mate of the execution time. While recent frameworks such as the Java Microbenchmark Harness (JMH) take care of the scaffold challenge, developers have very limited support to build a correct payload.
In this work, we focus on the automatic generation of pay-loads, starting from a code segment selected in a large ap-plication. In particular, we aim at preventing two of the most common mistakes made in microbenchmarks: dead code elimination and constant folding. Since a microbench-mark is such a small program, if not designed carefully, it will be “over-optimized” by the JIT and result in distorted time measures. Our technique hence automatically extracts the segment into a compilable payload and generates addi-tional code to prevent the risks of “over-optimization”. The whole approach is embedded in a tool called AutoJMH, which generates payloads for JMH scaffolds.
We validate the capabilities AutoJMH, showing that the tool is able to process a large percentage of segments in real programs. We also show that AutoJMH can match the quality of payloads handwritten by performance experts and outperform those written by professional Java developers without experience un microbenchmarking.
Keywords
Performace evaluation; microbencharking; text tagging
1.
INTRODUCTION
Microbenchmarks allow for the finest grain performance
ACM ISBN 978-1-4503-2138-9. DOI:10.1145/1235
testing (e.g., test the performance of a single loop). This kind of test has been consistently used by developers in highly dependable areas such as operating systems [30, 19], virtual machines [9], data structures [32], databases [23], and more recently in computer graphics [25] and high per-formance computing[29]. However, the development of mi-crobenchmarks is still very much a craft that only a few experts master [9]. In particular, the lack of tool support prevents the adoption of microbenchmarking by a wider au-dience of developers.
The craft of microbenchmarking consists in identifying a code segment that is critical for performance, a.k.a segment under analysis (SUA in this paper), wrapping this segment in an independent program (the payload ) and then have it executed a large number of times by the scaffold in order to estimate its execution time. The amount of technical knowl-edge needed to design both the scaffold and the payload hin-der engineers from effectively exploiting microbenchmarks [2, 3, 9]. While recent frameworks such as JMH [2, 20, 18] address the generation of the scaffold, the construction of the payload is still an extremely challenging craft.
Engineers who design microbenchmark payloads very com-monly make two mistakes: they forget to design the payload in a way that prevents the JIT from performing dead code elimination [9, 20, 7, 3] and Constant Folds/Propagations (CF/CP) [1, 20]. Consequently, the payload runs under dif-ferent optimizations than the original segment and the time measured does not reflect the time the SUA will take in the larger application. For example, Click [9] found dead code in the CaffeineMark and ScifiMark benchmarks, re-sulting in infinite speed up of the test. Ponge also described [21] how the design of a popular set of microbenchmarks comparing JSON engines1 was prone to “over-optimization” through dead code elimination and CF/CP. In addition to these common mistakes, there are other pitfalls for payload design, such as choosing poorly initialization values or reach-ing a steady state measurreach-ing an undesired behavior.
In this work, we propose a technique to automatically gen-erate payloads for Java microbenchmarks, starting from a specific segment inside a Java application. The generated payloads are guaranteed to be free of dead code and CF/CP. Our automatic generation technique performs a static slicing to automatically extract the SUA and all its dependencies in a compilable payload. Second, we generate additional code to: (i) prevent the JIT from “over-optimizing” the payload using dead code elimination (DCE) and constand
folding/-1
constant propagation(CF/CP), (ii) initialize payload’s input with relevant values and (iii) keep the payload in steady state. Dead Code Elimination is avoided applying a novel transformation called sink maximization, while (CF/CP) is mitigated by turning some SUA’s local variables into fields in the payload. Finally, the payload is maintained in stable state by smart reseting variables to their initial value. The main objective of this technique is to assist Java developers who want to test the performance of critical code segments. We have implemented the whole approach in a tool called AutoJMH. Starting from code segment identified with a specific annotation, it automatically generates a payload for the Java Microbenchmark Harness (JMH). We use JMH as the scaffold for our microbenchmarks since it is the de-facto standard for microbenchmarking today. The framework ad-dress many of the common pitfalls when building scaffolds such as Loop Hoisting and Strength Reduction, optimiza-tions that can make the JIT reduce the number of times the payload is executed.
We evaluate AutoJMH according to three different di-mensions. First, we evaluate to what extent our program analyses can generate payloads out of large real-world pro-grams. We run AutoJMH on the 6 028 loops present in 5 mature Java projects: our technique can extract 4705 SUA into microbenchmarks (74% of all loops) and find initializa-tion values and generate complete payloads for 3462 (60%) of the loops. Second, we evaluate the quality of the automat-ically generated microbenchmarks: we use AutoJMH to re-generate 23 microbenchmarks handwritten by performance experts to effectively detect 8 performance issues. Automat-ically generated microbenchmarks measure the same times as the microbenchmarks written by the JMH experts. Third, we qualitatively compare the microbenchmarks generated by 6 professional Java engineers, noticing that engineers usu-ally make naive decisions when designing their benchmarks, distorting the measurement, while AutoJMH prevents all these mistakes by construction.
To sum up, the contributions of the paper are:
• A static analysis to automatically extract a code seg-ment and all its dependencies
• Code generation strategies that prevent artificial run-time optimizations when running the microbenchmark • An empirical evaluation of the quality of the generated
microbenchmarks
• A publicly available tool and dataset to replicate all our experiments2
In section 2 we discuss and illustrate the challenges for microbenchmark design, which motivate our contribution. In section 3 we introduce our technical contribution for the automatic generation of microbenchmarks in Java. In sec-tion 4 we present a qualitative and quantitative evaluasec-tion of our tool and discuss the results. Section 5 outlines the related work and section 6 concludes.
2.
PAYLOAD CHALLENGES
In this section, we elaborate on some of the challenges that software engineers face when designing payloads. These challenges form the core motivation for our work. In this work we use the Java Microbenchmark Harness (JMH) as to generate scaffolds. This allows us to focus on payload
2
https://github.com/autojmh
generation and to reuse existing efforts from the community in order to build an efficient scaffold.
2.1
Dead Code Elimination
Dead Code Elimination (DCE) is one of the most common optimizations engineers fail to detect in their microbench-marks [9, 21, 7, 20]. During the design of microbenchmicrobench-marks, engineers extract the segment they want to test, but usually leave out the code consuming the segment’s computations (the sink ), allowing the JIT to apply DCE. It is not always easy to detect dead code and it has been found in popu-lar benchmarks [9, 21]. For example, listing 1 displays a microbenchmark where the call to Math.log is dead code, while the call to m.put is not. The reason is that m.put modifies a public field, but the results of the Math.log are not consumed afterwards. Consequently the JIT will apply DCE when running the microbenchmark, which will distort the time measured.
Map < String , Double > m = M a p U t i l s . b u i l d R a n d o m M a p () ; @ B e n c h m a r k
public void h i d d e n D C E () { M a t h . log ( m . put (" Ten ", 10) ) ; }
Listing 1: An example of dead code
A key feature of the technique we propose in this work is to automatically analyze the mircrobenchmark in order to generate code that will prevent the JIT from running DCE on this kind of benchmark.
2.2
Constant Folding / Constant Propagation
Constant Folding and Constant Propagation (CF/CP) is another JIT optimization that removes all computations that can be replaced by constants. While it is mostly consid-ered prejudicial for measurements, in some punctual cases a clever engineer may want to actually pass a constant to a method in a microbenchmark to see if CF/CP kicks in, since it is good for performance that a method can be con-stant folded. However, when not expected the optimizations causes microbenchmarks to return deceitfully good perfor-mance times.
Good examples of both DCE and CF/CP optimizations, as well as their impact on the measurements can be found in literature [20]. Concrete evidence can also be found in the JMH examples repository3.
2.3
Non-representative data
Another source of errors when designing payloads is to run a microbenchmark with data not representing the actual conditions in which the system being measured works.
For example, suppose a maintenance being done over an old Java project and that different sort methods are being compared to improve performance, one of them being the Collections.sort method. Suppose that the system con-sistently uses Vector<T> but the engineer fails to see this and uses LinkedLis<T> in the benchmarks, concluding that Collections.sort is faster when given as input an already sorted list. However, as the system uses Vector lists, the actual case in production is the opposite: sorted lists will result in longer execution times, as shown in table 1, mak-ing the conclusions drawn from the benchmark useless.
3http://hg.openjdk.java.net/code-tools/jmh/file/tip/
Table 1: Execution times of Collections.sort Using a sorted list Using an unsorted list LinkedList 203 ns 453 ns
Vector 1639 ns 645 ns
2.4
Reaching wrong stable state
The microbenchmark scaffold executes the payload many times, warming up the code until it reaches a stable state and is not optimized anymore. A usual pitfall is to build microbenchmarks that reach stable state in conditions un-expected by the engineer. For example, if we were to observe the execution time of the Collection.sort while sorting a list, one could build the following wrong microbenchmark:
L i n k e d L i s t < Double > m = L i s t U t i l s . b u i l d R a n d o m L i s t () ; @ B e n c h m a r k
public void doSort () { C o l l e c t i o n s . s o r t ( m ) ; }
Listing 2: Sorting a sorted list in each run Unfortunately, after the first execution the list gets sorted. In consecutive executions, the list is already sorted and con-sequently, we end up measuring the performance of sorting an already sorted list, which is not the situation we initially wanted to measure.
3.
AUTOJMH
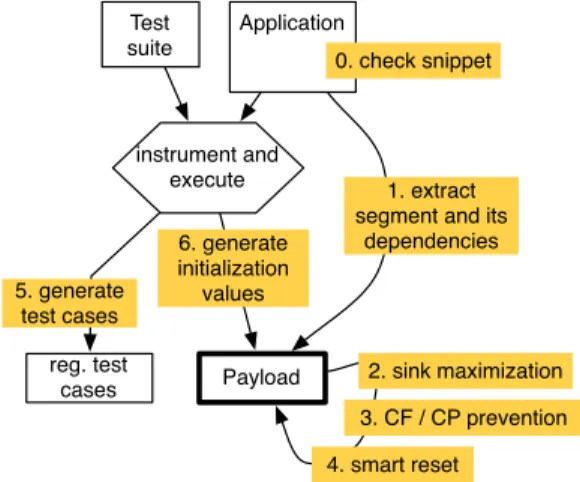
AutoJMH automatically extracts a code segment and generates a complete payload with inputs that reflect the be-havior of the segment in the original application. The gener-ation process not only wraps the segment in an independent program, it also mitigates the risks of unexpected DCE and CF/CP optimizations and ensures that it will reach stable state in the same state executed by the SUA during the unit tests. Test suite Application instrument and execute Payload 0. check snippet 1. extract segment and its
dependencies 2. sink maximization 3. CF / CP prevention 4. smart reset 5. generate test cases 6. generate initialization values reg. test cases
Figure 1: Global process of AutoJMH for payload generation.
Figure 1 illustrates the different steps of this process. If the SUA satisfies a set of preconditions (detailed in sec-tion 3.1), AutoJMH extracts the segment into a wrap-per method. Then, the payload is refined to prevent dead code elimination, constant folding and constant propagation (steps 2, 3), as well as unintended stable state (step 4) when the payload is executed many times. The last steps consist
in running the test suite on the original program to produce two additional elements: a set of data inputs to initialize variables in the payload; a set of regression tests that ensure that the segment has the same functional behavior in the payload and in the original application.
In the rest of this section we go into the details of each step. We illustrate the process through the creation of a microbenchmark for the return statement inside the Enu-meratedDistribution::value() method of Apache Com-mon Math, shown in listing 3. The listing also illustrates that a user identifies a SUA by placing the Javadoc-like com-ment @bench-this on top of it. This comcom-ment is specific to AutoJMH and can be put on top of every statement. The resulting payload is shown listing 4.
double value (double x , double... param ) throws D i m e n s i o n M i s m a t c h E x c e p t i o n , N u l l A r g u m e n t E x c e p t i o n {
v a l i d a t e P a r a m e t e r s ( p a r a m ) ;
/* * @bench - t h i s */
return S i g m o i d . value (x , param [0] , param [1]) ; }
Listing 3: An illustrating example: a SUA in commons.math
In listing 4 we can see that AutoJMH has wrapped the return statement into a method annotated with @Bench-mark. This annotation is used to indicate the wrapper method that is going to be executed many times by the JMH scaf-fold. The private static method Sigmoid.value has been ex-tracted also into the payload, since it is needed by the SUA. AutoJMH has turned variables x and params into fields and provides initialization code from them, loading values from a file, which is part of our strategy to avoid CF/CP. Finally, AutoJMH ensures that some value is returned in the wrapper method to avoid DCE.
c l a s s M y B e n c h m a r k {
double[] params ; double x ; @ S e t u p void setup () { L o a d e r l = new L o a d e r (" / d a t a / S i g m o i d _ 1 6 0 . dat ") ; x = l . l o a d d o u b l e () ; p a r a m s = l . l o a d d o u b l e A r r a y 1 () ; } double S i g m o i d _ v a l u e (
double x , double lo , double hi ) {
return lo + ( hi - lo ) / (1 + F a s t M a t h . exp ( - x ) ) ; }
@ B e n c h m a r k
public double p a y l o a d W r a p p e r () {
return S i g m o i d _ v a l u e (x , params [0] , params [1]) } }
Listing 4: An illustrating example: the payload generated by AutoJMH
3.1
Preconditions
The segment extraction is based on a static analysis and focuses on SUAs that meet the following conditions. These preconditions ensure that the payload can reproduce the same conditions than those in which the SUA is executed in the original program.
1. Initialized variables used by the SUA are of the follow-ing types: primitive (int, double, boolean), their class counterparts (Integer, Double, Boolean), String, types implementing the Serializable interface, or, col-lections and arrays of all the above. Non-initialized variables used by the SUA can be of any public type.
This condition ensures that AutoJMH can store the values of all variables used by the SUA
2. None of the methods invoked inside the SUA can have a target not supported in item 1. This ensures that AutoJMH is able to extract all methods used by the SUA.
3. All private or protected methods used by the SUA can be resolved statically. Dynamically resolved methods have a different performance behavior than statically resolved ones [4]. Using dynamic slicing we could make available to the microbenchmark a non-public dynamic method, but we would distort its performance behav-ior.
4. The call graph of all methods used by the SUA can-not be more than a user-defined number of levels deep before reaching a point in which all used methods are public. This sets a stopping criterion for the explo-ration of the call graph.
3.2
SUA extraction
AutoJMH starts by extracting the segment under anal-ysis (SUA) to create a compilable payload. This extraction step processes the Abstract Syntax Tree (AST) of the large application, which includes the source code of the SUA. The segment’s location is marked with the @bench-this Javadoc-like comment, introduced by AutoJMH to select the segments to be benchmarked. If the SUA satisfies the preconditions, AutoJMH statically slices the source code of the SUA and its dependencies (methods, variables and constants) from the original application into the payload. Non-public field declarations and method bodies used by the SUA are copied to the payload, their modifiers (static, final, volatile) are preserved.
Some transformations may be needed in order to achieve a compilable payload. Non-public methods copied into the payload are modified to receive their original target in the SUA as the first parameter (e.g., data.doSomething() be-comes doSomething(data)). Variable and method may be renamed to avoid name collision and to avoid serializing complex objects. For example, suppose a segment using both a variable data and a field myObject.data, AutoJMH declares two public fields: data and myObject_data. When method renaming is required, AutoJMH uses the fully qual-ified name.
At the end of the extraction phase, AutoJMH has sliced the SUA code into the payload’s wrapper method. This relieves the developer from a very mechanical task and its automation reduces the risks of errors when copying and renaming pieces of code. Yet, the produced payload still needs to be refined in order to prevent the JIT from “over-optimizing” this small program.
Preserving the original performance conditions.
We aim at generating a payload that recreates the ex-ecution conditions of the SUA in the original application. Hence, we are conservative in our preconditions before slic-ing. We also performed extensive testing to be sure that the code modifications explained above do not distort the original performance of the SUA. These tests are publicly available4. Then, all the additional code generated by Au-toJMH to avoid DCE, initialize values, mitigate CF/CP
4
https://github.com/autojmh/syntmod
and keep stable state, is inserted before or after the wrapped SUA.
3.3
Preventing DCE with Sink Maximization
During the extraction of the SUA, we may leave out the code consuming its computations (the sink ), giving the JIT an opportunity for dead code elimination (DCE), which would distort the time measurement. AutoJMH handles this po-tential problem featuring a novel transformation that we call Sink maximization. The transformation appends code to the payload, which consumes the computations. This is done to maximize the number of computations consumed while minimizing the performance impact in the resulting payload.
There are three possible strategies to consume the results inside the payload:
• Make the payload wrapper method return a re-sult. This is a safe and time efficient way of preventing DCE, but not always applicable (e.g., when the SUA returns void).
• Store the result in a public field. This is a time efficient way of consuming a value, yet less safe than the previous solution. For example, two consecutive writes to the same field can make the first write to be marked as dead code. It can also happen that the pay-load will read from the public field with a new value, modifying its state.
• JMH Black hole methods. This is the safest so-lution, which does not modify the microbenchmark’s state. Black holes (BH) are methods provided by JMH to make the JIT believe their parameters are used, therefore preventing DCE. Yet, black holes have a small impact on performance.
A naive solution is to consume all local variables live at the end of the method with BHs. Yet, the accumulation of BH method calls can be a considerable overhead when the execution time of the payload is small. Therefore, we first use the return statement at the end of the method, taking into consideration that values stored in fields are already sinked and therefore do not need to be consumed. Then, we look for the minimal set of variables covering the whole sink of the payload to minimize the number of BH methods needed.
Sink maximization performs the following steps to gener-ate the sink code:
1. Determine if it is possible to use a return statement. 2. Determine the minimal set of variables Vmincovering
the sink of the SUA.
3. When the use of return is possible, consume one vari-able from Vminusing one return and use BHs for the
rest. If no return is possible, use BHs to consume all local variables in Vmin.
4. If a return is required to satisfy that all branches return a value and there is no variables left in Vmin, return a
field.
To determine the minimal set Vmin, the AutoJMH
con-verts the SUA code into static single assignment (SSA) form[34] and builds a value dependency graph (VDG) [35]. In the VDG, nodes represent variables and edges represent direct value dependencies between variables. For example, if the
value of variable A directly depends on B, there is an edge from B to A. An edge going from one variable node to a phi node merging two values of the same variable is a back-edge. In this graph, sink-nodes are nodes without ingoing edges.
Initially, we put all nodes of the VDG in Vmin, except
those representing fields values. Then, we remove all vari-ables that can be reached from sink-nodes from Vmin. After
doing this, if there are still variables in Vminother than the
ones represented by sink-nodes, we remove the back-edges and repeat the process.
int d = 0; a = b + c ; i f ( a > 0 ) { d = a + h ; a = 0; } b = a ;
Listing 5: A few lines of code to exemplify Sink maximization
To exemplify the process of finding Vminwithin Sink
Max-imization let us consider listing 5. The resulting VDG graph is represented in figure 2. Sink nodes are nodes d and b1, which are represented as rounded nodes. The links go from variables to their dependencies. For example, d depends on a0 and h. Since it is not possible to arrive to all nodes from a single sink d or b1, in the example Vmin = {d, b1}.
Con-sequently both d and b must be consumed in the payload.
Figure 2: VDG of listing 5
3.4
CF/CP mitigation
Since all SUA are part of a larger method, they most often use variables defined upfront in the method. These variables must be declared in the payload. Yet, naively declaring these variables might let the JIT infer the value of the variables at compile time and use constant folding to replace the vari-ables with a constant. Meanwhile, if this was possible in the original system, it should also be possible in the pay-load. The challenge is then to detect when CF/CP must be avoided and when it must be allowed to declare variables and fields accordingly.
AutoJMH implements the following rules to declare and initialize a variable in the payload:
• Constants (static final fields ) are initialized using the same literal as in the original program.
• Fields are declared as fields, keeping their modifiers (static, final, volatile) and initialized in the @Setup method of the microbenchmark. Their initial values are probed through dynamic analysis and logged in a file for reuse in the payload (cf. section 3.6 for details about this probing process).
• Local variables are declared as fields and initialized in the same way, except when (a) they are declared by assigning a constant in the original method and
(b) all possible paths from the SUA to the beginning of the parent method include the variable declaration (i.e. the variable declaration dominates [34] the SUA) , in which case their original declaration is copied into the payload wrapper method. We determine whether the declaration of the variable dominates the SUA by analyzing the control flow graph of the parent method of the SUA.
Listing 4 shows how the variables x and params are turned into fields and initialized in the @Setup method of the pay-load. The @Setup method is executed before all the execu-tions of the wrapper method and its computation time is not measured by the scaffold.
3.5
Keep stable state with Smart Reset
In Section 2 we discussed the risk for the payload to reach an unintended stable state. This happens when the pay-load modifies the data over which it operates. For example, listing 6 shows that variable sum is auto-incremented. Even-tually, sum will be always bigger than randomValue and the payload will stop to execute the return statement.
public T sample () {
f i n a l double r a n d o m V a l u e = random . n e x t D o u b l e () ; double sum = 0;
/* * @bench - t h i s */
for ( int i = 0; i < p r o b a b i l i t i e s . length ; i ++) { sum += p r o b a b i l i t i e s [ i ];
i f ( r a n d o m V a l u e < sum ) return s i n g l e t o n s . get ( i ) ; }
return s i n g l e t o n s . get ( s i n g l e t o n s . size () - 1) ; }
Listing 6: Variable sum needs to be reset to stay in the same state
AutoJMH assumes that the computation performed in the first execution of the payload is the intended one. Hence, it automatically generates code that resets the data to this initial state for each run of the SUA. Yet, we implement this feature of AutoJMH carefully to bring the reset code overhead to a minimum. In particular, we reset only the variables influencing the control flow of the payload. In list-ing 7 AutoJMH determined that sum must be reset, and it generates the code to do so.
@ B e n c h m a r k
public double d o B e n c h m a r k () {
sum = s u m _ r e s e t ; // < - S M A R T R E S E T H E R E !
for ( int i = 0; i < p r o b a b i l i t i e s . length ; i ++) { sum += p r o b a b i l i t i e s [ i ];
i f ( r a n d o m V a l u e < sum ) return s i n g l e t o n s . get ( i ) ; }
return sum ; }
Listing 7: Variable sum is reset by code appended to the microbenchmark
To determine which variables must be reset, AutoJMH reuses the VDG built to determine the sinks in the Sink maximization phase. We run Tarjan’s Strongly Connected Components algorithm to locate cycles in the VDG, and all variables inside a cycle are considered as potential candi-dates for reset. In a second step we build a Control Flow Graph (CFG) and we traverse the VDG, trying to find paths from variables found in the branching nodes of the CFG to those found in the cycles of the VDG. All of the variables that we succesfully reach are marked for reset.
3.6
Retrieving inputs for the payload
The last part of the microbenchmark generation process consists in retrieving input values observed in the original application’s execution (steps 5 and 6 of figure 1). To re-trieve these values, we instrument the original program to log the variables just before and after the SUA. Then, we run once the test cases that cover the SUA in order to get actual values.
In order to make the collected values available to the wrap-per method in the payload, AutoJMH generates a specific JMH method marked with the @Setup annotation (which executes only once before the measurements), containing all the initialization code for the extracted variables. Listing 4 shows an example where variables x and params are initial-ized with values retrieved from a log file.
@ T e s t public void t e s t M i c r o B e n c h () { L o a d e r l = new L o a d e r () ; // Get v a l u e s r e c o r d e d b e f o r e e x e c u t i o n l . o p e n S t r e a m (" / d a t a / S i g m o i d _ 1 6 0 . dat ") ; M y B e n c h m a r k m = new M y B e n c h m a r k () ; m . x = l . r e a d d o u b l e () ; m . p a r a m s = l . r e a d d o u b l e A r r a y 1 () ; double m R e s u l t = m . p a y l o a d W r a p p e r () ; // Get v a l u e s r e c o r d e d a f t e r p r o g r a m e x e c u t i o n l . o p e n S t r e a m (" / d a t a / S i g m o i d _ 1 6 0 _ a f t e r . dat ") ; // C h e c k w i t h v a l u e s a f t e r p a y l o a d e x e c u t i o n a s s e r t E q u a l s ( m . x , l . r e a d d o u b l e () ) ; a s s e r t A r r a y D o u b l e E q u a l s ( m . params , l . r e a d d o u b l e A r r a y 1 () ) ; // C h e c k r e s u l t s are e q u a l in b o t h e x e c u t i o n s a s s e r t E q u a l s ( mResult , m . p a y l o a d W r a p p e r () ) ; }
Listing 8: Generated unit test to ensure that the microbenchmark has the same functional behavior than the SUA
3.7
Verifying functional behavior
To check that the wrapper method has the same func-tional behavior as the SUA in the original application (i.e. produces the same output given the same input), Auto-JMH generates a unit test for each microbenchmark, where the outputs produced by the microbenchmark are required to be equal to the output values recorded at the output of the SUA. These tests serve to ensure that no optimization applied on the benchmark interferes with the expected func-tional behavior of the benchmarked code. In the test, the benchmark method is executed twice to verify that the re-sults are consistent within two executions of the benchmark and signal any transient state. Listing 8 shows a unit test generated for the microbenchmark of listing 4.
4.
EVALUATION
We perform a set of experiments on large Java programs to evaluate the effectiveness of our approach. The purpose of the evaluation is twofold. First, a quantitative assessment of AutoJMH aims at evaluating the scope of our program analysis, looking at how many situations AutoJMH is able to handle for automatic microbenchmark generation. Sec-ond, two qualitative assessments compare the quality of Au-toJMH’s generated microbenchmarks with those written by experts and with those built by expert Java developers who have little experience in microbenchmarking. We investi-gate these two aspects of AutoJMH through the following research questions:
RQ1: How many loops can AutoJMH automati-cally extract from a Java program into microbench-marks?
In addition to the generation of accurate microbenchmarks, it is important to have a clear understanding of the reach of AutoJMH’s analysis capacities. Remember that Au-toJMH can only handle those segments that meet certain preconditions. Therefore, we need to quantify the impact of these conditions when analyzing real-world code.
RQ2: How does the quality of AutoJMH’s gener-ated microbenchmarks compare with those written by experts?
Our motivation is to embed expert knowledge into Auto-JMH, to support Java developers who have little knowledge about performance evaluation and who want to get accurate microbenchmark. This research question aims at evaluating whether our technique can indeed produce microbenchmarks that are as good as the ones written by an expert.
RQ3: Does AutoJMH generate better microbench-marks than those written by engineers without ex-perience in microbenchmarking?
Here we want to understand to what extent AutoJMH can assist Java developers who want to use microbenchmark-ing .
4.1
RQ1: Automatic extraction of segments
We run AutoJMH on 5 real Java projects to find out to what extent the tool is able to automatically extract loops and generate corresponding payloads. We focus on the gen-eration of benchmarks for loops since they are often a per-formance bottleneck and they stress AutoJMH’s capacities to deal with transient states, although the only limitations to the slicing procedure are the ones described in section 3.1. We selected the following projects for our experiments, because their authors have a special interest in performance (the exact versions can be found in AutoJMH’s repository
5
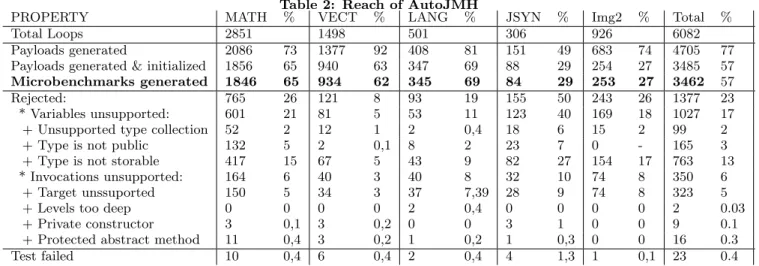
): Apache Math is the Apache library for mathemat-ics and statistmathemat-ics; Vectorz is a vector and matrix library, based around the concept of N-dimentional arrays. Apache Common Lang provides a set of utility methods to handle Java core objects; Jsyn is a well known library for the gen-eration of music software synthesizers. ImageLib2 is the core library for the popular Java scientific image processing tool ImageJ. To answer RQ1, we annotate all the 6 028 loops in these 5 projects and run AutoJMH to generate payloads. Table 2 sumarizes our findings, one column for each project and the last column shows totals. The row “Payloads gener-ated” shows the number of loops that AutoJMH succesfully analyzed and extracted in a payload code. The row “Pay-loads Generated & Initialized” refines the previous number, indicating those payloads for which AutoJMH was able to generate code and initialization values (i.e. they were cov-ered with at least one unit test). The row “Microbenchmarks generated” further refines the previous numbers, indicating the amount of loops for which AutoJMH was able to gen-erate and initialize a payload that behaves functionally the same as the SUA (i.e. equal inputs produce equal results). The rows below detail the specific reason why some loops could not be extracted. We distinguish between “Variables unsupported” or “Invocations Unsupported”. As we can see, the main reason for rejection are unsupported variables. Fi-nally, row “Test Failed” shows the number of
microbench-5
Table 2: Reach of AutoJMH
PROPERTY MATH % VECT % LANG % JSYN % Img2 % Total %
Total Loops 2851 1498 501 306 926 6082
Payloads generated 2086 73 1377 92 408 81 151 49 683 74 4705 77
Payloads generated & initialized 1856 65 940 63 347 69 88 29 254 27 3485 57 Microbenchmarks generated 1846 65 934 62 345 69 84 29 253 27 3462 57
Rejected: 765 26 121 8 93 19 155 50 243 26 1377 23
* Variables unsupported: 601 21 81 5 53 11 123 40 169 18 1027 17
+ Unsupported type collection 52 2 12 1 2 0,4 18 6 15 2 99 2
+ Type is not public 132 5 2 0,1 8 2 23 7 0 - 165 3
+ Type is not storable 417 15 67 5 43 9 82 27 154 17 763 13
* Invocations unsupported: 164 6 40 3 40 8 32 10 74 8 350 6
+ Target unssuported 150 5 34 3 37 7,39 28 9 74 8 323 5
+ Levels too deep 0 0 0 0 2 0,4 0 0 0 0 2 0.03
+ Private constructor 3 0,1 3 0,2 0 0 3 1 0 0 9 0.1
+ Protected abstract method 11 0,4 3 0,2 1 0,2 1 0,3 0 0 16 0.3
Test failed 10 0,4 6 0,4 2 0,4 4 1,3 1 0,1 23 0.4
marks that failed to pass the generated regressions tests. The percentages are overall percentages.
The key result here is that out of the 6 028 loops found in all 5 projects, AutoJMH correctly analyzed, extracted and wrapped 3 462 loops into valid microbenchmarks. These mi-crobenchmarks resulted from 3 485 payloads for which Au-toJMH was able to generate and find initialization values and who’s regression test did not fail. In total, AutoJMH generated the code for 4 705 payloads. The tool rejected 1377 loops because they did not meet the preconditions.
Looking into the details, we observe that Vectorz and Apache Lang contain relatively more loops that satisfy the preconditions. The main reason for this is that most types and classes in Vectorz are primitives and serializables, while Apache Lang extensively uses Strings and collec-tions. Apache Math also extensively uses primitives. The worst results are to JSyn: the reason for this seems to be that the parameters to the synthesizers are objects instead of numbers, as we initially expected.
The results vary with the quality of the test suite of the original project. In all the Apache projects, almost all loops that satisfy the precondition finally turn into a microbench-mark, while only half of the loops of Vectorz and JSyn that can be processed by AutoJMH are covered by one test case at least. Consequently, many payloads cannot be initial-ized by AutoJMH, because it cannot perform the dynamic analysis that would provide valid initializations.
o u t e r :
for ( int i = 0; i < csLen ; i ++) { f i n a l char ch = cs . charAt ( i ) ;
/* * @bench - t h i s */
for ( int j = 0; j < s e a r c h L e n ; j ++) { i f ( s e a r c h C h a r s [ j ] == ch ) {
i f ( i < csLast && j < s e a r c h L a s t && C h a r a c t e r . i s H i g h S u r r o g a t e ( ch ) ) {
i f ( s e a r c h C h a r s [ j + 1] == cs . charAt ( i + 1) ) { continue outer ; }
} e l s e { continue o u t e r ; }}}
Listing 9: The SUA depends on outer code to work properly
Table 2 also shows that some microbenchmarks fail re-gression tests. A good example is the inner loop of listing 9, extracted from Apache Common Lang. This loop de-pends on the ch variable, obtained in its outer loop. In this
case, AutoJMH generates a payload that compiles and can run, but that does not integrate the outer loop. So the pay-load’s behavior is different from the SUA and the regression tests fails.
It is worth mentioning that while AutoJMH failed to generate the inner loop, it did generate a microbenchmark for the outer one.
Answer to RQ1: AutoJMH was able to generate 3 485 microbenchmarks out of 6 028 loops found in real-word Java programs, and only 23% of the analyzed loops did not satisfy the tool’s preconditions.
4.2
RQ2: AutoJMH generation vs Performance
engineers manual microbenchmarks
To answer RQ2, we automatically re-generate mircrobench-marks that were manually designed by expert performance engineers. We assess the quality of the automatically gener-ated microbenchmarks by checking that the times they mea-sure are similar to the times meamea-sured by the handwritten microbenchmarks.
4.2.1
Microbenchmarks dataset
We re-generate 23 JMH microbenchmarks that were used to find 8 documented performance regression bugs in projects by Oracle6 and Sowatec AG [12]. We selected
microbench-marks from Oracle, since this company is in charge of the development of Hotspot and JMH. The flagship product of Sowatec AG, Arregulo7, has reported great performance
re-sults using microbenchmarks. The microbenchmarks in our dataset contained several elements of Java such as condi-tionals, loops, method calls, fields and they where aimed at variety of purposes.
Follows a small description of each one of the 23 mi-crobenchmarks (MB) in our dataset:
MB 1 and 2: Measure the differences between ArrayList.add and ArrayList.addAll when adding multiple elements.
MB 3 to 5: Compare different strategies of creating ob-jects using reflection, using as baseline the operator new.
6
http://bugs.java.com. Bugs ids: 8152910, 8050142, 8151481 and 8146071
7
MB 6: Measure the time to retrieve fields using reflection. MB 7 to 9: Compare strategies to retrieve data from maps when the key is required to be a lower case string.
MB 10 and 11: Compare the ConcurrentHashMap.get method vs. the NonBlockingHashMapLong.get method.
MB 12 to 14: See whether BigInteger.value can be constant folded when given as input a number literal.
MB 15 and 16: Contrasts the performance of Math.max given two numbers vs. a greater than (a > b) comparison.
MB 17: Evaluate the performance of the Matcher.reset method.
MB 18 to 23: Evaluate the performance of the String.format method using several types of input (double, long, String).
4.2.2
Statistical tests
We use the statistical methodology for performance eval-uation introduced by George et. al. [13] to determine the similarity between the times measured by the automatically generated microbenchmarks and the handwritten ones. This consists in finding the confidence interval for the series of ex-ecution times of both programs and to check whether they overlap, in which case there is no statistical reason to say they are different. We run the experiment following the recommended methodology, considering 30 virtual machine invocations, 10 of which run for microbenchmarks and 10 warm up iterations to reach steady state. We select a confi-dence level of 0,05.
To further assess the relevance of the features of Auto-JMH presented in section 3, we generate three other sets of 23 microbenchmarks. Each set of microbenchmark is prone to the following pitfall: DCE, CF/CP and wrong initial val-ues. DCE was provoked by turning off sink maximization. CF/CP was provoked by inverting the rules of variable dec-laration where constants (static final fields) are declared as regular fields and initialized from file; fields are redeclared as constants (static final field) and initialized using literals (10, "zero", 3.14f); local variables are always declared as local variables and initialized using literals. In the third set, we feed random data as input to observe differences in measurements caused by using different data. Using these 3 different sets of microbenchmarks, we performed the pair-wise comparison again between them and the handwritten microbenchmarks.
Table 3: Similarity between generated and hand-written benchmarks. Row 1 shows the set generated with AutoJMH and rows 2,3 and 4 the benchmarks generated without some features of AutoJMH
# Set Successful tests
1 Generated with AutoJMH 23 / 23
2 DCE 0 / 23
3 CF/CP 11 / 23
4 Bad initialization 3 / 23
Table 3 shows the results. The column “Successful tests” shows for how many of the 23 automatically generated mi-crobenchmarks measured the same times as the handwritten microbenchmarks..
4.2.3
Analysis of the results
The key result of this set of experiments is that all the 23 microbenchmarks that we re-generated with AutoJMH
(line 2 of table 3) measure times that are statistically simi-lar to the times measured by the handwritten microbench-marks. We interpret this result as a strong sign of the accu-racy of the microbenchmarks generated by AutoJMH.
Line 3 of table 3 shows the strong impact of DCE on the accuracy of microbenchmarks: 100% of microbenchmarks that we generate without sink maximization measure times that are significantly different from the times of handwrit-ten microbenchmarks. This was our expected result, since indeed the JIT is extremely good at removing dead code. The inverted rules for CF/CP take a toll on 12 microbench-marks, for example the result of a comparison between two constants is also a constant (MB 15) and therefore there is no need to perform the comparison. Eleven microbench-marks generated with wrong variable declarations still mea-sure similar times, because some SUA cannot be constant folded (e.g., the Map.get method in in MB 7 cannot be constant folded). Finally, line 5 shows that passing wrong initial values produces different results, since adding 5 ele-ments to a list takes less time than adding 20 (MB 1, 2) or converting into a string the PI constant (3,141592653589) is certainly slower than a integer such 4 for example (MB 18 to 23). The three cases that measured correct times occur when the fields that are initialized in the payload are not used (as is the case in MB 5).
The code for all the microbenchmarks used in this ex-periment, as well as the program and the unit test used to rebuild them, can be found in the website of AutoJMH8.
Answer to RQ2: microbenchmarks automatically gen-erated by AutoJMH systematically perform as good as benchmarks built by a JMH experts with a confi-dence level of 0.05. The code generated to prevent DCE, CF/CP and initialize the payload plays a significant role in the quality of the generated microbenchmarks.
4.3
RQ3: AutoJMH vs engineers without
mi-crobenchmarking experience
For this research question, we consider 5 code segments, all contained in a single class and we ask 6 professional Java developers with little experience in performance evaluation to build a microbenchmark for each segment. This simulates the case of software engineers looking to evaluate the per-formance of their code without specific experience in time measurement. This is a realistic scenario, as many engi-neers arrive to microbenchmarking due to an eventual need, gathering the knowledge they require by themselves using available resources as Internet tutorials and conferences.
We provided all participants a short tutorial about JMH. All participants had full access to Internet during the exper-iment and we individually answered all questions relative to better microbenchmarking. Participants were also reminded that code segments may have multiple performance behav-iors and that otherwise noticed, they should microbench-mark all behaviors they could find.
4.3.1
Segments under analysis
Each of the 5 code segments is meant to test one different feature of AutoJMH.
8
SUA 1 in listing 10: participants were requested to evaluate the execution time of the for loop. Here we eval-uate a segment which execution time depends on the dif-ferent input’s types. The parameter c of addFunction is of type MyFunction, which is inherited by two subclasses, both overriding the calc method. The calculations performed by both subclass are different, which required several mi-crobenchmarks to evaluate all possibilities.
SUA 2 and 3 in listing 11: participants were requested to evaluate the time it takes to add one element into an array list, and the time it takes to sort a list of 10 elements. Here we wanted to test the participant’s ability at using different reset strategies to force the microbenchmark reach stable state measuring the desired case. The payload for SUA 2 must constrain the list size , otherwise the JVM runs out of memory. For SUA 3 it is necessary to reset the list into an unordered state.
SUA 4 and 5 in listing 12: participants were requested to estimate how long takes the expression to execute. The segments consist of simple mathematical expressions meant to investigate if participants are able to avoid DCE and con-stant folding when transplanting a SUA into a payload.
All microbenchmarks used in this experiment are publicly available in the github repository of AutoJMH
4.3.2
Resulting microbenchmarks
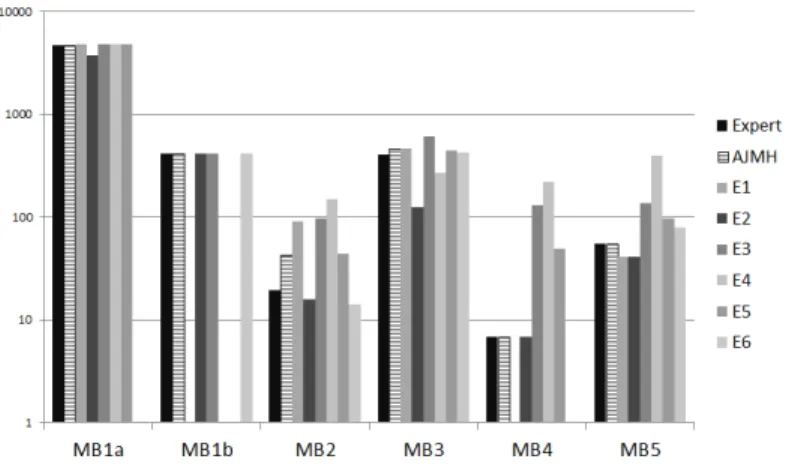
Figure 3 shows the execution times measured by all mi-crobenchmarks. The y-axis shows execution times in mil-liseconds (log scale). On the x-axis we show 6 clusters: MB1a and MB1b for the two performance behaviors of SUA 1 and MB2 to MB5 for all other segments. Each cluster includes the time measured by the microbenchmarks de-signed by the 6 Java developers. In each cluster, we add two microbenchmarks: one generated by AutoJMH and one designed manually by us and that has been reviewed by the main developer of JMH. The latter microbenchmark (for short: the expert ) is used as the baseline for comparison. We use the similiraty of execution times for comparison: the closest to the baseline, the better.
First, we observe that the times for the AutoJMH and the baseline microbenchmarks are consistently very close to each other. The main differences we can see are located in SUAs 2 and 3. This is because AutoJMH uses a generic reset strategy consisting in clearing the list and adding the values, which is robust and performs well in most cases. However, the expert microbenchmarks and the one made by Engineer 6 for SUA 3 featured specific reset strategies with less overhead. The best strategy to reset in SUA 2 is to reset only after several calls to the add method have been made, distributing the reset overhead and reducing the estimation error. In the expert benchmark for SUA 3, each element is set to a constant value. A clever trick was used by engineer 6 in SUA 39: the sort method was called twice with two dif-ferent comparison functions (with equivalent performance), changing the correct order in every call. This removes the need to reset the list, since every consecutive call to sort is considered unordered.
Second, we observe that Java developers build microbench-marks that measure times that are very different from the baseline. In order to understand the root cause of these
dif-9
https://github.com/autojmh/autojmh-validation-data/ blob/master/eng6/src/main/java/fr/inria/diverse/ autojmh/validation/eng6/TransientStateListSortEng6.java
Figure 3: Execution times comparison between mi-crobenchmarks generated by AutoJMH those man-ually built by Java developers and one JMH expert
ferences, we manually review all the microbenchmark. Here we observe that the participants did encounter the pitfalls we expected for each kind of segment: 3 participants fail to distinguish 2 performance behaviors in MB1; 3 partici-pants made mistakes when initializing MB2 and MB3; we found multiple issues in MB4 and MB5, where 3 engineers did not realize that their microbenchmark was optimized by DCE, Engineer 6 allowed parts of its microbenchmark to be constant folded and 3 participants bloated to some extend their microbenchmark with overhead. An interesting fact was that Engineer 6 was aware of constant folding, since he asked about it, meaning that a trained eye is needed to detect optimizations, even when one knows about them.
Answer to RQ3: microbenchmarks generated by Au-toJMH prevent mistakes commonly made by Java de-velopers without experience in microbenchmarking.
4.4
Threats to validity
The first threat is related to the generalizablity of obser-vations. Our qualitative evaluation was performed only with 5 segments and 6 participants. Yet, segments were designed to be as different as possible and to cover different kinds of potential pitfalls. The quantitative experiment also allowed us to test AutoJMH on a realistic code base, representative of a large number of situations that can be encountered in Java applications.
AutoJMH is a complex tool chain, which combines code instrumentation, static and dynamic analysis and code gen-eration. We did extensive testing of our the whole infrastruc-ture and used it to generate a large number of microbench-marks for a significant number of different applications. How-ever, as for any large scale experimental infrastructure, there are surely bugs in this software. We hope that they only change marginal quantitative things, and not the qualita-tive essence of our findings. Our infrastructure is publicly available on Github.
5.
RELATED WORK
a d d F u n c t i o n ( M y F u n c t i o n c ) { i f ( c == null ) c = new FunA () ;
// SUA #1:
for ( int i = 0; i < 100; i ++) s i n S u m += c . c a l c ( i ) ;}
Listing 10: SUA 1. Differents inputs in ’c’ define performance
a p p e n d S o r t e d ( A r r a y L i s t < Integer > a , int value ) { // SUA #2: a . add ( v a l u e ) ; // SUA #3: a . s o r t (new C o m p a r a t o r < Integer >() { c o m p a r e ( I n t e g e r o1 , I n t e g e r o2 ) { return o1 - o2 ;}}) ;}
Listing 11: Segments 2 and 3
// SUA #4
a n g l e += M a t h . abs ( M a t h . sin ( y ) ) / PI ;
// SUA #5
double c = x * y ;
Listing 12: SUAs 4 and 5
generates the payload of a microbenchmark. However, there are works related to many aspect of AutoJMH.
Performance Analysis.
The proper evaluation of performance is the subject of a large number of papers [13, 24, 2, 18, 9]. They all point out non-determinism as the main barrier to obtain repeat-able measurements. Sources of non-determinism arise in the data, the code [20], the compiler[24], the virtual machine[14] the operating system [24] and even in the hardware[10]. Various tools and techniques aim at minimizing the effect of non-determinism at each level of abstraction[24, 10, 14]. JMH stands at the frontier between code and the JVM by carefully studying how code triggers JVM optimizations[1]. AutoJMH is at the top of the stack, automatically generat-ing code for the JMH payload, avoidgenerat-ing unwanted optimiza-tions that may skew the measurements.
Microbenchmarking determines with high precision the execution time of a single point. This is complementary to other techniques that use profiling [31, 5] and trace anal-ysis [16, 15] that cover larger portions of the program at the cost of reducing the measurement precision. Symbolic exe-cution is also used to analyze performance [8, 36] however, symbolic execution alone cannot provide execution times. Finally several existing tools are specific for one type of bug [26, 27] or even for one given class of software, like the one by Zhang [36] which generates load test for SQL Servers.
AutoJMH is a tool that sits between profiling/trace anal-ysis and microbenchmarking, providing execution times for many individuals points of the program with high precision.
Performance testing in isolation.
Specially close to our work are the approaches of Hork`y [18, 17], Kuperberg [22] and Pradel [28].
Microbenchmarking, and therefore AutoJMH, evaluate performance by executing one segment of code in isolation. A simpler alternative favored by industry are performance unit tests [10, 11], which consist in measuring the time a unit test takes to run. Hork`y et.al. proposes methodologies and tools to improve the measurements that can be obtained using performance unit tests uses, unlike AutoJMH, which uses unit tests only to collect initialization data. Kuperberg creates microbenchmarks for Java APIs using the compiled bytecode. Finally, Pradel proposes a test generator tailored for classes with high level of concurrency, while AutoJMH uses the JMH built-in support for concurrency. All these approaches warm-up the code and recognize the intrinsic non-determinism of the executions.
The main distinctive feature of AutoJMH over these sim-ilar approaches is its unique capability to measure at the statement level. These other approaches generate test exe-cution for whole methods at once. Baudry [6] shows that
some methods use code living as far as 13 levels deep in the call stack, which gives us an idea of how coarse can be ex-ecuting a whole test method. AutoJMH is able to measure both complete methods and statements as atomic as a single assignment. During the warm-up phase the generated JHM payload wrapper method gets in-lined and therefore, the mi-crobenchmark loop do actually execute statements. Another important distinction if that AutoJMH uses data extracted from an expected usage of the code, (i.e. the unit tests). Pradel uses randomly generated synthetic data, which may produce unrealistic performance cases. For example, JIT in-lining is a very common optimization that improves per-formance in the usual case, while reducing it in less usual cases. The performance improvement of this well known op-timization is hard to detect assuming that all inputs have the same probability of occurrence.
Program Slicing.
AutoJMH creates a compilable slice of a program which can be executed, stays in stable state and is not affected un-wanted optimizations. Program slicing is a well established field [33]. However, to the best of our knowledge, no other tool creates compilable slices with the specific purpose of microbenchmarking.
6.
CONCLUSION AND FUTURE WORK
In this paper, we propose a combination of static and dy-namic analysis, along with code generation to automatically build JMH microbenchmarks. We present a set of code gen-eration strategies to prevent runtime optimizations on the payload, and instrumentation to record relevant input values for the SUA. The main goal of this work is to support Java developers who want to develop microbenchmarks. Our ex-periments show that AutoJMH does generate microbench-marks as accurate as those handwritten by performance en-gineers and better than the ones built by professional Java developers without experience in performance assessment. We also show that AutoJMH is able to analyze and extract thousands of loops present mature Java applications in order to generate correct microbenchmarks.
Even when have addressed the most common pitfalls found in the current microbenchmarks today, we are far from be-ing able to handle all possible optimizations and situations detrimental for microbenchmark design, therefore, our fu-ture work will consist in further improve AutoJMH to ad-dress these situations.
7.
ACKNOWLEDGMENTS
We would like to thank Aleksey Shipilev for reviewing the ‘Expert’ set of microbenchmarks and providing key com-ments and valuable insights on this work.
8.
REFERENCES
[1] Aleksey Shipilev. Java Microbenchmarks Harness (the lesser of two evils). http://shipilev.net/talks/
devoxx-Nov2013-benchmarking.pdf, 2013.
[2] Aleksey Shipilev. Java Benchmarking as easy as two timestamps. http://shipilev.net/talks/
jvmls-July2014-benchmarking.pdf, July 2014. [3] Aleksey Shipilev. Nanotrusting the nanotime.
http://shipilev.net/blog/2014/nanotrusting-nanotime, Oct. 2014.
[4] Aleksey Shipilev. The Black Magic of (Java) Method Dispatch. http://shipilev.net/blog/2015/
black-magic-method-dispatch/, 2015.
[5] E. Altman, M. Arnold, S. Fink, and N. Mitchell. Performance Analysis of Idle Programs. In Proceedings of the ACM International Conference on Object Oriented Programming Systems Languages and Applications, OOPSLA ’10, pages 739–753, New York, NY, USA, 2010. ACM.
[6] B. Baudry, S. Allier, M. Rodriguez-Cancio, and M. Monperrus. Automatic Software Diversity in the Light of Test Suites. arXiv:1509.00144 [cs], Sept. 2015. arXiv: 1509.00144.
[7] Brian Goets. Java theory and practice: Anatomy of a flawed microbenchmark. http:
//www.ibm.com/developerworks/library/j-jtp02225/, Feb. 2005.
[8] J. Burnim, S. Juvekar, and K. Sen. WISE: Automated Test Generation for Worst-case Complexity. In Proceedings of the 31st International Conference on Software Engineering, ICSE ’09, pages 463–473, Washington, DC, USA, 2009. IEEE Computer Society. [9] Cliff Click. The Art of Java Benchmarking.
http://www.azulsystems.com/presentations/ art-of-java-benchmarking, June 2010.
[10] C. Curtsinger and E. D. Berger. STABILIZER: Statistically Sound Performance Evaluation. In Proceedings of the Eighteenth International Conference on Architectural Support for Programming Languages and Operating Systems, ASPLOS ’13, pages 219–228, New York, NY, USA, 2013. ACM.
[11] David Astels. Test-Driven Development: A Practical Guide: A Practical Guide. Prentice Hall, Upper Saddle River, N.J.; London, 1 edition edition, July 2003. [12] Dmitry Vyazalenko. Using JMH in a real world
project. https://speakerdeck.com/vyazelenko/ using-jmh-in-a-real-world-project, Oct. 2015. [13] A. Georges, D. Buytaert, and L. Eeckhout.
Statistically Rigorous Java Performance Evaluation. In Proceedings of the 22Nd Annual ACM SIGPLAN Conference on Object-oriented Programming Systems and Applications, OOPSLA ’07, pages 57–76, New York, NY, USA, 2007. ACM.
[14] A. Georges, L. Eeckhout, and D. Buytaert. Java Performance Evaluation Through Rigorous Replay Compilation. In Proceedings of the 23rd ACM SIGPLAN Conference on Object-oriented
Programming Systems Languages and Applications, OOPSLA ’08, pages 367–384, New York, NY, USA, 2008. ACM.
[15] M. Grechanik, C. Fu, and Q. Xie. Automatically Finding Performance Problems with
Feedback-directed Learning Software Testing. In Proceedings of the 34th International Conference on Software Engineering, ICSE ’12, pages 156–166, Piscataway, NJ, USA, 2012. IEEE Press. [16] S. Han, Y. Dang, S. Ge, D. Zhang, and T. Xie.
Performance Debugging in the Large via Mining Millions of Stack Traces. In Proceedings of the 34th International Conference on Software Engineering, ICSE ’12, pages 145–155, Piscataway, NJ, USA, 2012. IEEE Press.
[17] V. Horky, P. Libic, L. Marek, A. Steinhauser, and P. Truma. Utilizing Performance Unit Tests To Increase Performance Awareness. In Proceedings of the 6th ACM/SPEC International Conference on
Performance Engineering, ICPE ’15, pages 289–300, New York, NY, USA, 2015. ACM.
[18] V. Horky, P. Libic, A. Steinhauser, and P. Truma. DOs and DON’Ts of Conducting Performance Measurements in Java. In Proceedings of the 6th ACM/SPEC International Conference on
Performance Engineering, ICPE ’15, pages 337–340, New York, NY, USA, 2015. ACM.
[19] W. K. Josephson, L. A. Bongo, K. Li, and D. Flynn. DFS: A File System for Virtualized Flash Storage. Trans. Storage, 6(3):14:1–14:25, Sept. 2010.
[20] Julien Ponge. Avoiding Benchmarking Pitfalls on the JVM. Oracle Java Magazine, Aug. 2014.
[21] Julien Ponge. Revisiting a (JSON) Benchmark. https: //julien.ponge.org/blog/revisiting-a-json-benchmark/, Sept. 2014.
[22] M. Kuperberg, F. Omri, and R. Reussner. Automated Benchmarking of Java APIs.
[23] E. Liarou, R. Goncalves, and S. Idreos. Exploiting the Power of Relational Databases for Efficient Stream Processing. In Proceedings of the 12th International Conference on Extending Database Technology: Advances in Database Technology, EDBT ’09, pages 323–334, New York, NY, USA, 2009. ACM. [24] T. Mytkowicz, A. Diwan, M. Hauswirth, and P. F.
Sweeney. Producing Wrong Data Without Doing Anything Obviously Wrong! In Proceedings of the 14th International Conference on Architectural Support for Programming Languages and Operating Systems, ASPLOS XIV, pages 265–276, New York, NY, USA, 2009. ACM.
[25] A. P. Navik, M. A. Zaveri, S. V. Murthy, and M. Dawarwadikar. Microbenchmark Based
Performance Evaluation of GPU Rendering. In N. R. Shetty, N. H. Prasad, and N. Nalini, editors, Emerging Research in Computing, Information, Communication and Applications, pages 407–415. Springer India, 2015. DOI: 10.1007/978-81-322-2550-8 39.
[26] A. Nistor, P.-C. Chang, C. Radoi, and S. Lu. Caramel: Detecting and Fixing Performance Problems That Have Non-intrusive Fixes. In Proceedings of the 37th International Conference on Software Engineering -Volume 1, ICSE ’15, pages 902–912, Piscataway, NJ, USA, 2015. IEEE Press.
[27] O. Olivo, I. Dillig, and C. Lin. Static Detection of Asymptotic Performance Bugs in Collection
Traversals. In Proceedings of the 36th ACM SIGPLAN Conference on Programming Language Design and
Implementation, PLDI 2015, pages 369–378, New York, NY, USA, 2015. ACM.
[28] M. Pradel, M. Huggler, and T. R. Gross. Performance Regression Testing of Concurrent Classes. In
Proceedings of the 2014 International Symposium on Software Testing and Analysis, ISSTA 2014, pages 13–25, New York, NY, USA, 2014. ACM.
[29] N. Rajovic, A. Rico, J. Vipond, I. Gelado, N. Puzovic, and A. Ramirez. Experiences with Mobile Processors for Energy Efficient HPC. In Proceedings of the Conference on Design, Automation and Test in Europe, DATE ’13, pages 464–468, San Jose, CA, USA, 2013. EDA Consortium.
[30] C. J. Rossbach, J. Currey, M. Silberstein, B. Ray, and E. Witchel. PTask: Operating System Abstractions to Manage GPUs As Compute Devices. In Proceedings of the Twenty-Third ACM Symposium on Operating Systems Principles, SOSP ’11, pages 233–248, New York, NY, USA, 2011. ACM.
[31] D. Shen, Q. Luo, D. Poshyvanyk, and M. Grechanik. Automating Performance Bottleneck Detection Using Search-based Application Profiling. In Proceedings of the 2015 International Symposium on Software Testing and Analysis, ISSTA 2015, pages 270–281, New York, NY, USA, 2015. ACM.
[32] M. J. Steindorfer and J. J. Vinju. Optimizing Hash-array Mapped Tries for Fast and Lean Immutable JVM Collections. In Proceedings of the 2015 ACM SIGPLAN International Conference on Object-Oriented Programming, Systems, Languages, and Applications, OOPSLA 2015, pages 783–800, New York, NY, USA, 2015. ACM.
[33] F. Tip. A Survey of Program Slicing Techniques. Technical report, CWI (Centre for Mathematics and Computer Science), Amsterdam, The Netherlands, The Netherlands, 1994.
[34] L. Torczon and K. Cooper. Engineering A Compiler. Morgan Kaufmann Publishers Inc., San Francisco, CA, USA, 2nd edition, 2011.
[35] D. Weise, R. F. Crew, M. Ernst, and B. Steensgaard. Value Dependence Graphs: Representation Without Taxation. In Proceedings of the 21st ACM
SIGPLAN-SIGACT Symposium on Principles of Programming Languages, POPL ’94, pages 297–310, New York, NY, USA, 1994. ACM.
[36] P. Zhang, S. Elbaum, and M. B. Dwyer. Automatic Generation of Load Tests. In Proceedings of the 2011 26th IEEE/ACM International Conference on Automated Software Engineering, ASE ’11, pages 43–52, Washington, DC, USA, 2011. IEEE Computer Society.