Vous avez des questions? Nous pouvons vous aider. Pour communiquer directement avec un auteur, consultez la première page de la revue dans laquelle son article a été publié afin de trouver ses coordonnées. Si vous n’arrivez pas à les repérer, communiquez avec nous à [email protected].
Questions? Contact the NRC Publications Archive team at
[email protected]. If you wish to email the authors directly, please see the first page of the publication for their contact information.
https://publications-cnrc.canada.ca/fra/droits
L’accès à ce site Web et l’utilisation de son contenu sont assujettis aux conditions présentées dans le site LISEZ CES CONDITIONS ATTENTIVEMENT AVANT D’UTILISER CE SITE WEB.
READ THESE TERMS AND CONDITIONS CAREFULLY BEFORE USING THIS WEBSITE. https://nrc-publications.canada.ca/eng/copyright
NRC Publications Archive Record / Notice des Archives des publications du CNRC :
https://nrc-publications.canada.ca/eng/view/object/?id=d8fd40e7-1a72-4bf1-9478-85f83b29c8c2
https://publications-cnrc.canada.ca/fra/voir/objet/?id=d8fd40e7-1a72-4bf1-9478-85f83b29c8c2
Archives des publications du CNRC
This publication could be one of several versions: author’s original, accepted manuscript or the publisher’s version. / La version de cette publication peut être l’une des suivantes : la version prépublication de l’auteur, la version acceptée du manuscrit ou la version de l’éditeur.
Access and use of this website and the material on it are subject to the Terms and Conditions set forth at
Influence of velocity on ice-cone interaction
M. LAU
C-CORE, Memorial University of Newfoundland, St. John’s, Newfoundland A1B 3X5, Canada
S.J. JONES
Institute for Marine Dynamics, National Research Council of Canada, St. John’s, Newfoundland A1B 3T5, Canada
R. PHILLIPS
and R.F. MCKENNA
C-CORE, Memorial University, St. John’s, Newfoundland A1B 3X5, Canada
Abstract
A series of upward breaking cone tests was conducted at NRC/IMD’s ice tank in level ice using
EG/AD/S correct density model ice. Cone angles of 45o and 60o were tested. The effect of ice
draft velocity in the range 0.005 to 0.5 m/s was studied for ice thicknesses ranging from 35 to 110 mm. The mean peak forces in both horizontal and vertical directions were measured and found to be almost independent of Froude Number below 0.02, but increased significantly at higher Froude Numbers. The effect of speed for upward breaking conditions was found to be less than similar conditions for downward breaking cones.
1. Introduction
For many structures, a conical form at the water line is superior to a cylindrical form or vertical flat surfaces, since this configuration reduces ice loads by causing the ice to fail in bending. Observations from early experiments show that bending failure is dominant under interaction at
low structure inclination angles from the horizontal (10o to 60o), low ice-cone friction
coefficients, low ice thickness, and low ice speeds. With increasing inclination, roughness of the cone surface, and ice thickness, the dominated failure mode can change gradually from bending to shear or crushing. At higher speeds, the failure mode also changes abruptly from bending to shear or crushing due to dynamic effects (Lau et al., 1999; Wessels, 1984; Sodhi, 1987). The speed at which the transition of failure modes takes place was found to increase with an increase in the inclination angle (Haynes et al., 1983). The influence of shear stresses on determining failure modes becomes more important with increasing ice thickness and predominates for thick ice covers (Lau et al., 1999; Maattanen, 1986). Observation of actual fracture patterns in thin ice reveals that pure bending occurs when circumferential cracks form at distances slightly greater than the characteristic length. With an increase in ice thickness, the average length of broken pieces decreases, which may indicate a combination of bending and shear failures (Lau et al., 1999 and 1991a).
Model tests with conical structures in level ice have been carried out in the ice tank at the Institute for Marine Dynamics (Lau et al., 1988; Lau and Williams, 1991a and 1991b; Lau et
al., 1993, Spencer et al., 1993). A recent experiment has extended previous model test results
by expanding the range of ice thicknesses and speeds. This paper presents the influence of model speed on ice loads and associated failure modes for velocities between 0.005 and 0.5 m/s.
2. Scaling Issues
It has been shown (Atkins and Mai, 1985) that for the case of geometrically similar linear elastic structures under monotonic loading:
ú û ù ê ë é ú û ù ê ë é = Cm Cp m p K K σ λ σ 1 (1)
where s is the strength, l is the geometric scaling factor, KC is the critical stress intensity factor,
and the subscripts m and p refer to model and prototype respectively. Then, by equating inertia and cracking forces they obtained:
n Cm m m m Cp p p p I K L V K L V = = 2 1 2 2 1 2 r r (2)
where In is a new “Ice Number” introduced by Atkins (1975), V is the velocity, r is the density,
and L is the length. If we use Froude’s law, which arises from equating inertia and gravity
(wave-making) forces, for velocity scaling, Vp = lVm, then we obtain:
2 3 l r r m p Cm Cp K K = (3)
and hence from equation (1) above:
p p m m s r r l s = 1 (4)
Equation (3) is the condition for scaling ice toughness at Froude speeds. Equation (4) is the rule by which model ice strength should be scaled in order to satisfy both Froude’s law and the
cracking law given by equation (1). Since in most ice tanks (or any difference is
ignored) it is seen that the tank ice strength should be reduced directly as the linear scaling factor. This is the normal approach taken by ice tanks in testing ships and structures in ice and it works quite well. Unfortunately, equation (3) is not well obeyed since the model ice is not stiff enough and not sufficiently brittle (Timco, 1986).
p m r
r =
The main reason for this work was to determine if the forces on a conical upward breaking structure were dependent on velocity. If they were, Froude scaling (or something similar) would be important; if not, Froude scaling, which works well for ships tested in water, might be unnecessary for icebreaking ships/structures. Another reason for this work was to obtain data to compare with centrifuge modeling results (Barrette et al., 2000).
3. Model Tests
Dn Dc a 6-component load frame Hn HcFigure 1. Schematic of the test set-up showing the 6-component load frame and the cone models with the following dimension:
Model a (o) D
c (m) Dn (m) Hc (m) Hn (m)
1 45 1.23 0.6 0.546 0.5
2 60 0.94 0.6 0.315 0.6
The experiments were carried out in CD-EG/AD/S (Correct Density – Ethylene Glycol/Aliphatic Detergent/Sugar) model ice developed by Spencer and Timco (1990). With inclusions of air bubbles into the growing ice sheet, this model ice significantly improves scaling of ice density, elastic and fracture properties. The anisotropy associated with the columnar crystal structure of the model ice provides a suitable representation of the three dimensional distributions of stress in the prototype ice and gives a good ratio of shear to flexural failure stresses. The percentage concentrations of EG/AD/S for the
present test series were 0.39/0.27/0.01
and the ice density was about 870 kg/m3. The model ice area was 12 m x 76 m. For each ice sheet, flexural
strength sf and shear strength ss were
measured frequently throughout the test
period. The values reported at test time are interpolated from the strength versus time curves for the ice sheet. Flexural strength was measured using in-situ cantilever beams. A set of 4 or 5 beams with proportions of thickness:width:length of 1:2:5 was tested at each location in either upward or downward loading directions. Shear strength measurement was performed immediately after the flexural strength test to provide index values for comparison with the measured flexural strengths. For the shear tests, an ice sample was positioned on a horizontal plate with a 38 mm diameter hole in it and a metal punch with a diameter of 32.5 mm was forced through it. The 5.5 mm difference in diameter ensured that failure occurred along the grain boundaries of the columnar EG/AD/S ice as opposed to through the individual crystals. The ratio of shear strength to upward breaking flexural strength varied from 1.6 to 2.6. The reported ice thickness, h, is the average over approximately 65 measurements for the ice sheet along the test path. The procedures for producing and characterizing level ice sheets are described in more detail in Jones (1993).
While a 45o cone was used for most of the tests, a number of tests were conducted
using a 60o cone to assess the effect of cone angle. The models were mounted rigidly to the
towing carriage through a six-component force dynamometer (Lau et al., 1993). The model dimensions are shown in Figure 1. The models were towed at constant speeds through a fixed ice sheet. The transducer outputs were sampled digitally at 500 Hz, and filtered at 100 Hz to capture the possible high frequencies at high speed due to shearing and crushing failure. The model surface was finished to a friction coefficient of 0.15 with Dupont’s Imron paint. Five
1
video recordings were made of each test: one on the starboard side, one looking down ahead of the model, one ahead of the model near the ice surface, and two underwater cameras looking up ahead of the model.
The test matrix for the experimental program is given in Table 1. The 45o cone was
tested at 1.23 m diameter waterline and ice thicknesses of 33.8, 52.1, 80.1 and 115.1 mm. The
60o cone was tested at 0.94 m diameter waterline, and ice thicknesses of 33.9 and 116.9 mm.
Each ice sheet was tested over a velocity range of 0.005, 0.01, 0.05, 0.1, 0.25 and 0.5 m/s. Ice strength varied from sheet to sheet with upward breaking strength ranging from 34 to 43 kPa. The variation in ice strength within each sheet during these tests was kept within 2.5 kPa. The cones were also towed in open water over the same range of velocity and the forces were measured.
Table 1. Matrix of the experimental program
Cone Angle, a (o) 45 60
Cone Waterline, Dc (m) 1.23 0.94
Ice Sheet Thickness, h (mm) 34, 52, 80, 115 34, 117
Upward Breaking Flexural
Strength, sf (kPa) 34 – 43
Ice Velocity, V(m/s) 0.005, 0.01, 0.05, 0.1, 0.25, 0.5
4. Test Results
4.1. 45
oCONE
The interaction process with the 45o cone was similar to that observed from previous tests with
sloping structures in the range of velocity tested. The failure mechanism was typically governed by the flexural stresses induced in ice in both the radial and circumferential directions by the bending of the ice sheet, as shown in Figure 2. Figure 3 gives the time record of a typical test
with the 45o cone illustrating the cyclical nature of the loading. Figure 4 shows the increase of
mean peak forces with ice velocity. “Mean peak force” is the mean of the icebreaking peaks over the steady-state portion of the ice-cone interaction. The increase in force was negligible for velocities less than 0.2 m/s but it increased substantially for velocities greater than 0.25 m/s. The increase was greater for thicker ice as shown in Figure 5, in which the ice force increase over that measured at 0.005 m/s is plotted against ice thickness.
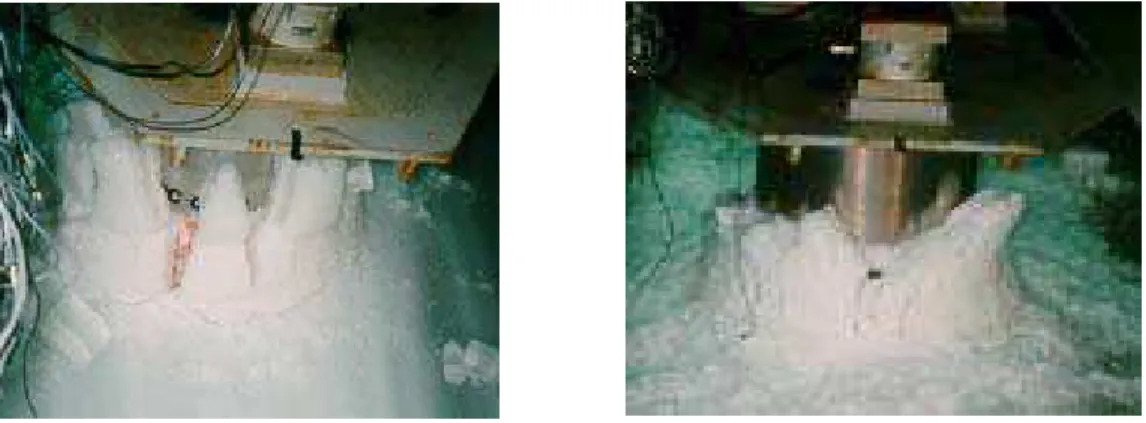
Figure 2. Photograph showing a typical ice interaction with the 45o cone: ice thickness equal to 115 mm and ice velocity equal to 0.01 m/s.
Figure 3. Typical force time records for tests
with the 45ocone: ice thickness equal to 115 mm and ice velocity equal to 0.01 m/s.
b 0 500 1000 1500 2000 2500 3000 3500 4000 0 0.2 0.4 0.6 Ice Velocity V (m/s) V e rt ical M e an P e ak For c e Fv (N ) h = 34 mm h = 52 mm h = 80 mm h = 115 mm a 0 500 1000 1500 2000 2500 3000 3500 4000 0 0.2 0.4 0.6 Ice Velocity V (m/s) H o ri zo n tal M ean P eak For c e Fh (N ) h = 34 mm h = 52 mm h = 80 mm h = 115 mm
Figure 4. Mean peak forces versus ice velocity for 45o cone in various ice thicknesses: (a) horizontal force and
(b) vertical force. a -200 0 200 400 600 800 1000 1200 1400 20 40 60 80 100 120 Ice Thickness h (mm) In creases o f F h fr om Fh @ 0.005 m/s (N ) V = 0.01 m/s V = 0.05 m/s V = 0.10 m/s V = 0.25 m/s V = 0.50 m/s b -200 0 200 400 600 800 1000 1200 1400 20 40 60 80 100 120 Ice Thickness h (mm) In c reases o f Fv fr o m F v @ 0. 005 m /s (N ) V = 0.01 m/s V = 0.05 m/s V = 0.10 m/s V = 0.25 m/s V = 0.50 m/s
Figure 5. The increase of ice force over ice force measured at ice velocity equal to 0.005 m/s versus ice thickness
4.2. 60
oCONE
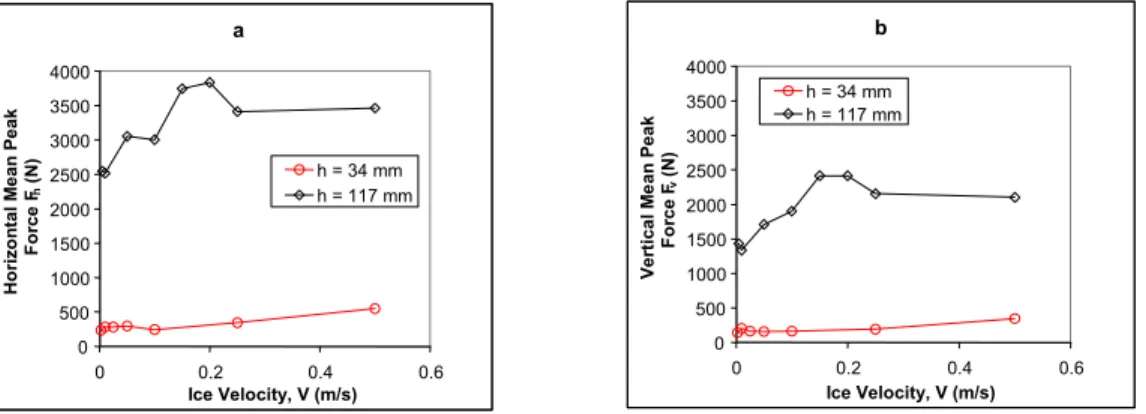
A similar trend was observed for the 60o cone in thin ice. However, for ice thickness equal to
117 mm, the failure mode changed abruptly to shear at velocities greater than a transitional velocity of about 0.15 m/s (Figure 6). Shearing of the ice edge along the grain boundaries of the columnar model ice occurred before any circumferential crack could form, resulting in small
columnar ice chips with cross-sectional dimensions less than 15 X 10 mm2 (Figure 7) and a high
frequency cyclical loading (Figure 8). The distance between circumferential cracks was about 130 mm prior to the change of failure mode. The contact surface after failure was very rugged resulting in non-simultaneous failure along the cone/ice contact. The channel formed by the model’s passage appeared very regular at the approximate width of the waterline diameter (Figure 7). The ice chips rode up and cleared around the cone with a lesser amount of ride-up as shown in Figure 6b. Figure 9 shows the influence of ice velocity on the horizontal and vertical
mean peak forces for the 60o cone. There was a larger increase in ice force with increase of ice
Figure 6. Photographs showing 117 mm ice interaction with 60ocone at velocity below (left plate: ice velocity of
0.1m/s) and above (right plate: ice velocity of 0.25 m/s) the transitional speed.
Figure 8. Typical force time records for tests
with the 60o cone tested at high speed (ice velocity of 0.25 m/s)
Figure 7. Photograph showing small columnar
ice chips left at the wake of the 60o cone tested at high speed (ice velocity of 0.25 m/s)
velocity up to the transitional speed when compared with the 45o cone (Figure 4) for the same ice thickness. Again, the increase was greater for the thicker ice. For the 117 mm thick ice, the force increased rapidly with velocity until a transition velocity was reached, and after which the ice force dropped to an almost constant level, when shearing of the ice edge predominated.
The data from this test series suggest that thicker ice and a steeper cone angle accentuate the influence of ice velocity on ice load and lead to a change in failure mode. The increase in ice load on both cones was more than 1 kN with the thicker ice for an ice velocity of 0.5 m/s. Water resistance contributed less than 50N to these increases as estimated from the open water resistance data.
b 0 500 1000 1500 2000 2500 3000 3500 4000 0 0.2 0.4 0.6 Ice Velocity, V (m/s) V e rt ical M e an P eak For c e Fv (N ) h = 34 mm h = 117 mm a 0 500 1000 1500 2000 2500 3000 3500 4000 0 0.2 0.4 0.6 Ice Velocity, V (m/s) H o ri zo n tal M e an P eak For c e Fh (N ) h = 34 mm h = 117 mm
Figure 9. Mean peak forces versus ice velocity for the 60o cone in two ice thicknesses: (a) horizontal force and
(b) vertical force.
5. Comparison with Downward
Breaking Cones
Figure 10 shows the non-dimensional horizontal mean peak force versus Froude Number for all data presented in this paper. The non-dimensional force was the actual force divided by the force measured at 0.01 m/s in the same ice sheet, where the velocity effect is negligible. The Froude Number was
calculated as V/(gh)0.5 where g is the
gravitational constant. The solid
symbols are for the 45o cone and the
hollow symbols are for the 60o cone. A
previous set of data obtained with the same cones tested in the inverted orientation (downward breaking) was
Fnon = 1.03e0.77Fr Fnon = 1.06e1.64Fr 0 1 2 3 4 5 0.001 0.01 0.1 1 Froude Number, Fr = V/(gh)1/2 N on-D im . H o ri z ont al M ean P eak Force, Fno n =F h /Fh , @ V = 0 .01m/ s 45 deg., 34 mm 45 deg., 53 mm 45 deg., 80 mm 45 deg., 115 mm 60 deg., 34 mm 60 deg., 117 mm Lau et al, 1988 Expon. (Present Series) Expon. (Lau et al, 1988)
Figure 10. A plot of non-dimensional horizontal mean peak force versus Froude Number showing the effect of ice velocity. The crosses are for the inverted cones and the other symbols are for the present test series.
plotted on the figure (the crosses) for comparison. Figure 10 shows a dependency of the ice force ratio on Froude Number, despite the scattering of data. For Froude Numbers less than 0.02, the velocity was negligible. The forces increased with increasing Froude Number for Froude Numbers greater than 0.02. The effect of velocity is greater with the inverted
(downward breaking)cones, because the broken ice fragments have to move through the water
in the downward breaking configuration, and hence are subjected to water drag and added mass. The Froude Number is a ratio of inertia and gravity forces and is used in momentum transfer in general. Maintaining this ratio is important for modeling ships in ice where the hydrodynamical similitude is required. Figure 10 gives an assessment of the degree of importance this number had in ice-cone interaction modeling. The Confederation Bridge between PEI and New Brunswick uses piers with upward breaking cones. At the bridge, level ice thickness can reach 1 m, velocities have been measured up to 1 m/s, giving a Froude Number of 0.3. From the curve of Figure 10, the increase in force due to velocity is then approximately 30% for an upward breaking cone. If ice velocity reaches 1.5 m/s, the increase is 45%.
6. Conclusions
The results from a series of tests of 45o and 60o upward breaking cones in level ice are
presented. This experiment has extended previous model test results by expanding the range of ice thicknesses and speeds. The mean peak force in both horizontal and vertical directions was found to be almost independent of velocity below 0.2 m/s, but increased significantly at higher velocities. The data suggest that thicker ice and a steeper cone angle accentuate the influence of ice velocity on ice load and lead to a change in failure mode. The effect of speed was found to be less than that for tests conducted with downward breaking cones under similar conditions. The results suggested that Froude scaling will be important in ice-cone interaction modeling, if the Froude Number of the models exceeds 0.02.
7. Acknowledgments
The investigations presented in this paper were partially funded by a NRC/NSERC Research Partnership grant. Brian Hill, Chris Meadus, and Austin Bugden of IMD provided technical assistance. We gratefully acknowledge their support.
References
Atkins, A.G., 1975. Icebreaker modeling, J. Ship Research, 19, 1, pp. 40-43.
Atkins, A.G., and Y.W. Mai, 1985. Elastic and Plastic Fracture, Ellis Horwood Ltd., Chicester.
Barrette, P.D., Lau, M., Phillips, R., McKenna, R.F. and S.J. Jones, 2000. Interaction between level ice and conical structures: centrifuge simulations Phase II, Proc. 19th Int. Conf. On Offshore Mechanics and Arctic Engineering (OMAE 2000), ASME, New York, Paper # P&A 1004.
Haynes, F.D., Sodhi, D.S., Kato, K., and K. Hirayama, 1983. Ice forces on model bridge piers, CRREL Report 83-19, U.S. Army CRREL, Hanover, N.H.
Jones, S.J., 1993. Ice tank test procedures at the Institute for Marine Dynamics, Laboratory Memorandum LM-AVR-20, National Research Council of Canada, Institute for Marine Dynamics, St. John’s, Newfoundland.
Lau, M., Jones, S.J., Tucker, J.R., and D.B. Muggeridge, 1993. Model ice ridge forces on a multi-faceted cone, Proc. 12th Intl. Conf. on Port and Ocean Engineering under Arctic Conditions (POAC 93), Vol. 2, Hamburg, pp. 537-546.
Lau, M., and F.M. Williams, 1991a. Model ice forces on a downward breaking cone, Proc. 11th Intl. Conf. on Port and Ocean Engineering under Arctic Conditions (POAC 91), Vol. 1, St. John's, Newfoundland, pp. 167-184.
Lau, M., and F.M. Williams, 1991b. Model ice ridge forces on a downward breaking cone, Proc. 10th Int. Conf. on Offshore Mechanics and Arctic Engineering (OMAE 91), ASME, New York, Vol.4, pp. 163-170.
Lau, M., Muggeridge, D.B., and F.M. Williams, 1988. Model tests of fixed and free floating downward breaking cones in ice. Proc. 7th Intl. Conf. on Offshore Mechanics and Arctic Engineering (OMAE 88), ASME, New York, pp. 239-247.
Lau, M., Molgaard, J., Williams, F.M., and A.S.J. Swamidas, 1999. An analysis of ice breaking pattern and ice piece size around sloping structures, Proc. 18th Intl. Conf. on Offshore Mechanics and Arctic Engineering (OMAE 99), ASME, New York, Paper # 1151.
Maattanen, M., 1986. Ice sheet failure against an inclined wall, Proc. 8th IAHR Ice Symp., Vol. 1, Iowa City, pp. 149-158.
Sodhi, D.S., 1987. Dynamic analysis of failure modes on ice sheets encountering sloping structures, Proc. 6th Intl. Conf. on Offshore Mechanics and Arctic Engineering (OMAE 87), Vol. 4, ASME, New York, pp. 281-284.
Spencer, D., McKenna, R., and Lau, M., 1993. Ice model tests of a 60o upward breaking bridge pier for the Northumberland Strait Crossing, NRC/IMD Report TR-1993-05, National Research Council of Canada, Institute for Marine Dynamics, St. John's, Newfoundland.
Spencer, D.S. and G.W. Timco, 1990. CD model ice – A process to produce correct density (CD) model ice, Proc.10th International IAHR Symp. on Ice, Vol. 2, Espoo, Finland, pp. 745-755.
Timco, G.W., 1986. EG/AD/S: a new type of model ice for refrigerated towing tanks, Cold Regions Science and Technology, 12, pp. 175-195.
Wessels, E., 1984. Model test investigation of ice forces on fixed and floating conical structures, Proc. 7th International IAHR Symp. on Ice, Vol. 3, Hamburg, pp. 203-220.