HAL Id: hal-02064326
https://hal.archives-ouvertes.fr/hal-02064326
Submitted on 11 Mar 2019
HAL is a multi-disciplinary open access
archive for the deposit and dissemination of
sci-entific research documents, whether they are
pub-lished or not. The documents may come from
teaching and research institutions in France or
abroad, or from public or private research centers.
L’archive ouverte pluridisciplinaire HAL, est
destinée au dépôt et à la diffusion de documents
scientifiques de niveau recherche, publiés ou non,
émanant des établissements d’enseignement et de
recherche français ou étrangers, des laboratoires
publics ou privés.
Freddy Odille, Alberto Battaglia, Philip Hoyland, Jean-Marc Sellal, Damien
Voilliot, Christian de Chillou, Jacques Felblinger
To cite this version:
Freddy Odille, Alberto Battaglia, Philip Hoyland, Jean-Marc Sellal, Damien Voilliot, et al.. Catheter
treatment of ventricular tachycardia: a reference-less pace-mapping method to identify ablation
tar-gets. IEEE Transactions on Biomedical Engineering, Institute of Electrical and Electronics Engineers,
2019, 66 (11), pp.3278-3287. �10.1109/TBME.2019.2903631�. �hal-02064326�
Abstract—Objective: A novel method is developed to identify
ablation targets for the catheter treatment of ventricular tachycardia (VT). Methods: The method is based on
pace-mapping, which is a validated technique to determine the catheter ablation targets. Conventionally, it consists of stimulating the heart ventricle from various sites and comparing the resulting activation pathways to that of a clinical VT, by analysis of surface electrocardiograms (ECG). In this work a novel pace-mapping method is presented, that does not require a reference ECG recording of the VT. A 3D correlation gradient map is reconstructed by semi-automatic analysis of ECG morphological changes within the network of pace-mapping sites. In these maps, abnormal points are identified by high correlation gradient values (i.e. corresponding to slow propagation of the electric influx, as in the core of the reentrant VT circuit). The relation between the conventional and reference-less method is described theoretically and evaluated in a retrospective study including 24 VT ablation procedures. Results: The “reference-less” method was able to
identify normal points with a high accuracy (negative predictive value: NPV=97%) and to detect more abnormal points, as predicted by the theory. Correlation gradients computed by the proposed method were significantly higher in ablation zones than in other zones of the ventricle (p<10-12), indicating excellent
prediction of the ablation targets. Significance: The reference-less
method might either be used in complement of the conventional method, or to treat patients in whom VT cannot be induced during the intervention.
Index Terms—Arrhythmia, radiofrequency catheter ablation,
cardiac interventional electrophysiology, electrocardiography.
I. INTRODUCTION
ATIENTS who go through a myocardial infarction have a significant risk of developing, after several years, a ventricular tachycardia (VT), which is a life-threatening arrhythmia. The infarcted heart region indeed undergoes a remodeling process during which damaged myocardial tissue is
This study was funded by the French "Investments for the Future" program under grant number ANR-15-RHU-0004. The authors also thank INSERM, CPER 2007-2013, Région Lorraine and FEDER for the funding of the Niobe Magnetic Navigation System, Stereotaxis Inc. F. Odille and A. Battaglia contributed equally to this work. C. de Chillou and J. Felblinger contributed equally to this work.
F. Odille and J. Felblinger are with IADI, Inserm and Université de Lorraine, Nancy, France, and with CIC-IT 1433, Inserm, Université de Lorraine and CHRU Nancy, Nancy, France (e-mail: freddy.odille@inserm.fr and
j.felblinger@chru-nancy.fr).
replaced by fibrosis and evolves into a scar. This remodeling process impacts the conduction of electric currents, with the scar area containing zones of conduction block and slow conducting zones when surviving myocardial fibers are present. This heterogeneous setup has been shown to be the cause of VT through the creation of reentrant circuits in the ventricles [1]– [3]. The mechanism underlying a reentrant circuit is that an electric current comes out of the slow conduction zone with a delay greater than the myocyte refractory period, so that it can excite healthy myocytes again.
Catheter interventions have been developed for the treatment of VT. The procedure comprises a diagnosis part where the likely origin of the VT circuit is identified, and a treatment part where radiofrequency heating is applied locally in order to ablate the core of the reentrant circuit. The diagnosis part is crucial and can be performed by several approaches. Activation mapping is the most direct technique [4]–[7]. It consists of acquiring intra-cardiac electrical signals, termed electrograms, by moving the catheter to different points of the ventricles during a sustained VT. A 3D map of propagation delays between electrograms can then be reconstructed, which represents the activation pathway of the VT. Unfortunately, activation mapping can only be performed in a small number of patients who can tolerate a sustained VT for the whole duration of the mapping. Alternative methods, referred to as substrate mapping [8]–[12], attempt to identify the critical, slow conduction zones by studying the local electrical characteristics of the ventricle. This can be done by detecting abnormal electrograms (i.e. presence of late or fragmented potentials on electrograms acquired in normal sinus rhythm and/or after stimulation of the ventricles from various sites) [10], [12]. However the presence of such abnormal electrograms at a given site does not mean that this site can support a reentrant VT circuit. Besides, it is difficult with this technique to distinguish low amplitude electrograms from noise in dense fibrotic scar areas.
A. Battaglia and D. Voilliot are with CIC-IT 1433, Inserm, Université de Lorraine and CHRU Nancy, Nancy, France, and with Pôle Cardiologie, CHRU Nancy, Nancy France.
P. Hoyland is with with IADI, Inserm and Université de Lorraine, Nancy, France, and with Biosense Webster France, Johnson & Johnson, Issy-lès-Moulineaux, France.
J.-M. Sellal and C. de Chillou are with IADI, Inserm and Université de Lorraine, Nancy, France, and with Pôle Cardiologie, CHRU Nancy, Nancy France.
Catheter treatment of ventricular tachycardia: a
reference-less pace-mapping method to identify
ablation targets
Freddy Odille, Alberto Battaglia, Philip Hoyland, Jean-Marc Sellal, Damien Voilliot, Christian de
Chillou, Jacques Felblinger,
Member, IEEE
Pace-mapping is another technique which has been shown to be a good surrogate for activation mapping [13], [14]. Pace-mapping consists of stimulating the heart with the catheter from different sites of the ventricular cavity, in order to produce activation pathways originating from each of these sites. The exit site of the VT circuit is identified when the activation pathway best matches that of the clinical VT (previously recorded for that patient), i.e. when the surface electrocardiogram (ECG) obtained during pacing best matches the surface ECG recorded during the clinical VT. The core of the circuit was also shown to correspond to a zone of abrupt changes of the activation pathway [4]. The correlation coefficient between the QRS complexes is used as an objective metric for comparing VT morphologies recorded by a surface 12-lead ECG. In summary, the pace-mapping technique has several key advantages: (i) only a short ECG recording of the VT is necessary; (ii) the actual VT circuit can be reconstructed and visualized; (iii) after radiofrequency ablation, the ventricles can be stimulated again near the entrance of the circuit in order to demonstrate that the electric current cannot enter this circuit any longer, thus providing a feedback on the efficiency of the ablation lesion that was applied.
Despite all advantages of the pace-mapping technique, there are remaining challenges or disadvantages: (i) a reference VT recording is required, yet in some patients VT cannot be induced during the procedure or it is poorly tolerated, even during a short period of time; (ii) after a VT circuit is ablated by pace-mapping, in some cases a secondary circuit can occur (sometimes still during the procedure, sometimes after a few months).
In this work, a “reference-less” pace-mapping method is proposed in order to identify the target zones for ablation, relying solely on the ECG data recorded during pace-mapping. The rationale is to search for regions corresponding to abrupt changes of the activation pathway, by looking at surface ECG correlations between neighboring pacing sites, rather than looking at correlations between each pacing site and a clinical VT. Our hypothesis is that reference-less pace-mapping can accurately identify the same target zones as conventional pace-mapping, plus additional zones that may cause other VT circuits. The relation between conventional and reference-less pace-mapping is studied both theoretically and experimentally, by retrospective analysis of 24 VT ablation procedures performed with the conventional pace-mapping technique. The reference-less method was thereby compared to the conventional method in terms of performance for detecting ablation target zones, using a specially developed software tool providing semi-automatic analysis.
II. THEORY
In this section we give a formal description of the conventional and proposed pace-mapping methods to identify ablation targets in macro-reentrant VT circuits, as those that can occur in ischemic VT patients.
A. Conventional pace-mapping: ventricular tachycardia correlation mapping
In the conventional pace-mapping method, a correlation map with the clinical VT, / , is generated. The process
for generating this map has been published previously [13] and is implemented in the CARTO system (PASO™ module of CARTO3®, Biosense Webster, Inc., Irvine, USA). We describe
this process more formally in the following.
The correlation score at each point = is calculated as the Pearson correlation coefficient (. , . ) between the QRS signal, ( ), recorded right after pacing at site , and the QRS of the clinical VT, (i.e. one user-selected cycle of the clinical VT recording), averaged over the 12 leads:
/ ( ) =121 ( ),
!" #!
(
1)
Areas of abrupt changes of the activation pathway can be identified by large values of the spatial gradient of the VT correlation map defined above. For a neighboring point located at + % , with ‖% ‖ sufficiently small (‖% ‖ < 20 mm in this study), the magnitude of the spatial gradient, by definition, can be estimated by:
' / ( ) = () / ( )(
≃( / ( + % ) −‖% ‖ / ( )(
(
2)
In the remainder, the correlation map / is expressed in percent units (%) and its gradient ' / in %/mm. Mathematically, the correlation gradient at a given point of the heart surface represents the infinitesimal change that will be observed in the VT correlation score in response to moving the pacing catheter by an infinitesimal distance. A singularity is expected when the catheter is in a zone from where two distinct electrical pathways are equally possible. When pacing from the center of the VT circuit core zone, termed mid-isthmus line in the literature, the activation wavefront can propagate in either direction of the VT circuit (towards its entrance or towards its exit), as demonstrated and visualized in figure 3 of Ref. [14]. Note that this mid-isthmus line can even be met in practice by the cardiologist: when the catheter happens to be located exactly on the mid-isthmus line, changing the amplitude of the stimulation pulse can result in the activation wavefront to travel towards the entrance or towards the exit. This is because a larger pulse will stimulate of broader area, including cardiomyocytes across the mid-isthmus line, which is likely to give rise to the other possible pathway.
B. Reference-less pace-mapping method
A reference-less method is proposed in order to study changes in activation pathways, based solely on the ECG data obtained during pace-mapping. For each pacing site , a local correlation map ( ) is defined that represents the correlation between paced QRS signals at site and paced QRS signals in a small neighborhood of , i.e. any site + % , with ‖% ‖ sufficiently small (‖% ‖ < 20 mm as well):
( )( + % )
=121 , ( ), ( + %
)-!" #!
(3)
The spatial gradient of this local correlation map can be estimated between each pair of neighboring sites and + % by: ' / ( , + % ) = () ( )( + % )( ≃( ( )( + % ) −‖% ‖ ( )( )( =( ( )( + % ) − 100%(‖% ‖ = 01121 , ( ), ( + % )-!" #! 2 − 100%0 /‖% ‖
(
4)
In the equation above, ( )( ) is the correlation between pacing site and itself, i.e. 100%.
There is a relation between the correlation gradient maps obtained by the conventional method, ' / , and by the reference-less method, ' / . This relation can be explained by the following thought experiment. Let us consider two neighbor pacing sites 3 and 4 that give rise to a highly similar activation, i.e. ( 3)( 4) ≃ 1. Then the respective correlation of 3 and 4 with the reference VT must be similar, i.e. one must have / ( 3) ≃
/ ( 4) (and consequently ' / ( 3) ≃ 0). Conversely, if 3 and 4 give rise to a different activation, i.e. ( 3)( 4) ≪ 1, then one cannot conclude about their
similarity to the clinical VT, e.g. one could have / ( 3) ≃ / ( 4) (the morphology of paced QRS no.1 and paced QRS no.2 are equally similar/dissimilar to that of the VT) or / ( 3) ≠
/ ( 4) (the morphologies of paced QRS no.1, paced QRS no.2 and the VT are all different from one another).
In practice, in healthy myocardium, i.e. away from the core of a reentrant VT circuit, subtle changes in the depolarization wavefront are expected when moving the pacing catheter from one site to its neighbors. Therefore one should have
' / ≃ 0 and ' / ≃ 0. Only within the
core of the VT circuit (called isthmus in the literature), marked transitions have been observed in the VT correlation map [13]. As a result, such transition zones, identified by large values in the ' / map, must also show large values in the ' / map. However the converse of this statement is not true, so it is expected that large values in ' / are present which may or may not correspond to large values in ' / .
III. METHODS
A. Patient population
Nineteen consecutive patients (13 men, mean age = 59 ± 12 years) referred for post-infarct VT catheter ablation between March 2016 and October 2017 were included in this retrospective, non-interventional study. Inclusion criteria were: (i) presence of a spontaneous sustained monomorphic VT documented by a 12-lead ECG which was subsequently inducible during the electrophysiological study; (ii) identification of the VT isthmus by the pace-mapping technique [13] using the CARTO3® PASO™ software (Biosense
Webster, Inc., Irvine, USA) and (iii) confirmation that radiofrequency catheter ablation lesions applied across the VT isthmus prevented further VT induction. The study was granted a waiver by our institutional review board due to its retrospective, non-interventional nature. The storage of anonymized data was declared to the French data protection authority (CNIL).
All 24 procedures were performed with the Niobe® robotic
magnetic navigation system (Stereotaxis Inc., St. Louis, USA). The electrophysiologic mapping and the radiofrequency ablation were performed as previously described[5], [13], [15]. In all procedures, at least one scarified area was detected (<1.5mV bipolar voltage). Its mean area was 38.1 ± 28.4 cm2,
representing 16.7% (± 10.9%) of the total left ventricle surface. VT was induced by programmed electrical stimulation, with the catheter placed in the right ventricular apex. This was done by application of up to 3 extrastimuli during spontaneous rhythm (600-ms and then 400-ms basic cycle length). Failure to induce a sustained VT promoted the same protocol from another site (alternatively right ventricle outflow tract or left ventricle). Pace-mapping was performed in a bipolar configuration (600 ms cycle length) with the output delivered at twice the diastolic threshold.
B. Automated software processing
Anonymized data were exported from the CARTO3®
workstation and were processed using an in-house software for smart isthmus identification (SMARTIS) written in MATLAB language (The Mathworks, Natick, USA). Electro-anatomic data were first loaded into the software, including: 12-lead ECG data acquired during sinus rhythm, during the induced clinical VT, and during pace-mapping (2.5 s of ECG recording at each pacing site); catheter positions corresponding to all these recordings; high-resolution vendor-generated 3D meshes of the ventricular cavity, as well as 3D meshes of the bipolar and unipolar voltage maps derived from the electrograms acquired in sinus rhythm. All correlation gradient maps used in this study (conventional and reference-less method) were generated offline with the MATLAB software, as described hereafter.
1) Raw mesh generation
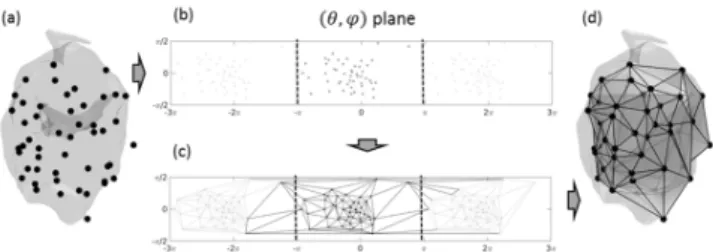
First a 3D surface mesh was generated from the raw pace-mapping sites, which will be called raw mesh. As illustrated in Fig. 1, the coordinates = of the pacing sites were converted into polar coordinates 7 8 9 (with the origin being the center of gravity of all pacing sites). Then a 2D Delaunay triangulation was performed in the (8, 9) plane in order to establish connections between neighboring pacing sites. To ensure circular continuity of the connections in the “longitude” direction 8, the (8, 9) plane was extended at its edges with (8 : 2;, 9). The resulting list of triangle connections was used to connect the pacing sites in the 3D space and form the raw 3D surface mesh. On average, there were 61 pacing sites per procedure, and 179 pairs of connected pacing sites, including 121 pairs of sites separated by a distance below the distance threshold defined for our analysis, <= >= 20 ??.
2) Correlation and correlation gradient meshes
The generation of correlation and correlation gradient maps is illustrated in Fig. 2 and Fig. 3.
The VT correlation mesh generation from the raw mesh is straight-forward. Provided correlation scores have been calculated between each pacing site and the clinical VT (details in the next paragraph), a color is assigned to each vertex of the raw mesh in order to form the VT correlation map. For better visualization, this map is finally projected onto the high-resolution anatomical mesh provided by the vendor (using nearest-neighbor interpolation), as illustrated in Fig. 2. For final visualization of the 3D map, the rendering engine (still within MATLAB in this study) was set to use linear interpolation of values defined at each vertex of the high resolution mesh, as it is done in the vendor’s CARTO3® software.
Correlation gradient maps were calculated on an intermediate mesh, defined by subdivision of the triangles in the raw mesh: each triangle of the raw mesh identifies connections between 3 pacing sites, and is further divided into 3 subtriangles (see Fig. 2d and Fig. 3d). Each subtriangle is mapping an area between 2 neighboring pacing sites and is then assigned a color code corresponding to the correlation gradient between these two sites (either ' / or ' / , using formulas in equations (2) and (4)). When the distance between two pacing sites is greater than <= > (<= >= 20 ??), a neutral color is assigned (white). Finally, the correlation gradient map is projected onto the high-resolution anatomical mesh and visualized in the same way as described for the VT correlation map.
3) Automated alignment of ECG signals
Automatic ECG alignment was proposed in order to compare the morphology of a paced QRS signal with either the reference VT recording or paced QRS signals from its neighboring sites. This alignment is necessary because there a variable delay between the stimulation spike and the QRS onset (i.e. the start of ventricular activation), depending on the presence of slow conducting zones. The automatic alignment procedure consisted of the following steps: (i) automatic detection of stimulation spikes in the ECG using basic signal processing techniques (convolution of the ECG signal with a spike template, thresholding to produce a binary signal, and front edge detection); (ii) QRS peak detection after each spike, by a maximum search in the module of a synthetic vectorcardiogram reconstructed from the 12-lead ECG, using inverse Dower
transformation [16], [17]
(www.mit.edu/~gari/CODE/DOWER/idowerT.m); (iii) initial alignment of the two QRS signals based on the detected QRS peaks; (iv) refined alignment by maximization of the cross-correlation function [18]; (v) calculation of the cross-correlation coefficient, averaged over the 12 ECG leads, using either equation (1) or (3). It should be noted that, in the reference-less method, several QRS complexes are present in each 2.5 s recording (i.e. at one given pacing site). Therefore all possible combinations of QRS complexes from the two pacing sites were computed, and finally the paced QRS pair providing the highest correlation score (in absolute value) was selected. For all QRS correlation calculations, a temporal window needed to be defined: for the conventional method, it was set to the duration of the clinical VT cycle (one user-selected cycle of the sustained VT recording); for the reference-less method, it was set to 300 ms.
The software tool allowed visualization of all aligned signals. An experienced interventional cardiologist was asked to review all aligned ECG signals (paced QRS against clinical VT, and paced QRS against their neighbors) and to correct the alignment when necessary (thereby updating the correlation scores).
C. Validation
1) Automated processing
The efficiency of the automated processing was assessed by statistics of QRS signals that needed manual correction by the cardiologist. The correction was considered to be necessary when a mismatch greater than 10% in the correlation score was found between the automatic and the manual QRS alignment.
2) Comparison with activation mapping
In one of the patients (patient 1) the VT was hemodynamically well tolerated. Therefore an actual activation map was also acquired by mapping the delay between a reference time in the VT cycle and the local activation time, as detected by a signal peak on the electrograms, for each location of the catheter within the ventricle. The proposed reference-less correlation gradient map was then visually compared to the reconstructed activation map. In particular the location of the abnormal zone, as detected by the proposed method, was superimposed to the trajectory of the activation wavefront, shortly before entering the core of the reentrant circuit, during traversal of the core and shortly after.
Fig. 1. Raw points where catheter stimulation is applied (i.e. pacing sites) (a); conversion to polar coordinates and planisphere representation (b); Delaunay triangulation in
(
@, A)
plane (c); raw triangular surface mesh identifying connections between neighboring pacing sites (d).Fig. 3. Illustration of the reference-less method in a VT patient (same as Fig. 2h): 12-lead ECG from 3 pairs of neighboring pacing sites (P1, P2, P3) aligned with
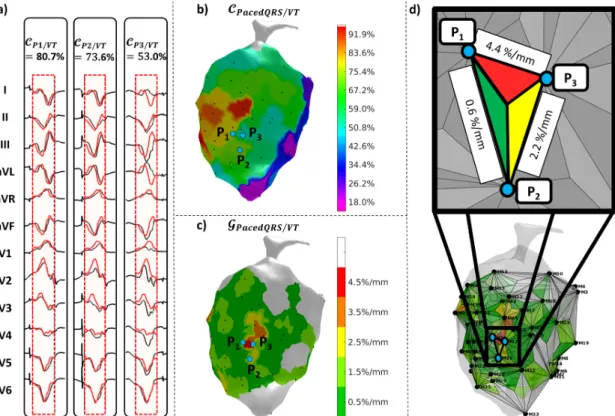
each other for pair-wise correlation coefficient calculation (a); pair-wise correlation map representing correlation between neighboring pacing sites (b); reference-less correlation gradient map BCDEFGHIJ/CDEFGHIJ, highlighting marked transitions corresponding to slow propagation zones in the core of the VT circuit (c); intermediate mesh (with triangle subdivision) used to generate the gradient correlation map from equation (4) (d).
Fig. 2. Illustration of the conventional method in a VT patient: 12-lead ECG from 3 neighboring pacing sites (P1, P2, P3) aligned with the reference VT signal (red
signals) for correlation coefficient calculation (a); VT correlation map KCDEFGHIJ/LM, i.e. a surrogate for the VT activation map (b); VT correlation gradient map BCDEFGHIJ/LM, highlighting marked transitions in the VT correlation map (i.e. slow propagation zones in the core of the VT circuit) (c); intermediate mesh (with triangle subdivision) used to generate the gradient correlation map from equation (2) (d).
3) Comparison of the conventional and reference-less methods
In order to compare the reference-less method with the conventional method, areas showing abnormal correlation gradients with the two methods were identified and compared. Cut-off values needed to be defined in order to discriminate between normal and abnormal correlation gradient values.
Normal correlation gradient values were determined for both methods using data measured in healthy myocardium only (sites where bipolar voltage was greater than 2 mV and unipolar voltage greater than 8 mV) using the same patient population. This was done by calculating the histogram of correlation gradient values and by calculating the 95th percentile,
corresponding to the value below which 95% of correlation values in healthy myocardium lied. Correlation values above these cutoffs were considered abnormal. The ability of both methods to detect normal/abnormal regions was compared using common statistics for binary classifiers (using ' / as the ground truth), including the negative predictive value (NPV), the positive predictive value (PPV), the sensitivity (Se) and specificity (Sp).
4) Agreement between identified zones and actual ablation sites
Finally, the relevance of the identified zones (from both methods) was assessed by retrospective analysis of the sites that were actually targeted by radiofrequency ablation during the procedure. The mean value of correlation gradients (' / and ' / ) in the areas that were subsequently ablated (called ablation sites) was compared to that in the non-ablated areas (all other sites in the ventricle) and in the non-ablated areas within the scar region (identified as regions with bipolar voltage < 1.5 mV or unipolar voltage < 8 mV). The actual ablation zone was in general larger than the transition zone identified on the conventional VT correlation map, depending on the chosen ablation strategy. However it is expected that the ablation zone comprises a larger proportion of areas with abnormal correlation gradients. Differences in correlation gradients between ablated and non-ablated regions were tested for statistical significance using two-sample t-test, with a significance level set to 5%.
5) Sensitivity analysis
The proposed method relies on several key parameters which may impact the generated maps and thereby the identified target zones. We analyzed the sensitivity of the method to the following parameters: (i) sampling density of the pacing sites; (ii) distance threshold (above which correlation gradients are considered unreliable); (iii) ECG alignments errors; (iv) ECG lead averaging mode used in the correlation calculation process (average of the 12 leads, or various other lead combinations). The detailed methods for the sensitivity analysis are given in a supplementary file.
IV. RESULTS
A. Automated processing of ECG data
Before and after correction of the automated ECG alignment, correlation scores showed differences, expressed as mean ± standard deviation, of -3.5% ± 23.3% (conventional method, i.e. correlation between paced QRS and clinical VT) and -2.3%
± 13.9% (reference-less method, i.e. correlation between paced QRS and their neighbors). Manual correction was necessary in 28.5% of cases with the conventional method and in 12.5% of cases with the reference-less method. The automatic alignment was more reliable when the QRS complexes to be compared had similar morphologies, as indicated by the lower correlation scores in datasets for which correction was necessary (average correlation of 19.3%/32.1% for the conventional/reference-less method) compared to datasets for which the automatic alignment was satisfactory (average correlation of 60.5%/81.1%).
B. Normal values of correlation gradients
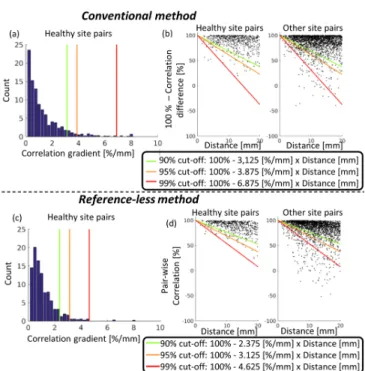
The distribution of correlation gradient values in healthy myocardium, computed with both methods, is shown in Fig. 4. The histograms show very low values in general with both methods (Fig. 4a and 4c). Cutoff values are shown on the histograms, below which 90% (respectively 95% and 99%) of the pairs lie. Another representation of this distribution is shown in Fig. 4b and 4d, where correlation values are further plotted against the distance between pacing sites. In these graphs, the correlation gradient cutoff values correspond to the slope of a linear function. When plotting other (i.e. non-healthy) pacing site pairs, a small portion of pairs appear below the defined cutoff values and can be considered as abnormal.
The 95% cutoff values were used in the remainder of the study to classify normal/abnormal correlation gradient values:
'NOP= / = 3.875 %/?? and 'NOP= / =
3.125 %/??.
Fig. 4. Histogram showing the distribution of correlation gradient values in pairs of healthy myocardium pacing sites, as computed with the conventional (a) and proposed (c) method. Relation between correlation and distance in healthy pacing site pairs and in other pacing site pairs (b and d). The green (respectively orange and red) slope on (b) and (d) graphs indicate cutoff values above which 90% (respectively 95% and 99%) of healthy site pairs lie. Conversely, pacing site pairs below these cutoffs are considered to be abnormal.
C. Validation of the reference-less method against activation mapping
The reference-less correlation gradient map generated for patient 1 is shown in Fig. 5, together with the actual activation map of the VT. On the proposed map, one region is identified as abnormal (i.e. above the threshold given in the previous section) and is color-coded in red. Four pacing sites are located in the direct neighborhood of this abnormal region and are highlighted as white spots. On the activation map, it can be seen that the region between the four spots precisely corresponds to the entrance into the core of the reentrant VT circuit. Indeed on the activation map (Fig. 5b), the blue regions are first activated, corresponding to the entrance into the circuit, then a narrowing of the activation wavefront is observed towards the purple and red regions, corresponding to the core of the VT circuit. Finally, the activation wavefront evolves faster towards the orange region, corresponding to the exit of the circuit. Note that the activation time is relative to the exit of the VT circuit (activation time t=0), which corresponds to the onset of the QRS complex of the VT. The narrowing of the activation wavefront may be better observed in Fig 5c, were the region of activated myocardium is shown at different times of the VT cycle. A full video of this activation sequence is provided as supplementary material. These show that the identified abnormal region precisely corresponds to the critical part of the VT circuit, i.e. to its core entrance.
D. Comparison of the conventional and reference-less methods
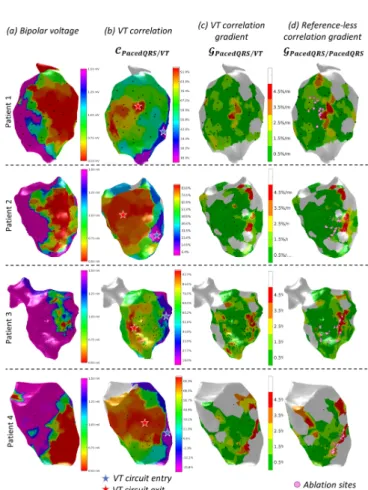
Example correlation gradient maps obtained in four representative patients with the conventional and reference-less method are shown in Fig. 6. Along with these maps, the bipolar voltage map is shown in order to visualize the scar area, as well as the VT correlation map which is used by the clinician. Visually, there was a good match between correlation gradient maps from the two methods, with most of the myocardium appearing with green color (low gradient values) and small portions of the maps (yellow to red color) showing larger correlation gradients with the two methods.
Fig. 5. Comparison between the reference-less correlation gradient map (a) and the actual VT activation map (b) obtained in patient 1. The activation map is representing the local activation time in ms. The activation wavefront (c) is derived from the activation map and shows the activated areas at different time windows of the VT cycle, from left to right: before entering the core zone of the reentrant circuit, during its entrance and traversal, and shortly after. The precise location of four pacing sites surrounding the target zone, as identified by the proposed method, is indicated by the four white spots on all maps. Ablation sites that actually terminated the VT were determined by conventional pace-mapping and are indicated as pink spots.
Fig. 6. Illustration of the target zone identification in four VT patients: bipolar voltage map, with low voltage (red) representing the scar region (a); VT correlation map, with highest correlation indicating the VT circuit exit (red star), and lowest correlation indicating the entrance (blue star) (b); VT correlation gradient map (c) and reference-less correlation gradient map (d) indicating critical zones of slow conduction (red), i.e. potential ablation targets identified by the conventional and proposed method respectively. Actual ablation sites that were destroyed to terminate the VT were determined by conventional pace-mapping and are indicated as pink spots.
TABLEI
AGREEMENT BETWEEN THE CONVENTIONAL AND REFERENCE-LESS METHOD FOR CLASSIFYING NORMAL/ABNORMAL CORRELATION GRADIENT VALUES (MAPS FROM 24 PROCEDURES,9739 MESH VERTICES IN TOTAL).
Conventional* \Reference-less Normal Abnormal Normal TN=8193 FP=753 Abnormal FN=244 TP=549 TN=true negative ; FN=false negative ; FP=false positive ; TP=true positive
Quantitative comparison of the correlation gradient maps, using the 95% cutoff values defined in the previous section to classify normal/abnormal values, is summarized in Table I. As expected, more abnormal points were detected with the reference-less method (1302) than with the conventional method (793). Other relevant metrics derived from these raw data, include: the negative predictive value, NPV=97% (i.e. 97% of point classified as normal with the proposed method are indeed normal with the conventional method); the positive predictive value, PPV=42% (i.e. 42% of point classified as abnormal with the proposed method are indeed abnormal with the conventional method); sensitivity, Se=69%; specificity, Sp=92%.
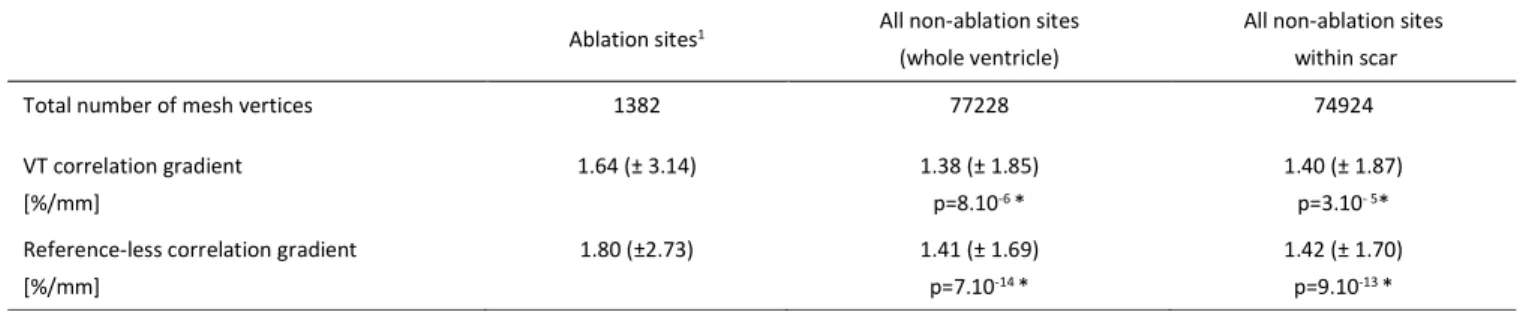
E. Agreement between identified zones and actual ablation sites
The correlation gradients values measured retrospectively in the ablation sites and in other sites are given in Table II. Gradient values in the ablation sites were higher than in the rest of the ventricle and higher than in non-ablation sites within the scar. These differences were significant with both the conventional method (p<10-4) and with the reference-less
method (p<10-12). F. Sensitivity analysis
Detailed results of the sensitivity analysis are given in the supplementary material. To summarize, the method was found to be relatively robust to the parameters that were tested. Spatial resolution seems to be the most important parameter, and a sampling with a mean distance below 20 mm seems adequate to identify potential abnormal regions. A denser sampling (around 10 mm) seems a better choice in order to define more accurately the extent and contours of the abnormal region. In our experiments, changing the distance threshold did not seem to change the identified region. Nevertheless, using a reasonable threshold (e.g. < 20-30 mm) seems fairer as the user is explicitly shown that in some regions, computing correlation gradient values is questionable. In terms of ECG alignment, a variability up to 6 ms seemed to have a mild impact on the generated maps. Finally, a correlation score combining the information from all 12 leads seems preferable, such as the mean correlation over the 12 leads used in this study.
V. DISCUSSION
A novel method has been proposed to identify target zones for catheter ablation of VT that does not require a reference (spontaneous or induced) VT recording. The method proceeds by analyzing pairwise correlations between surface ECG signals from the network of pacing sites. The generated correlation gradient maps can identify abnormal points which are potential targets for radiofrequency ablation. The resulting map can be easily integrated into the vendor’s system (e.g. using the mesh integration module of the CARTO3® system).
In one patient who went through an actual VT activation mapping, the identified region has been shown to correspond precisely to the VT circuit core entrance. The relation between correlation gradient maps calculated with/without a VT reference has been described formally and evaluated experimentally. The reference-less correlation gradient map, in %/mm units, can be interpreted as follows: low values efficiently identify normal zones (NPV=97%, considering the VT correlation gradient map as the ground truth); high values identify abnormal zones which may or may not be confirmed by the VT correlation gradient map (PPV=43%). The reference-less method indeed identified 1.6 times more abnormal zones. This result was expected, as explained earlier, because some abrupt transitions can only be identified by a direct comparison of the QRS signals from two neighboring pacing sites, rather than comparing each of them to a third QRS signal (i.e. the reference VT signal). It could be hypothesized that the additional abnormal zones correspond to other, “hidden” or “silent” reentrant VT circuits. In practice, a good qualitative agreement was found between the two gradient maps. Differences between the values measured in the actual target ablation sites and in other sites were significant with both methods. The reference-less method seemed to be better at discriminating between regions which were subsequently ablated and other regions in the ventricle, and the mean correlation gradient value found in the ablation sites was also closer to the cutoff 'NOP= / = 3.125 %/??. In practice the ablation zone covers a larger area than theoretically required, due to all sources of inaccuracies in the localization process (discussed hereafter) and in the ablation process (little feedback on the created lesion is available to the cardiologist). However the inability to induce a VT after ablation, as checked
TABLEII
CORRELATION GRADIENT VALUES MEASURED RETROSPECTIVELY AT THE ABLATION SITES AND AT OTHER SITES OF THE VENTRICLE (DATA FROM 24
PROCEDURES).RESULTS ARE EXPRESSED AS MEAN (± STANDARD DEVIATION).
Ablation sites1 All non-ablation sites
(whole ventricle)
All non-ablation sites within scar Total number of mesh vertices 1382 77228 74924 VT correlation gradient [%/mm] 1.64 (± 3.14) 1.38 (± 1.85) p=8.10-6 * 1.40 (± 1.87) p=3.10- 5*
Reference-less correlation gradient [%/mm]
1.80 (±2.73) 1.41 (± 1.69) p=7.10-14 *
1.42 (± 1.70) p=9.10-13 * 1Values measured at the spatial coordinates of ablation sites, before actual ablation
in the final stage of the clinical procedure, is a strong evidence that the ablated region did contain the core of the reentrant VT circuit.
Sources of inaccuracies in the target localization process should be mentioned. The intrinsic accuracy of the catheter navigation system is vendor-dependent, and depends on the localization technique (GPS-like or bio-impedance-based) and on the patient motion compensation system. The density of pacing sites, however, is controlled by the user. A high density is desirable as it allows more reliable correlation gradient values to be obtained. The gradient values are indeed computed by estimation formulas given in equations (2) and (4), which hold when the distance between pacing sites is small. In this study the threshold of <= >= 20 ?? was used, above which gradient estimates were considered unreliable. The drawback of increasing the pacing site density is that a compromise has to be found between data acquisition time and processing time. Finally it should be noted that the current version of the CARTO software only includes the correlation map
/ , and not the correlation gradient map ' / . Instead, the cardiologist reconstructs this gradient map “mentally” in order to identify the abrupt transition zone. This may also partly explain spatial inaccuracies when choosing target ablation sites.
We have tested the proposed method in macro-reentant VT circuits that occurred in ischemic cardiomyopathies. Ablation of VT in non-ischemic cardiomyopathies would also be of great interest. The mechanisms underlying VT in the latter case is not completely understood. However macro-reentrant circuits have been mapped in non-ischemic cardiopathies, including arrhythmogenic right ventricular dysplasia [19] and dilated cardiomyopathy [20]. The reference-less pace-mapping method should also be applicable in such macro-rentrant circuits. However there is still a lack of knowledge about VT circuits other than monomorphic macro-reentries, including polymorphic VT and micro-reentrant circuits. Such circuits have not been reconstructed by activation mapping, so there is no data indicating that the reference-less method could be applied in such cases.
In order to optimize the trade-off between spatial accuracy and duration of the procedure, both data acquisition and processing time should be optimized. With regard to data acquisition, automated catheter navigation systems such as the Niobe magnetic navigation system (Stereotaxis, St. Louis, USA) can improve the efficiency of the procedure. Data processing time is constrained by the need for manual correction of ECG alignments, which can be reduced using efficient automated ECG alignment as proposed in this study. To save even more time, new acquired pace-mapping site pairs could be identified during the course of the procedure, so that the cardiologist would be able to check and correct the alignment of paced-QRS signals on-the-fly. Fully automatic post-processing may be difficult to achieve, as it may necessitate perfectly “clean” data recordings, i.e. containing only paced-QRS signals at each site. In practice, some heart beats need to be ignored as the stimulation spike does not always induce a paced QRS, thereby the amplitude of the stimulation spike has to be adjusted, especially within the scar region. Interestingly, the automatic ECG alignment was more
reliable with the reference-less method than with the conventional method. This is because the reference-less method directly compares QRS signals from neighboring sites, so this comparison is easier in pacing sites located far away from the VT circuit, where the paced QRS morphology is very different from that of the reference VT.
The main limitation of this study is that it is retrospective and involved a small number of patients (19). The determination of cutoff values to classify normal/abnormal points may be adjusted by considering a larger cohort. A prospective study will be necessary in order to evaluate the true clinical benefit of choosing ablation target sites with the proposed method. In particular, the success rate of the procedure obtained with either ablation method will need to be evaluated with patient follow-up data, in order to prove that the recurrence rate can be reduced. This would provide a clinical evidence that the additional areas detected by the reference-less method do correspond to other (secondary or hidden) VT circuits. Nevertheless, in this study, there are indices supporting this hypothesis: (i) although the reference-less method was blind to the clinical VT, it was able to correctly identify proven VT isthmuses (as identified by conventional pace-mapping and by successful ablation); (ii) as the method is based on pace-mapping, the abnormal areas are identified by analysis of experimentally feasible activation pathways in a given patient, which is of utmost importance since the aim is to identify a macro-reentrant circuit, which is an abnormal activation pathway. This is different from substrate methods, as the presence of abnormal (e.g. late/fragmented) potentials locally does not tell anything about the resulting activation pathways macroscopically, i.e. it does not tell whether it can support a macro-reentrant circuit.
In the clinical workflow, the proposed method might be used as a surrogate of the conventional pace-mapping method to identify the ablation targets. The remainder of the procedure might remain unchanged. This means the procedure would still begin with programmed electrical stimulation to try and induce a clinical VT. Pace-mapping data would be collected as with the conventional method, preferably with a higher sampling density in the scar area, i.e. in areas with low values in the voltage maps. Only the processing of the pace-mapping data would change. The reference-less method would be blind to the clinical VT and would identify one or multiple zones as potential ablation targets, instead of a single zone with the conventional method. One might also use both methods to check that the targets identified by the reference-less method do contain the targets identified by the conventional method. After ablation of all identified sites, programmed electrical stimulation would still be performed again to check that no VT can be induced (end-point of the procedure). It is expected that the reference-less method would reach the end-point faster in complex cases, e.g. when multiple VT circuits are present. Indeed with conventional pace-mapping, new pacing sites might be needed after ablation of the primary VT circuit, and a new correlation map has to be generated with the new VT recording as a reference.
When a VT reference is available, the method can be used in combination with the conventional method. Indeed if a clinical VT recording can be easily obtained, the decision could be made by the cardiologist based on all available information (VT
correlation map, VT gradient correlation map and reference-less correlation gradient map). In that case the new method may help speeding-up the procedure, as automated processing is more reliable than with the conventional method. Another way of shortening the intervention would be to use ECG imaging [21]–[23] to guide the procedure, since it has the potential of reconstructing the source of the arrhythmia (i.e. here the exit site of the VT circuit) directly from multi-channel surface ECG data recorded during VT, and even potentially from the standard 12-lead ECG recording [24]. Alternatively, artificial intelligence has shown promising results to predict the exit site of the VT circuit from the 12-lead ECG of the VT, based on machine learning [25] or deep learning [26]. In particular, in Ref. [25], it was shown that the relation between pacing location and the lead-wise QRS energy distribution can be learnt (using a population-based and/or patient-specific training) and used to predict the location of the VT exit site. Both ECGI and artificial intelligence necessitate a VT reference ECG. However it is also desirable to localize VT circuits without having a reference ECG recording of the VT, because (i) in some patients the VT cannot be induced during the procedure; (ii) secondary or “hidden” VT circuits may occur after ablation of the primary VT circuit, and should be detected as well. Alternatives to the proposed reference-less pace-mapping include substrate pace-mapping methods [7]–[9], [11], [12] (in particular those methods detecting regions with late/fragmented potentials). A drawback of substrate mapping is that it may identify a large number of abnormal sites (i.e. with late/fragmented potentials) which may not necessarily lead to a VT circuit; conversely, pace-mapping experimentally identifies the feasible activation pathways for a given patient. Having said that, substrate mapping may also be used in combination with the proposed method in such cases. Recent progress in biophysics-based simulation, e.g. incorporating magnetic resonance imaging of scar tissue, may also help improving our understanding and interpretation of such substrate mapping data [27], [28].
VI. CONCLUSION
A method was proposed to identify ablation targets in macro-reentrant VT circuits, such as those occurring in ischemic patients. It is based on the pace-mapping mapping technique in that it uses surface ECG recordings during electrical stimulation of the ventricle from multiple sites. However if differs from conventional pace-mapping in that the localization of the critical zone to be ablated does not require a reference ECG recording of the VT. The results of this retrospective study support the hypothesis that the detected regions correspond to critical regions as those found in the core of VT reentrant circuits, as assessed by the comparison to (i) regions detected by conventional pace-mapping, (ii) the location of ablation sites (ablation terminated VT in all 24 procedures of the study) and (iii) activation mapping (performed in one patient). This reference-less technique is of particular interest for patients in whom VT cannot be induced during the intervention. It might also help detecting secondary VT circuits that may occur after ablation of a primary VT circuit.
REFERENCES
[1] N. El-Sherif, B. J. Scherlag, R. Lazzara, and R. R. Hope, “Re-entrant ventricular arrhythmias in the late myocardial infarction period. 1. Conduction characteristics in the infarction zone,” Circulation, vol. 55, no. 5, pp. 686–702, May 1977.
[2] H. Klein, R. B. Karp, N. T. Kouchoukos, G. L. Zorn, T. N. James, and A. L. Waldo, “Intraoperative electrophysiologic mapping of the ventricles during sinus rhythm in patients with a previous myocardial infarction. Identification of the electrophysiologic substrate of ventricular arrhythmias.,” Circulation, vol. 66, no. 4, pp. 847–853, Oct. 1982.
[3] J. M. de Bakker et al., “Reentry as a cause of ventricular tachycardia in patients with chronic ischemic heart disease: electrophysiologic and anatomic correlation,” Circulation, vol. 77, no. 3, pp. 589–606, Mar. 1988.
[4] W. G. Stevenson et al., “Identification of reentry circuit sites during catheter mapping and radiofrequency ablation of ventricular tachycardia late after myocardial infarction,” Circulation, vol. 88, no. 4 Pt 1, pp. 1647–1670, Oct. 1993.
[5] C. de Chillou et al., “Isthmus characteristics of reentrant ventricular tachycardia after myocardial infarction,” Circulation, vol. 105, no. 6, pp. 726–731, Feb. 2002.
[6] W. G. Stevenson et al., “Exploring Postinfarction Reentrant Ventricular Tachycardia With Entrainment Mapping,” J. Am. Coll.
Cardiol., vol. 29, no. 6, pp. 1180–1189, May 1997.
[7] K. Soejima et al., “Catheter Ablation in Patients With Multiple and Unstable Ventricular Tachycardias After Myocardial Infarction: Short Ablation Lines Guided by Reentry Circuit Isthmuses and Sinus Rhythm Mapping,” Circulation, vol. 104, no. 6, pp. 664–669, Aug. 2001.
[8] F. E. Marchlinski, D. J. Callans, C. D. Gottlieb, and E. Zado, “Linear Ablation Lesions for Control of Unmappable Ventricular Tachycardia in Patients With Ischemic and Nonischemic Cardiomyopathy,”
Circulation, vol. 101, no. 11, pp. 1288–1296, Mar. 2000.
[9] H. Kottkamp et al., “Catheter Ablation of Ventricular Tachycardia in Remote Myocardial Infarction:,” J. Cardiovasc. Electrophysiol., vol. 14, no. 7, pp. 675–681, Jul. 2003.
[10] A. Arenal et al., “Ablation of electrograms with an isolated, delayed component as treatment of unmappable monomorphic ventricular tachycardias in patients with structural heart disease,” J. Am. Coll.
Cardiol., vol. 41, no. 1, pp. 81–92, Jan. 2003.
[11] A. Arenal et al., “Tachycardia-Related Channel in the Scar Tissue in Patients With Sustained Monomorphic Ventricular Tachycardias: Influence of the Voltage Scar Definition,” Circulation, vol. 110, no. 17, pp. 2568–2574, Oct. 2004.
[12] P. Jaïs et al., “Elimination of Local Abnormal Ventricular ActivitiesClinical Perspective: A New End Point for Substrate Modification in Patients With Scar-Related Ventricular Tachycardia,”
Circulation, vol. 125, no. 18, pp. 2184–2196, May 2012. [13] C. de Chillou et al., “Localizing the critical isthmus of postinfarct
ventricular tachycardia: the value of pace-mapping during sinus rhythm.,” Heart Rhythm Off. J. Heart Rhythm Soc., vol. 11, no. 2, pp. 175–181, Feb. 2014.
[14] C. de Chillou, J.-M. Sellal, and I. Magnin-Poull, “Pace Mapping to Localize the Critical Isthmus of Ventricular Tachycardia,” Card.
Electrophysiol. Clin., vol. 9, no. 1, pp. 71–80, Mar. 2017. [15] M. Pauriah et al., “A stepwise approach to the management of
postinfarct ventricular tachycardia using catheter ablation as the first-line treatment: a single-center experience,” Circ. Arrhythm.
Electrophysiol., vol. 6, no. 2, pp. 351–356, Apr. 2013.
[16] G. E. Dower, “A lead synthesizer for the Frank system to simulate the standard 12-lead electrocardiogram,” J. Electrocardiol., vol. 1, no. 1, pp. 101–116, Jan. 1968.
[17] G. E. Dower, H. B. Machado, and J. A. Osborne, “On deriving the electrocardiogram from vectoradiographic leads,” Clin. Cardiol., vol. 3, no. 2, pp. 87–95, Apr. 1980.
[18] S. Abboud and D. Sadeh, “The use of cross-correlation function for the alignment of ECG waveforms and rejection of extrasystoles,”
Comput. Biomed. Res., vol. 17, no. 3, pp. 258–266, Jun. 1984. [19] J.-M. Sellal, I. Magnin-Poull, A. Battaglia, D. Hooks, and C. de
Chillou, “First Simultaneous Endocardial and Epicardial Mapping of a Ventricular Tachycardia in an ARVD/C Patient,” JACC Clin.
[20] V. Swarup, J. B. Morton, M. Arruda, and D. J. Wilber, “Ablation of Epicardial Macroreentrant Ventricular Tachycardia Associated with Idiopathic Nonischemic Dilated Cardiomyopathy by a Percutaneous Transthoracic Approach,” J. Cardiovasc. Electrophysiol., vol. 13, no. 11, pp. 1164–1168, 2002.
[21] J. E. Burnes, B. Taccardi, P. R. Ershler, and Y. Rudy, “Noninvasive Electrocardiographic Imaging of Substrate and Intramural Ventricular Tachycardia in Infarcted Hearts,” J. Am. Coll. Cardiol., vol. 38, no. 7, pp. 2071–2078, Dec. 2001.
[22] W. H. W. Schulze et al., “ECG imaging of ventricular tachycardia: evaluation against simultaneous non-contact mapping and CMR-derived grey zone,” Med. Biol. Eng. Comput., vol. 55, no. 6, pp. 979– 990, Jun. 2017.
[23] C. Han, S. M. Pogwizd, C. R. Killingsworth, and B. He, “Noninvasive imaging of three-dimensional cardiac activation sequence during pacing and ventricular tachycardia,” Heart Rhythm, vol. 8, no. 8, pp. 1266–1272, Aug. 2011.
[24] P. M. van Dam, R. Tung, K. Shivkumar, and M. Laks, “Quantitative localization of premature ventricular contractions using myocardial activation ECGI from the standard 12-lead electrocardiogram,” J.
Electrocardiol., vol. 46, no. 6, pp. 574–579, Nov. 2013.
[25] J. L. Sapp et al., “Real-Time Localization of Ventricular Tachycardia Origin From the 12-Lead Electrocardiogram,” JACC Clin.
Electrophysiol., vol. 3, no. 7, pp. 687–699, Jul. 2017.
[26] P. K. Gyawali, S. Chen, H. Liu, B. M. Horacek, J. L. Sapp, and L. Wang, “Automatic coordinate prediction of the exit of ventricular tachycardia from 12-lead electrocardiogram,” in 2017 Computing in
Cardiology (CinC), 2017, pp. 1–4.
[27] R. Cabrera-Lozoya, B. Berte, H. Cochet, P. Jaïs, N. Ayache, and M. Sermesant, “Image-Based Biophysical Simulation of Intracardiac Abnormal Ventricular Electrograms,” IEEE Trans. Biomed. Eng., vol. 64, no. 7, pp. 1446–1454, Jul. 2017.
[28] Z. Chen et al., “Biophysical Modeling Predicts Ventricular Tachycardia Inducibility and Circuit Morphology: A Combined Clinical Validation and Computer Modeling Approach,” J.