HAL Id: hal-01965714
https://hal.laas.fr/hal-01965714
Submitted on 26 Dec 2018
HAL is a multi-disciplinary open access
archive for the deposit and dissemination of sci-entific research documents, whether they are pub-lished or not. The documents may come from teaching and research institutions in France or abroad, or from public or private research centers.
L’archive ouverte pluridisciplinaire HAL, est destinée au dépôt et à la diffusion de documents scientifiques de niveau recherche, publiés ou non, émanant des établissements d’enseignement et de recherche français ou étrangers, des laboratoires publics ou privés.
Arias, Miguel-Ángel López Peña, José-María Ocon, Juliette Dromard,
Philippe Owezarski, Alberto Mozo, Bruno Ordozgoiti, et al.
To cite this version:
Alejandro Bascuñana, Miguel-Ángel Monjas, Daniele Apiletti, Fernando Arias, Miguel-Ángel López Peña, et al.. Delivrable Progress on Use Cases. Ericsson Spain; Politecnico di Torino; EMC; SATEC; LAAS-CNRS; Universidad politécnica de Madrid. 2016. �hal-01965714�
Online Network Traffic
Characterization
Deliverable
Progress on Use Cases
ONTIC Project
(GA number 619633)
Deliverable D5.2
Dissemination Level: PUBLIC
Authors
Alejandro Bascuñana, Miguel-Ángel Monjas (Ericsson Spain); Daniele
Apiletti (POLITO); Fernando Arias (EMC2); Miguel Ángel López Peña,
José María Ocón (SATEC Spain); Juliette Dromard, Philippe Owezarski
(LAAS-CNRS); Alberto Mozo, Bruno Ordozgoiti (UPM); Panos Georgatsos
(ADAPTit)
Version
ONTIC_D5.2.2016-01-29.0.10
!
2 / 80
Version History
Version Modification
date
Modified
by
Summary
0.01
2015-12-01
Ericsson
Structure proposal
0.1
2015-12-10
Ericsson
First draft version
0.5
2015-12-21
Ericsson,
POLITO
Initial use case contribution (through UC
leaders: Ericsson (UC #3))
0.51
2015-12-21
EMC2
Contribution to UC #3
0.6
2015-12-22 CNRS, SATEC Initial use case contribution (through UC
leaders: SATEC (UC #1))
0.7
2015-12-22
UPM
Initial use case contribution (through UC
leaders: UPM (UC #2))
0.71
2016-01-10
UPM
Comprehensive review
0.72
2016-01-12
Ericsson
Review after comments
0.73
2016-01-13
Ericsson
First complete update
0.74
2016-01-14
Ericsson
Second complete update
0.75
2016-01-18 SATEC, CNRS UC #1 update after review
0.76
2016-01-18
UPM
UC #2 update after review
0.77
2016-01-18
POLITO
Further contribution on metrics for UC
#3
0.78
2016-01-19
SATEC, UPM Executive summaries
0.8
2016-01-19
Ericsson
Ready for final review
0.81
2016-01-25
ADAPTit
Full review
0.9
2016-01-26 SATEC, UPM,
Ericsson
Ready for quality review
0.91
2016-01-29
SATEC
QA review
1.0
2016-01-29
Ericsson
Ready for delivery
Quality Assurance:
Role
Name
Quality Assurance Manager
Miguel Ángel López Peña (SATEC
Spain)
Reviewer #1
Alberto Mozo (UPM)
3 / 80
Table of Contents
1.
A
CRONYMS ANDD
EFINITIONS7
1.1 Acronyms ... 7
2.
P
URPOSE OF THED
OCUMENT9
3.
S
COPE10
4.
I
NTENDEDA
UDIENCE11
5.
S
UGGESTEDP
REVIOUSR
EADINGS12
6.
E
XECUTIVES
UMMARY13
7.
U
SEC
ASEE
NVIRONMENT15
7.1 Overall ... 157.2 Use Case #1 - Network Anomaly Detection ... 16
7.3 Use Case #2 - Proactive Congestion Detection and Control System ... 17
7.4 Use Case #3 - Adaptive QoE Control ... 19
8.
U
SEC
ASESD
ESCRIPTION22
8.1 Use cases, epics and user stories ... 228.2 UC #1 (User Story 1): Network Anomaly Detection ... 24
8.2.1 Scenario description ... 24
8.2.2 User Requirements ... 24
8.2.3 System model ... 26
8.2.4 Performance Evaluation ... 31
8.2.5 Open issues, deviations and future developments ... 33
8.3 UC #2 (User Story 2): Proactive Congestion Detection and Control ... 34
8.3.1 Scenario description ... 34
8.3.2 User Requirements ... 37
8.3.3 System model ... 38
8.3.4 Performance Evaluation ... 42
8.3.5 Open issues, deviations and future developments ... 43
8.4 UC #3 (User Story 3): Adaptive QoE Control ... 44
8.4.1 Scenario description ... 44
8.4.2 User Requirements ... 48
8.4.3 System model ... 50
8.4.4 Performance Evaluation ... 63
8.4.5 Open issues, deviations and future developments ... 64
9.
R
EFERENCES66
4 / 80
A.1 Hardware Configuration ... 68
A.2 Software Configuration ... 68
A.3 Network configuration ... 68
A.4 Test scenarios ... 68
A.5 Server shell script code ... 69
A.6 Client shell script code ... 70
A.7 Tstat log files ... 71
A
NNEXB
Q
UALITY OFE
XPERIENCE(Q
OE)
F
RAMEWORK72
A
NNEXC
PGF
I
NTERFACESS
UMMARY75
C.1 IF3-2 REST Interfaces: Summary ... 75C.2 IF3-21 REST Interfaces: Summary ... 75
C.1 IF3-22 REST Interfaces: Summary ... 76
5 / 80
List of figures
Figure 1: Automated Management Control Loop pattern ... 19
Figure 2: Use Case #1 High-level Architecture ... 26
Figure 3: UC #1 Dashboard Functional View ... 27
Figure 4: UML specification of UC #1 on anomaly detection ... 28
Figure 5: Network traffic and anomaly detection dashboard architecture ... 29
Figure 6: An example of how EERC protocols work. ... 35
Figure 7: UC #2 Software Architecture ... 40
Figure 8: UC #3 framework ... 45
Figure 9: VLC test-bed ... 47
Figure 10: UC #3 System Architecture ... 50
Figure 11: UC #3 reference points ... 52
Figure 12: Mitigation Plan Simulation workflow ... 54
Figure 13: Computation of partial KPI values ... 55
Figure 14: Function modelling the bandwidth release and the KPI gain (Linear, Exponentiation, and Logistic) ... 55
Figure 15: PGF Data Model ... 56
Figure 16: PGF High Level Architecture ... 57
Figure 17: Mitigation Plan Simulation tool - High-Level Architecture ... 58
Figure 18: Standard dialogue between AF and PGF ... 61
Figure 19: Example Communication Service Provider A. Young pre-paid user base operator ... 73
Figure 20: Example Communication Service Provider B. Convergent operator – Big corporate user base ... 73
6 / 80
List of tables
Table 1: ONTIC use cases ... 15
Table 2: Use Cases (DoW) − Epics − User Stories correlation ... 24
Table 3: Envisioned improvements in congestion control ... 37
Table 4: New scenarios for enhancing user’s QoE (Updated) ... 48
Table 5: VLC test-bed network configuration ... 68
7 / 80
1. Acronyms and Definitions
1.1 Acronyms
Acronym Defined as
AF Analytics Function
ANDSF Access Network Discovery and Selection Function
AQoE Adaptive Quality of Experience
AFCT Average Flow Completion Time
CAPEX Capital Expenditures
COMPA Control – Orchestration – Management – Policy - Analytics
CSP Communication Service Provider
CSS Cascading Style Sheets
DoD Definition of Done
DoS Denial of Service
DTD Document Type Definition
EERC End-to-End Rate Control
FS Forecasting System
HTTP Hypertext Transfer Protocol
ISP Internet Service Provider
JSON JavaScript Object Notation
KPI Key Performance Indicators
ML Machine Learning
NSE Network Simulation Environment
OFF ONTIC Forecasting Framework
ONTIC Online Network Traffic Characterization
ONTS ONTIC Network Traffic Summary
OPEX Operative Expenditures
PC Policy Controller
PCA Principal Component Analysis
PCAP Packet Capture
PCC Policy and Charging Control
PCCP Proactive Congestion Control Protocol
PCEF Policy and Charging Rule Enforcement Function
PCRF Policy and Charging Rules Function
PDN Packet Data Network
PDP Policy Decision Point
PEP Policy Enforcement Point
PGF Policy Governance Function
QoE Quality of Experience
QoS Quality of Service
RCP Rate Control Protocol
RDBMS Relational Database Management System
REST Representational State Transfer
8 / 80
SQL Structured Query Language
VLC VideoLAN media player
XCP Universal Measurement and Calibration Protocol
9 / 80
2. Purpose of the Document
Deliverable D5.2 purpose is to document the progress on design and implementation of the prototypes that realize the ONTIC use cases previously defined in D5.1, namely (a) Network Anomaly Detection, (b) Proactive Congestion Detection and Control Systems and (c) Adaptive Quality of Experience Control. Additionally, updates in the use case requirements are also shown.
The ONTIC use case development and implementation follows a customized version of the Scrum Agile methodology (as described in deliverable D5.1 [1]); therefore, the requirements are
described as user stories.
The different sections in the document provide:
• Introduction of use cases in terms of their application in CSP environments, operational goals and machine learning algorithms (section 7)
• Use cases requirements, as user stories (section 8.1 ). Definitions of Done (DoD) are provided in Annex D.
• A description of the ongoing use case implementation (sections 8.2 , 8.3 , and 8.4 , respectively).
A complete description of use cases and corresponding prototype will be provided by means of three different deliverables that will be delivered in the third ONTIC year (D5.4, D5.5 and D5.6).
10 / 80
3. Scope
This document provides information about use case requirements (as user stories) and
corresponding prototype implementation. Therefore it is not expected to provide description of algorithms descriptions or a description of the ONTIC Big Data Architecture, as there are specific deliverables for said topics (D3.2 and D4.2, and D2.3, respectively), unless absolutely needed for the understanding of the use case implementation.
11 / 80
4. Intended Audience
The intended document audience includes not only all the partners in the ONTIC consortium (especially those involved in gathering requirements, and in designing, implementing and validating the prototypes) or the receivers of the project. It also includes any reader interested in understanding the ONTIC use cases and the business principles that guide the research within the project.
12 / 80
5. Suggested Previous Readings
It is expected that a basic background on Information and Communications Technology (ICT) is sufficient to address the contents of this document; however, some previous readings are suggested:
13 / 80
6. Executive Summary
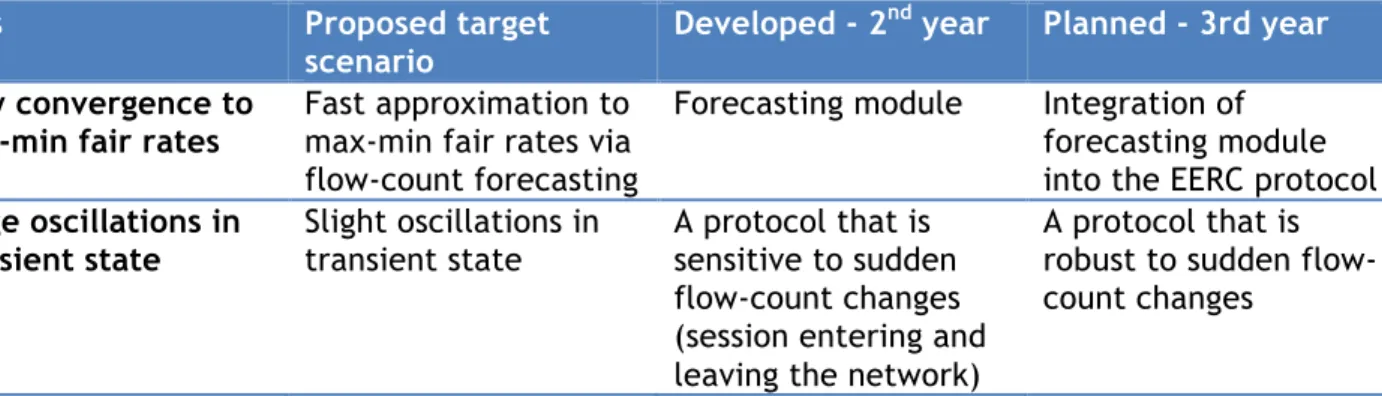
In the context of network management and engineering, ONTIC initially identified (in the DoW) three key scenarios to address the network transformation. During the project’s first year, those initial use cases were refined and assigned a more specific slogan: (UC #1) Network Anomaly Detection; (UC #2) Proactive Congestion Detection and Control Systems; and (UC #3) Adaptive Quality of Experience (QoE) Control. During the project’s second year, a further refinement of the use case requirements have been done, and implementation of some of the functionalities required in each use case have been carried out.
Use Case #1 aims at designing a system able to perform an online monitoring of network traffic for detecting in real-time network anomalies. In order to achieve this goal the Use Case #1 defines a scenario in which the automatic anomaly detection is combined with a user tool (ISP/CSP network administrator oriented tool) to provide full network supervision. In this context the UC #1 specification proposes two subsystems to be designed and implemented: Anomaly Detection Subsystem and Dashboard Subsystem.
UC #1, on the other hand, provides scalable implementations for both subsystems (anomaly detection and dashboard), and introduces the problem of the synchronization between
independent applications and processes that have to process the same Big Data and sharing its results.
Although scenarios #2 and #3 address a network optimization scenario, requirement refinement has led to a clear distinction between both. While UC #2 deal with congestion avoidance at network level, UC #3 aims to optimize user’s QoE when consuming video services.
UC #2 focuses on proactive congestion control in computer networks. Nowadays, congestion can be managed in a variety of ways, such as the avoidance and control scheme of TCP, queue management mechanisms implemented in routers, traffic rerouting and multipath schemes or simply by deploying additional resources. These solutions often result in resource
under-utilization or require careful tuning and planning, and sometimes even additional expenses. To help overcome these issues, ONTIC plans to leverage the wealth of techniques coming from the statistical learning field along with the availability of the ONTS data set to design an efficient congestion avoidance protocol that increases resource utilization and preserves a fair share between different sources. In addition, we have developed a discrete event network simulator that can run simulations with thousands of routers and up to a million hosts and sessions. Section 7.3 provides a brief overview of applicable machine learning algorithms and a description of the problems that we intend to address. Section 8.3 provides a detailed description of the use case requirements, architecture, implementation and evaluation plans. UC #3 has focused on refining its requirement specification and on implementing some of its components. The use case aims at implementing an analytics-enhanced control loop so that it is possible to react to video quality of experience (QoE) degradation situations and apply
alleviation measures. UC #3 deals with this scenario under the umbrella of the so called AQoE (Adaptive Quality of Experience). AQoE comprises several phases including measurement, analytics, policy decision and enforcement, all of them running in the form of a closed control loop. The UC #3 implementation aims at showing how these tasks can be performed in an
automated manner in order to cope with these requirements. This approach detects and corrects deviations on the system’s performance automatically and hence, it is capable of delivering the best video customer experience possible.
The main challenge of the use case is the detection of video QoE degradation patterns, as the ONTS dataset does not provide enough information to efficiently compute Key Performance
14 / 80
Indicators (KPI’s) for video services. Therefore, alternative approaches have been taken: on one hand, a proposal on how to obtain application payload in a safe and secure way by means of a VLC-based test bed; on the other, internally looking for datasets that, even smaller, could contain the necessary information.
At the same time, the UC #3 implementation has focused on designing and developing the functional components that link the Analytics Function that detect video QoE degradation patterns (by using algorithms developed in WP3) with the enforcement elements. That link is realized by means of RESTful interfaces which have been specified and implemented. Finally, a simulation tool for estimating the effects on QoE when applying specific mitigation plans has been also implemented.
15 / 80
7. Use Case Environment
7.1 Overall
ONTIC has specified a number of uses cases for exhibiting the application of its results in CSP (Communication Service Providers) environments. The purpose is to show via close-to-the-market use cases that the proposed off/on-line machine learning (ML) algorithms for traffic analysis provide effective and efficient solutions to critical problems of concern to CSP’s such as network security, congestion avoidance and QoE management.
This chapter outlines the use cases considered by the project in terms of their application context in CSP environments, operational goals and ML algorithms used. These aspects are summarized in Table 1. A detailed description of the use cases including system model, evaluation scenarios and current status of development, is presented in chapter 8. A
comprehensive review of the relevant state of art was included in the previous version of the deliverable, D5.1 [1].
Use Case Goal Machine Learning
Algorithms/Frameworks Reference #1 Network Anomaly
Detection Detect anomalous flows in real-time through online monitoring and traffic analysis Online real-time unsupervised network anomaly detection algorithm (ORUNADA) D4.2, section 5 #2 Proactive Congestion Detection and Control
Dynamically adjust flow rates according to changing load conditions while ensuring fair sharing of resources
Online traffic pattern evolution algorithms for short-term forecasting (Network Traffic Forecasting Framework, NTFF) D4.2, section 4 #3 Adaptive QoE
Control Preserve QoE as per subscription profile and according to respective service provisioning policies following user access dynamics Unsupervised self-configured clustering algorithm (FreeScan) Quality of clustering technique (DiSiLike) Supervised association rules-based traffic classification algorithm (BAC)
Frequent itemset mining algorithm (PaMPa-HD, PaWI)
D3.2
Table 1: ONTIC use cases
The following points are worth mentioning.
The problems addressed by the use cases are of vital importance to CSP’s especially nowadays where we witness an explosion of mobile devices and data-demanding services and applications, indicatively we can mention IoT applications. UC #1 aims at protecting resources and
applications from malicious attacks, UC #2 at optimizing resource utilization using fair-sharing criteria and UC #3 at ensuring user experience within desired levels.
16 / 80
The application of innovative ML algorithms for improving the performance of core network operations is currently gaining momentum. Although ML algorithms for network traffic classification are an active research topic, their integration in closed-loop controls with the available network/service management systems in CSP’s is generally missing. Existing control systems rely on aggregated metrics (totals, averages, min/max) and as such they do not exploit the wealth of evolving structural information that could be extracted from analyzing raw monitored data based on ML techniques. The ONTIC use cases pave the way in this direction; their practical deployment in CSP’s has been discussed in the architectural deliverable, D2.3 [2]. Note that the increasing adoption of Big Data technologies by CSP’s, even as an alternative data warehouse, facilitates the deployment of the ONTIC algorithms.
Last but not least, the use cases combine ML and telecoms expertise, which is well represented in the ONTIC consortium by the mix of academic and industrial partners, respectively. Such a combination is outmost essential since it is commonly recognized that the application of ML algorithms in specific domains needs to utilize intimate knowledge of the domain itself. ML algorithms assume a generic, domain-agnostic, input model –a space of points with attributes- which obviously needs to be customized to specific application needs. This customization becomes even crucial for the application of ML traffic analysis algorithms in CSP domains since yielded analytics may trigger actions that impact on network performance, quality of the offered services and customer experience.
7.2 Use Case #1 - Network Anomaly Detection
UC #1 aims at designing a system able to perform online monitoring and analysis of network traffic for detecting in real-time network anomalies. As already described in deliverable D5.1 [1], the related literature refers to two kinds of ML approaches for anomaly detection: The first one leverages previously acquired knowledge as signatures or statistical models for supervised learning-based approaches. The second one does not consider any acquired knowledge or
training stage for initiating and configuring the detection system and its constituting algorithms. All knowledge is produced online by monitoring and analyzing network traffic. Unsupervised learning algorithms are well fitted for such objectives.
The context and objectives of UC #1 as explained in D5.1 can be summarized as follows: • Anomalies (including attacks) are a moving target, as new anomalies and attacks arise
every day. Network traffic is also constantly evolving with new applications and services appearing very frequently. The detection of new unknown anomalies (called 0d
anomalies) in this changing environment is essential, and an objective of the ONTIC project. The signature and supervised learning approaches are therefore not fulfilling the requirements, as signatures and traffic statistical models have to be humanly produced, in an offline way, thus leading to long delay and cost. In addition, supervised learning approaches require training the system before the detection phase. The training then requires previously labeled traffic traces containing the labels for all applications and anomalies the system needs to know for performing the detection work. Of course, building labeled traces is a very time consuming task, while it is prone to errors that can impact on the performance of the detection system afterwards.
• Traffic needs to be autonomously characterized and classified (as much as possible) in order to autonomously make a decision concerning the treatment to apply on the isolated traffic classes (legitimate or illegitimate). Relying on human network administrators for deciding whether a flow is legitimate leads to very poor temporal performances, and can even be useless if the attack finishes before the administrators can cope with it (attacks, for instance, are generally triggered at night, during days off, when very popular events arise, etc. i.e. when network administrators are not supposed to be at work).
17 / 80
Given the presented context and objectives, unsupervised learning is the only promising approach. UC #1 then aims at leveraging the online unsupervised learning algorithms based on clustering designed in WP4 for building a system able to detect anomalies (including 0d ones) and apply countermeasures in real-time, autonomously, and without relying on a human network administrator, previously labeled traffic traces for training, or anomaly signatures.
Practically speaking, the system to be developed in UC #1 is strongly needed for any network administrator: they require a tool able to display traffic monitoring results, as well as able to detect anomalies, the strongest need being related to Denial of Service (DoS) attacks. Many commercial tools exist for that purpose, but they generally lack efficiency in terms of anomaly detection: they leverage very poor first order statistics that are absolutely not suited in the context of the highly variable and versatile traffic nature. As a result, their ability to detect DoS attacks is very limited leading to high false positive and false negative rates. For instance, this is the case for the recent AlienVault solution,1 which aims at providing unified security monitoring, security events management and reporting, and continuous threat intelligence, as well as
multiple security functions. However, it lacks real-time features and does not work in an autonomous way. Thus, it lets most of the work to the network administrator and shows a limited usefulness.
UC #1 and its supporting real-time unsupervised network anomaly detection algorithm developed by the project aim at fixing the flaws of tools such as AlienVault. It does so by providing a fully real-time, scalable and autonomous monitoring and anomaly detection tool, able to
autonomously trigger counter-measures for security purposes. It is described in section 8.2 .
7.3 Use Case #2 - Proactive Congestion Detection and Control
System
For coping with congestion in communications networks, two main approaches can be
distinguished: congestion control techniques that reactively deal with congestion problems, that is, after the network is detected to be overloaded; and, congestion avoidance techniques that proactively prevent congestion problems from happening, taking ameliorative actions before the network becomes overloaded.
In UC #2, the project members are working on a variety of techniques for designing an effective congestion avoidance mechanism, based on the principles of fairness, statistics, machine
learning and time series analysis. Our goal is to design a distributed protocol that can rapidly approximate the max-min fair share across the network, that is, a fair share of available bandwidth between existing flows without wasting any resources.
In an environment such as the Internet, where huge amounts of heterogeneous traffic traverse complex network topologies every second, the problem of approaching max-min fair rates efficiently in practical scenarios remains unresolved. There exists a wide variety of protocols and algorithms that try to combat congestion or maximize bandwidth usage. Perhaps the most well-known one is the avoidance and control scheme of TCP Reno, which increases the
congestion window linearly (after an initial quadratic period) until packet loss is detected, triggering a multiplicative decrease of the transmission rate. Other mechanisms, implemented in routers, resort to local actions and/or signaling when congestion is detected in their queues. This can be done by dropping packets or by flipping the explicit congestion notification (ECN) bits in the IP header. More recently, certain protocols have been proposed to notify sources of
1 https://www.alienvault.com/products
Indeed, only the demo version of the tool was tested and evaluated, as the price of the tool was not affordable.
18 / 80
the exact transmission rates that they are should use for optimal link utilization. As previously stated, a more detailed overview can be found in D5.1 [1].
Existing congestion control and avoidance techniques present certain issues. These, along with certain challenges that must be addressed by congestion control protocols in general, can be summarized as follows:
• Scalability: protocols must not be dependent on the number of flows that are traversing the network and must continue to behave in a stable manner when the size of the network grows.
• TCP friendliness: Since TCP is still predominant in today’s Internet, new protocols must not be sensitive to its presence nor should they interfere with its operation or impact on its performance. A negative impact that congestion control schemes can have on TCP is the problem of global synchronization, that is, the simultaneous reaction of all TCP sources crossing a TailDrop link.
• Misbehaving hosts: This is a self-evident and complex problem which remains unresolved for many network protocols and systems. Orthogonal means, such as real-time protection mechanisms (see UC #1) need to be in place since the malicious behavior of sources seem infeasible to be predicted.
RED and WRED [12], which are perhaps the most widely deployed router congestion control algorithms, address some of the above issues. By randomly dropping a selection of packets, they avoid congestion built-up without causing global synchronization. In addition, they do not need to store per-flow information and are specifically designed for TCP. However, RED and WRED are sensitive to their parameters, which are very difficult to tune [13]. Although there have been attempts to overcome this, the suggested approaches have not been widely tested and deployed.
The family of protocols known as Explicit End-to-End Rate Control (EERC) constitutes a promising area of research, since they explicitly allocate bandwidth for each session depending on link capacities and path constraints. Existing explicit rate allocation mechanisms in the literature, however, present two key problems:
• Scalability: Via simulations, we have observed that the most representative of these proposals either store per-flow information in the router or suffer from heavy oscillations in the computed rates when the network size and complexity grows.
• Signaling delays: Another fundamental problem is the time it takes for rate allocation signals to reach the corresponding sources. In a highly dynamic environment such as the Internet, where the number and nature of sessions crossing the network is constantly changing, a decision made at a network link might be outdated once it reaches the recipient hosts.
This approach to congestion control is currently receiving attention from key figures in the field of computer networks such as Nick McKeown, Professor of Computer Science and Electrical Engineering at Stanford University and one of the main contributors to the creation of Software Defined Networking (SDN) and OpenFlow. Prof. McKeown’s team has recently published several works on explicit rate allocation for congestion control [23] and has contacted us in order to share the code of our previous congestion control proposal SLBN [14] to be included in a benchmark paper his team is preparing.
UC #2 aims at providing a distributed congestion control protocol that successfully overcomes the above issues, leveraging the ML-based short-term forecasting algorithms developed by the project. It is described in section 8.3 .
19 / 80
7.4 Use Case #3 - Adaptive QoE Control
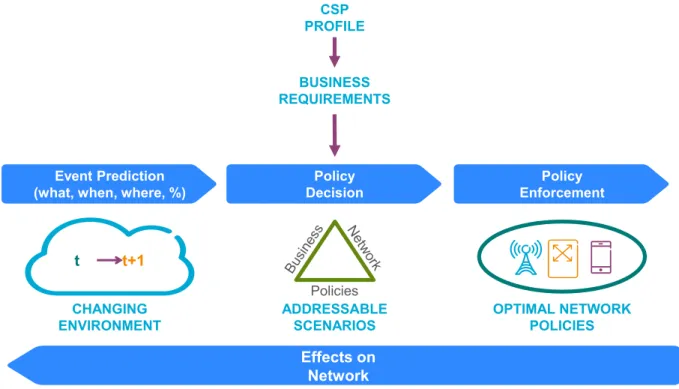
UC #3 addresses the problem of Adaptive QoE (AQoE) management. It is built around two main concepts: (a) the online detection of Quality of Experience degradation situations, and (b) the use of such insights to trigger mitigation actions so that the QoE in a telecommunication network is enhanced.
Execution of said alleviation policies will take advantage of the availability of a comprehensive framework able to (a) gather the generation of analytics insights, (b) determine what to do (which actions to perform) upon reception of an insight, and (c) execute the determined actions. In [8], Ericsson introduced the COMPA (Control/Orchestration/Management/Policy/Analytics) architectural model, which aims to simplify the operations both in management and business processes of a telecommunication network. It consists of several components outlined below:
• Analytics is in charge of turning data into information and insights that serve as a basis for decision making and triggering actions.
• Policy is a function that governs the behavior of a telecommunication system.
• Management is the function that, operating in full lifecycles, coordinates the efforts to accomplish goals and objectives using available resources efficiently and effectively. • Control is responsible for negotiating, establishing, maintaining and terminating dynamic
data/user plane connections.
• Orchestration describes the automated arrangement, coordination, and (resource) management of complex communications systems, middleware, and services (including networking).
The control loop described by COMPA begins with the Analytics function. It processes data and applies analytics to discover and understand trends and patterns. Next, it sends the
corresponding insight as a Policy Trigger (along with the context garnered from the insight) into the Policy function. The Policy function establishes the network situation led by the trigger and either recommends a set of actions or decides to take direct action(s) on the system. The Policy function sends the outcome of its decision making as a request to COM (collectively denoting the Control, Orchestration and Management functions). Upon receiving a request, COM attempt to act on it. The final results are vendor-, node-, and domain-specific actions that can be enforced. The internal feedback shown in Figure 1 allows the loop to self-stabilize. Feedback from
requests can direct future decision making.
20 / 80
The Adaptive QoE scenario of UC #3 fits very well into the above model and therefore its architecture (presented in D5.1) has been aligned with the COMPA architecture. In particular, the Analytics Function identified in the Adaptive QoE scenario has been modelled as the “A” in COMPA while the functionalities assigned to the Policy Governance Module have been mapped to the “P” in COMPA.
To the end of distilling QoE insights from raw network data, the Analytics Function utilizes ML algorithms across three different families:
1. unsupervised learning, 2. supervised learning, and
3. frequent itemset mining with association rule extraction.
These algorithms, each from its own perspective, try to spot out current and evolutionary traffic patterns indicating or (proved of) causing QoE degradation. Note that the policy- policy-based design of the QoE use case can afford non-stringent predictions in terms of accuracy and time window ahead.
Unsupervised techniques, i.e. clustering, are used to analyze unlabeled data. The basic idea is to split the input dataset into heterogeneous clusters, minimizing intra-cluster differences. The approach allows us to summarize the original data into a relatively small set of clusters that can be manually handled and deeply analyzed as homogeneous aggregates. In the specific
application context, the input dataset is represented by a collection of network flows that need to be appropriately characterized so that unsupervised clustering techniques are able to group together traces enjoying QoE at similar levels. These techniques usually require configuration parameters which can be challenging to tune up, especially when dealing with very large amount of data. For this reason, we have developed clustering implementations able to automatically find the best parameter configuration (see FreeScan in D3.2 [4]).
For asserting on the levels of provided QoE, clustering quality becomes critical. The evaluation of the clustering quality is a very challenging task in a Big Data context, because of the lack of scalable evaluators able to address non-convex cluster shapes in high-dimensional datasets. To this end, we have introduced DiSiLike (see D3.2), a scalable distributed Silhouette-like tool to measure clustering quality. Both FreeScan and DiSiLike contribute to the SaFe-NeC framework (see D3.2 [4]), which aims at providing a semi-automatic network traffic characterization tool. In SaFe-NeC, the learning nature of the clustering technique, coupled with the
self-assessment indicators and domain-driven semantics used to enrich the data mining results, are used to build a model from the data. The process requires minimal user intervention and allows to highlight potential meaningful interpretation to domain experts. At the same time, the framework is able to track the quality degradation of the model itself, hence being a promising tool for the QoE evaluation and prediction.
Supervised learning algorithms are a set of techniques able to analyze labeled data and predict the proper labels for unclassified data. The principle is to create a model by analyzing a training dataset and apply the model to new unlabeled data. In a networking environment, a common application is the classification of the application service from flow datasets, such as video streaming, P2P traffic, VoIP, etc. In such context, we have developed BAC (see D3.2), a scalable classifier which leverages bagging and association rules to compute data classification. The capability to handle very large datasets while providing good predictions is a key component in addressing QoE by combining information about the number of active flows per application service.
The last family of techniques includes Frequent Itemset Mining algorithms, which aim to extract frequent co-occurring set of objects / items and highlight hidden correlations among data. Currently, a set of Apache Hadoop and Spark frequent itemset miners able to deal with large
21 / 80
amount of transactions are available. However, these approaches have very low performance with datasets with a lot of features. Hence, we introduced PaMPa-HD, a Parallel MapReduce-based frequent closeditemset mining algorithm for high-dimensional datasets. The algorithm is able to scale with the number of features, allowing to process very high-dimensional datasets, which are very common in many domains. In the specific context of network traffic analysis, datasets with hundreds of features for each flow can be translated into thousand-feature
datasets when multiple temporally-adjacent flows are considered as a single transaction. Hence, such high-dimensional traffic datasets allow us to address the temporal evolution of network traffic, which is essential for predicting QoE.
Finally, PaWI, a Parallel Weighted Itemset miner, allows us to include item relevance weights into the mining process. The technique, which is a major extension of traditional mining algorithms, allows network domain experts to drive the itemset extraction with an ad-hoc weight assignment. This enables highlighting the behavior of different classes of traffic with respect to QoE.
Finally, it is worthy to mention that, provided that the use case focuses on video services, the following tools will be used for the implementation and test of certain aspects of UC #3 functionalities, mainly those related to the capturing and pre-processing of video traces:
• VideoLAN (VLC),2 a free and open source cross-platform multimedia player and framework able to play most multimedia files as well as various streaming protocols. • Tstat v3.0,3 a passive sniffer able to provide insights on the traffic patterns at both the
network and the transport levels.
2 http://www.videolan.org/
22 / 80
8. Use Cases Description
8.1 Use cases, epics and user stories
In this section we provide a detailed description of the three different scenarios addressed by ONTIC by means of user stories:
1. Use Case #1. Network Anomaly Detection
2. Use Case #2. Proactive Congestion Detection and Control 3. Use Case #3. Adaptive Quality of Experience (QoE) Control
In accordance with the Agile methodology, the use cases have been turned into so-called epics (high level user stories). However, although in D5.1 [1] a common epic was
introduced to cover both UC #2 and UC #3, in order to clarify the scope of each use case, a different epic has been provided. Additionally, new user stories have been introduced while existing ones have been refined.
Use Case (ONTIC DoW) Epic (as translated in project execution time) User Stories (as working items)
UC #1 - Network Anomaly Detection
User Story 1 (UC #1):
As a CSP or ISP network
administrator, I want
an autonomous method for detecting and characterizing traffic anomalies, so that it makes it possible to autonomously and efficiently manage them. US 1.1
As a CSP or ISP network administrator, I want a
mining mechanism, so that traffic classes can be autonomously distinguished.
US 1.2
As a CSP or ISP network administrator, I want a
discrimination mechanism so that anomaly signatures can be autonomously issued.
US 1.3
As a CSP or ISP network administrator, I want a
ranking score for assessing the abnormality and dangerousness of anomalies, so that an autonomous process can choose between discarding attacks and coping with legitimate anomalies.
US 1.4
As a CSP or ISP network administrator, I want to have
monitoring tools and exchange formats and protocols, so
that the results from both traffic monitoring and anomaly
detection algorithms can be displayed live.
UC #2 - Proactive Congestion Detection and Control
User Story 2 (UC #2)
As a CSP or ISP
network administrator, I want to have a
bandwidth allocation protocol that rapidly maximizes the
utilization of available resources, distributes them fairly among
US 2.1
As a CSP or ISP network administrator, I want to have
a bandwidth sharing mechanism that is deployable in an incremental manner, so that I can progressively adapt my infrastructure.
US 2.2
As a CSP or ISP network administrator, I want to
have a bandwidth sharing mechanism that scales well with traffic volume and client count, so that it can remain effective when my network grows in size.
23 / 80
existing users and prevents links from becoming congested, so
that I can provide a
better service to my customers while maximizing resource utilization.
US 2.3
As a CSP or ISP network administrator, I want to
have a bandwidth sharing mechanism that detects and reacts to misbehaving hosts, so that my network remains operational in case of unexpected or malicious user behavior.
US 2.4
As a CSP or ISP network administrator, I want to
have a bandwidth sharing mechanism that can detect trends in its variables and make reliable forecasts, so
that rate assignments correspond to an up-to-date
state of the network when the source nodes become aware of them.
UC #3 - Adaptive QoE Control
User Story 3 (UC #3)
As a CSP or ISP network
administrator, I want to have an efficient
way to manage QoE, so
that I can make
decisions about what applications and services to prioritize.
US 3.1
As a CSP or ISP network administrator, I want to
characterize QoE of video-based services, so that I can know how to detect QoE degradation in the said type of services.
US 3.3
As a CSP or ISP network administrator, I want to be
able to measure key per-service performance indicators for selected video services, so that I can determine how the applied network policies affect active video services.
US 3.4
As a CSP or ISP network administrator, I want to
have tools on the network side to change priorities and resource assignment, so that I can give users the best possible QoE for video services.
US 3.5
As a CSP or ISP network administrator, I want to
have an analytics function (AF) able to make QoE degradation predictions, so that I can understand the key influencing factors and plan in advance mitigation actions.
US 3.6
As a CSP or ISP network administrator, I want to
determine which users are in a given location at a given time, so that I can apply policies only on specific (groups of) users.
US 3.7
As a CSP or ISP network administrator, I want to
have a simulation tool, so that I can estimate the impact on the network and users as a result of the application of mitigation policies determined to apply. US 3.8
As a CSP or ISP network administrator, I want to
have a function (PGF) to manage all the information, predictions, actuation, etc. coming from the Analytics function, so that I can use it to build a clear picture of the current QoE status.
24 / 80
Table 2: Use Cases (DoW) − Epics − User Stories correlation
8.2 UC #1 (User Story 1): Network Anomaly Detection
8.2.1 Scenario description
As stated in D5.1 [1], network anomaly detection is a vital component of any network in today’s Internet. Ranging from non-malicious unexpected events such as flash-crowds and failures, to network attacks such as denials-of-service and network scans, network traffic anomalies can have serious detrimental effects on the performance and integrity of the network. The principal challenge in automatically detecting and characterizing traffic anomalies is that these are moving targets. It is difficult to precisely and permanently define the set of possible anomalies that may arise, especially in the case of network attacks, because new attacks as well as new variants of already known attacks are continuously emerging. A general anomaly detection system should therefore be able to detect a wide range of anomalies with diverse structures, using the least amount of previous knowledge and information, ideally none.
ONTIC UC #1 aims at designing a new autonomous anomaly detection system based on original unsupervised machine learning algorithms designed for that purpose. The most important feature of the anomaly detector under design is that it does not rely on previously acquired knowledge, it does not need any training phase or labeled data, and it is expected not to leverage on a human operator for making a decision on the status of detected anomalies (legitimate vs. attack or intrusion for instance). It aims also at triggering the appropriate counter-measures.
However, based on the second year research results in WP4, it appears that it would not be possible for the anomaly detection to autonomously make a decision for all anomalies. The new functionality that is required, and has been added in the design of the new anomaly detection system is a network traffic analytic dashboard. It aims at providing the human administrator with the required elements gained by the detection algorithms in order for her/him to decide whether the anomaly is legitimate or not, and apply the suited counter-measure. It includes two sets of information:
• Legacy monitoring information on the flowing traffic.
• The characteristics of the detected anomalies as determined by the employed
autonomous traffic clustering algorithm, as well as traffic statistics associated to the period in which the anomalies have been detected.
8.2.2 User Requirements
The functional specification for UC #1 is described as a set of user stories exposed below:
• As a CSP or ISP network administrator, I want an autonomous method for detecting and characterizing traffic anomalies, so that it makes it possible to autonomously and
efficiently manage them.
o User Story 1.1: As a CSP or ISP network administrator, I want a mining mechanism, so that traffic classes can be autonomously distinguished.
• User Story 1.1.1: As a CSP or ISP network administrator, I want to have efficient monitoring and unsupervised clustering techniques and related analytics, so that I can autonomously classify the network traffic. →Implementation ongoing
o User Story 1.2: As a CSP or ISP network administrator, I want a discrimination mechanism, so that anomaly signatures can be autonomously issued.
25 / 80
• User Story 1.2.1: As a CSP or ISP network administrator, I want to have mechanisms for identifying the most significant traffic attributes, so that it becomes possible to issue traffic class discrimination rules.
→ Implementation ongoing
o User Story 1.3: As a CSP or ISP network administrator, I want a ranking score for assessing the abnormality and dangerousness of anomalies, so that an autonomous process can choose between discarding attacks and coping with legitimate anomalies
• User Story 1.3.1: As a CSP or ISP network administrator, I want to have accurate abnormality scores, so that it becomes possible to autonomously discriminate between legitimate and illegitimate traffic classes.
→ Implementation ongoing
o User Story 1.4: As a CSP or ISP network administrator, I want to have
monitoring tools and exchange formats and protocols, so that the results from both traffic monitoring and anomaly detection algorithms can be displayed live.
• User Story 1.4.1: As a CSP or ISP network administrator, I want to have a data network traffic dashboard to show traffic and flow statistics,
anomaly detection details, etc., so that I will be able to analyze data traffic features and to study in deep the anomalies detected.
- User Story 1.4.1.1: As a CSP or ISP network administrator, I want to get traffic analysis charts, so that I can have a well-aimed knowledge about the state of the network.
» User Story 1.4.1.1.1: As a CSP or ISP network administrator, I
want to get a traffic analysis visualization tool, so that I can
view overall traffic statistics regarding IPs, ports, type of service, bytes, etc.
→ Implementation ongoing
» User Story 1.4.1.1.2: As a CSP or ISP network administrator, I
want to get a flow analysis tool, so that I can view precise
statistics related to traffic flows, such as conversations. → Implementation ongoing
» User Story 1.4.1.1.3: As a CSP or ISP network administrator, I
want the anomaly detection tool to show a warning message
whenever an anomaly has been detected, so that I can become aware of the situation any time it happens and obtain further information by accessing the tool.
→ Implementation ongoing
» User Story 1.4.1.1.4: As a CSP or ISP network administrator, I
want to be able to specify the time interval the traffic analysis
refers to by choosing between the last minutes (counted from current time) or a time interval specified by arbitrary start and end times and dates, so that I have a flexible way to review the traffic and get further details of any anomaly or relevant event. → Implementation ongoing
- User Story 1.4.1.2: As a CSP or ISP network administrator, I want to get an anomaly detection tool, so that whenever a traffic anomaly is detected I will be aware of it at once, along with its details, and I can check traffic statistics for the specific period when the anomaly happened.
26 / 80
- User Story 1.4.1.3: As a CSP or ISP network administrator, I want to have a set of administration procedures, so that it is possible to manage and configure different system features.
→ Implementation ongoing.
- User Story 1.4.1.4: As a CSP or ISP network administrator, I want to have a login/password authentication procedure, so that it is possible to prevent unauthorized parties from accessing the anomaly
detection tool.
→ Implementation ongoing
8.2.3 System model
8.2.3.1
Functionalities
Based on the specification of the user stories US 1.1 through US 1.4, two main system functions need to be provided: (a) an autonomous system for detecting and characterizing traffic
anomalies, making it possible to autonomously and efficiently manage them, and (b) a
dashboard for enabling network operators to access details about network traffic features and statistics, near real-time, anomalies detected and traffic behavior during the periods in which the anomalies are detected.
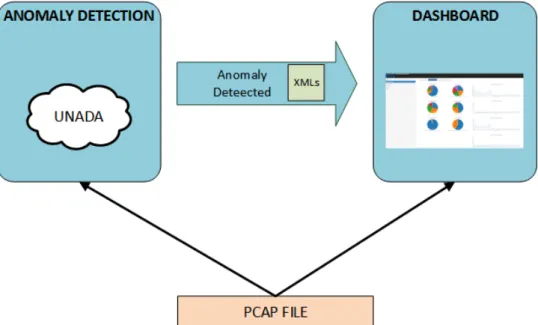
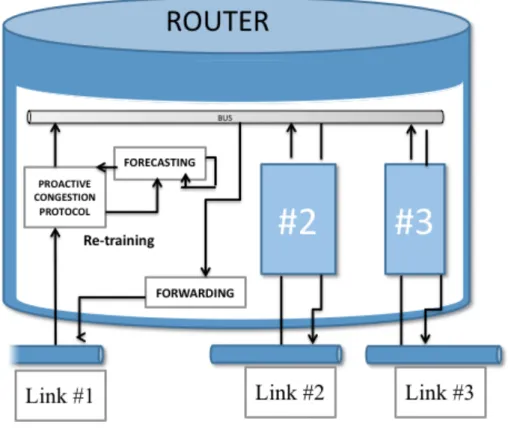
Figure 2 represents the high level working schema representing the PCAP file, containing traffic traces, as the input to the two subsystems −the anomaly detection and the dashboard
subsystems. The results of the anomaly detection process in the form of XML files are fed as input to the dashboard.
Figure 2: Use Case #1 High-level Architecture
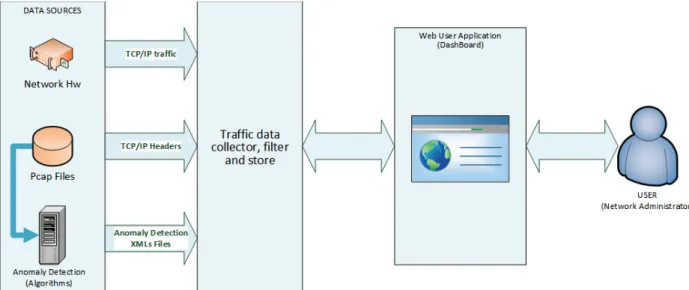
The specific functionalities of the dashboard (Figure 3) are:
• Network traffic capturing, near real-time, from different formats (PCAP and NetFlow) and from different sources through a scalable software system that supports elastic growth of the traffic rate.
• Capturing data from external analysis systems (for example, analysis results about anomalies from the anomaly detection subsystem, but could be more).
27 / 80
• Transforming received raw data (PCAP, NetFlow, XMLs with anomaly analysis results, etc.) into structured records.
• Storing all received data and processing it in a scalable and elastic data base. • Query and structured presentation in graphical and alphanumeric form of the stored
data.
Figure 3: UC #1 Dashboard Functional View
Specific inputs to the dashboard are: • PCAP files.
• NetFlow records received through a pre-defined UDP port.
• XMLs files sent by the anomaly detection system with the identification of the anomalous flows and their description.
The output of the dashboard is a user web interface (network operator oriented) shown as an analytical dashboard which presents traffic analysis information in a structured way with graphics and alphanumeric data.
8.2.3.2
Software architecture
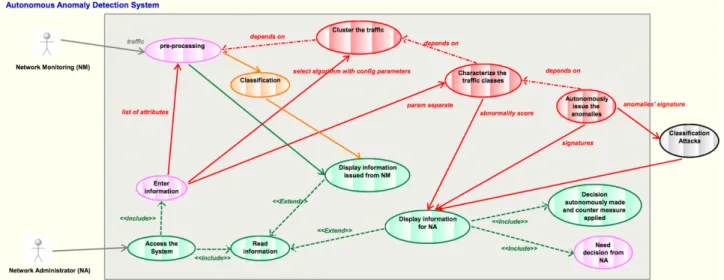
The software architecture and related relations between the different components of the use case are depicted in the UML diagram shown in Figure 4. The diagram also uses colors to distinguish contributions from different work packages:
• Red is the color of contributions from WP4 on online clustering algorithms for anomaly detection;
• Orange corresponds to the classification algorithms provided by WP4 for traffic evolution analysis;
• Green and pink correspond to the modules implementing the dashboard system; they relate to pre-processing traffic data, computing statistics, processing anomaly detection reports and the visualization of all the information related to statistics and anomaly detection;
• Grey represents a module that is not directly under the scope of this use case, but it has been included as it can significantly improve the use case demonstration.
28 / 80
Figure 4: UML specification of UC #1 on anomaly detection
This UML diagram shows two main threads: the information processing and results presentation thread and the anomaly detection thread:
• The information processing and results presentation thread is devoted to traffic
monitoring and real-time results display in the dashboard. It comprises two modules: 1. “Display information from NM (Network Monitoring)”: It is fed with processed
traffic records (by the “pre-processing” module) and anomaly classification results (by the “classification” module) and performs the necessary
computations for issuing a real-time display of selected traffic features. 2. “Display information for NA (Network Administrator)”: It gets information
from the clustering algorithms employed for detecting traffic anomalies. And, it displays live in the dashboard the characteristics of the found traffic
classes, the abnormality scores, and the results of attack classification (initially not planned to be included in ONTIC) in order to help the human network administrator to make a decision (“Need decision from NA”). If the anomaly detection system can autonomously make the decision, the
dashboard will display that an action has been made, for example, a text alert as “Decision autonomously made and counter measure applied”, along with details about the measure applied.
• The anomaly detection thread comprises the modules implementing the core anomaly detection algorithm. Specifically, it includes three main sequential steps: clustering the traffic, issuing the characteristics of the traffic classes, and
autonomously issuing the anomalies (when autonomous detection is possible, otherwise leveraging on the attack classification module).
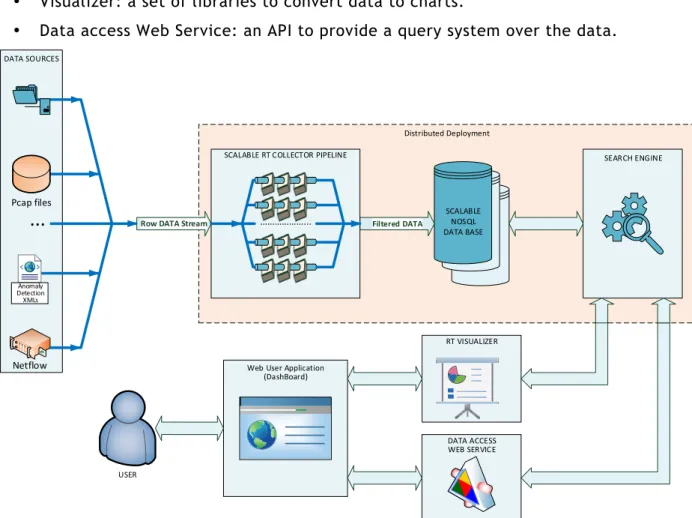
The design and implementation of the unsupervised network anomaly detection algorithm is presented in deliverable D4.2 [5]. The architecture of the dashboard subsystem is depicted in Figure 5; it is made up of the following components:
• A set of data traffic sources such as:
o ONTIC network traffic summary data set: PCAP files with captured traffic. o Anomaly detection system: XML files with information on the identified
29 / 80
o Network Hardware: NetFlow v5 records.4
• Network traffic data collector module: scalable pool of pipelines to pre-process input data. Pipelines are commonly associated to data sources. The following pipelines are implemented:
o PCAP pipeline: It reads PCAP files and converts TCP/IP headers to flows in NetFlow format.
o NetFlow Pipeline: It receives NetFlow records through a defined UDP port and preprocesses these records, for example, for creating new tuples with
conversations detected in the traffic, and stores the resulted data in the database.
o Anomaly detection pipeline: It receives XML files from the anomaly detection engine (from a commonly agreed file directory or through a Web Service implemented in the dashboard system), parses the XML files (e.g. to
discriminate between new and previous anomalies that continue active) and writes the resulted data in the database.
• Scalable NoSQL Database: to store data.
• Search Engine: to provide an interface to data access. • Visualizer: a set of libraries to convert data to charts.
• Data access Web Service: an API to provide a query system over the data.
Figure 5: Network traffic and anomaly detection dashboard architecture
4
http://www.cisco.com/c/en/us/td/docs/net_mgmt/netflow_collection_engine/3-6/user/guide/format.html
Web User Application (DashBoard) Distributed Deployment DATA ACCESS WEB SERVICE DATA SOURCES SCALABLE NOSQL DATA BASE Netflow Pcap files
...
RT VISUALIZER SEARCH ENGINE Filtered DATA USER Anomaly Detection XMLsSCALABLE RT COLLECTOR PIPELINE
30 / 80
8.2.3.3
Enabling technologies
The technologies, products, and libraries used to implement the use case are: • Apache Spark 1.5.15 as cluster computing framework.
• Apache Kafka 2.106 as message broker. • Elasticsearch 1.7.37 as NoSQL Data Base.
• D3.js (3.5.12) / C3.js (0.4-10)8, JavaScript libraries for data visualizations.
8.2.3.4
API specification
The output interface defined for the anomaly detection engine is a XML generator (it generates XML files periodically at specified time intervals). Each XML contains a list of attributes that define the anomalies detected in the period.
The dashboard receives and processes the XML files as soon as they arrive. Two such interface means are provided: through files written into a defined file directory or through a Web Service interface implemented in the dashboard system to which XMLs could be sent continuously. The following DTD defines the legal building blocks of the XML files sent by the anomaly detection engine to the dashboard. It describes the document structure with a list of legal elements and attributes. The DTD is associated to a particular XML document by means of a document type declaration (DOCTYPE):
<!DOCTYPE UNADA SYSTEM "/path/to/file.dtd"> <!DOCTYPE UNADA[
<!ELEMENT UNADA (anomaly+)>
<!ELEMENT anomaly(flow, signature)> <!ELEMENT flow (attributes+)>
<!ELEMENT attribute (#PCDATA)> <!ELEMENT signature (rule+)> <!ELEMENT rule>
<!ATTLIST UNADA start CDATA #REQUIRED> <!ATTLIST UNADA end CDATA #REQUIRED> <!ATTLIST UNADA file CDATA #REQUIRED> <!ATTLIST UNADA aggreg CDATA #REQUIRED> <!ATTLIST anomaly type CDATA #REQUIRED> <!ATTLIST flow id CDATA #REQUIRED>
<!ATTLIST attribute dim CDATA #REQUIRED>
<!ATTLIST signature scoreDiss CDATA #REQUIRED> <!ATTLIST rule dir CDATA #REQUIRED>
<!ATTLIST rule dim CDATA #REQUIRED> <!ATTLIST rule value CDATA #REQUIRED> ]) 5 http://spark.apache.org/ 6 http://kafka.apache.org/ 7 https://www.elastic.co/products/elasticsearch 8 http://c3js.org/
31 / 80
8.2.4 Performance Evaluation
8.2.4.1
Relevant Metrics
8.2.4.1.1 Anomaly Detection
The evaluation of the anomaly detection system is two-fold. It consists of evaluating both the quality of the detection (as well as the classification) of the anomalies in the traffic, and the detection time (it is expected to have a fast response for being able to trigger counter measures for mitigating the anomalies).
Detection quality
The evaluation of the detection and classification quality relies on the use of classical metrics, as TPR (True Positive Rate), FPR (False Positive Rate), FNR (False Negative Rate), and ROC curves (Receiver Oriented Curves).
• TPR is the ratio between the number of well detected (or well classified) anomalies and the total number of anomalies.
• FPR is the ratio between the number of wrongly detected anomalies and the total
number of anomalies. It corresponds to a system detecting anomalies that do not actually exist in the traffic.
• FNR is the ratio between the number of undetected anomalies and the total number of anomalies. It corresponds to the number of anomalies the system was unable to detect. • A ROC curve is the representation of the TPR depending on the number of wrong
detections, with wrong detections being the sum of FPR and FNR. On such a curve, the line TPR=FPR+FNR corresponds to the performance of a random detection process. The ideal curve has the equation TPR=1 for FPR+FNR>0. The closest from this top line, the better the detection system.
Detection time
The detection time is the time that elapses between the moment the first packet of an anomalous flow enters the network and the moment the detection system raises an alarm for this flow. This obviously relates to the time required for ingesting data to the system and the execution time of the detector.
8.2.4.1.2 Dashboard
The main metrics defined for the dashboard software application are: • The time required to export PCAP to NetFlow files.
• The time required to process NetFlow packets and send them to the database. • The time required to import all processed NetFlow packets into the database. • The time required to execute queries to the database as a function of the size of
the data stored.
8.2.4.2
Mechanisms
8.2.4.2.1 Anomaly Detection
Performing such a quality evaluation of the detection system requires a set of labeled traces, i.e. traces for which all anomalies are known and labeled. This is practically a very strong
32 / 80
constraint, and really impossible to respect. Indeed, two kinds of labeled traces exist: synthetic and real.
Synthetic traces are traces that have been built for that purpose. It consists of traffic (real or artificially generated) in which artificial anomalies have been injected. The advantage of this approach is that all anomalies are perfectly known and classified. The main drawbacks are related to the unfortunately limited number of anomalies and anomaly kinds injected, and their limited realism. Examples of such traces include the famous KDD dataset that has been widely used for years. Its advantage is its availability, and remains today the largest dataset of this kind. On the other side, it is quite aged.
Real labeled traces are traces that have been collected on real commercial or public networks, and for which an anomaly detection process has been applied for detecting the anomalies
contained in the trace. This process can be handmade in some cases, or rely on existing anomaly detection tools. The advantage of this kind of labeled traces is its realism, and it is interesting for evaluation purposes. On the other side, it is not guaranteed that the applied detection process detected all anomalies and that the detected anomalies have been well classified. It can therefore lead to errors and unfair deviations when the evaluation of a new detection tool relies on such traces. Up to our knowledge, the largest publicly available dataset of this kind has been collected by the MAWI working group of the WIDE project9 on a trans-Pacific link between Japan and USA. Traces are collected every day since year 2000 on the basis of 15 minutes of traffic collected every day, plus on some particular days, full day traces.
The anomaly detection system developed for UC #1 will be evaluated on these two kinds of datasets, namely KDD’99 and MAWI. We also intend to create our own synthetic dataset in order to include more recent anomalies and attacks than the one included in KDD’99. Finally, even though the ONTS dataset is not labeled and cannot be used directly to measure the accuracy of our algorithms, the project members still plan to take advantage of its availability. Once the anomaly detection system has been validated based on the synthetic traces, it will be used for discovering and classifying the anomalies contained in the ONTS traffic dataset. In addition, an exploratory analysis process will also be performed in order to locate possible anomalies in the collected traffic. If any anomalies are located, the labels will be used to validate the ONTIC methods against existing unsupervised anomaly detection algorithms.
8.2.4.2.2 Dashboard
In this section we discuss the performance of the dashboard and we analyze the system to detect the bottlenecks and obtain an estimate of hardware resources and architecture needs to monitor the links. The dashboard system performs two main tasks: processing incoming NetFlow data and output to dashboard.
For analyzing the performance of the NetFlow information storage procedure the following tasks have to be considered:
• Processing headers to export them as NetFlow version 5 data. • Processing NetFlow version 5 data and shipment to the database. • The insertion in the database.
For displaying the information the following considerations have to be taken into account: • Implementing web services to request information and return graphical results and
ensuring that the throughput is high enough to avoid information loss.
33 / 80
• Implementing the queries from the dashboard business logic to the database. • The drawing procedure at the browser.
Thus, the dashboard system has to support insertions in the database (from the collectors) and queries to draw the analysis results (through the web server) at the same time. This is the main challenge: to make our system able to provide a fast and reliable response for these operations. In order to test the internal dashboard performance and to detect possible bottlenecks the following tests are proposed:
• Measuring the processing time for the component that reads the contents of PCAP files and exports them to the next pipeline step (PCAP to NetFlow converter). • Measuring the processing time for the component which processes the NetFlow
records and send them to the database queue.
To test the database insertion time we need to have a sizeable amount of data to insert. This data would allow us to appropriately configure the database. Our web server handles static documents with very high output rates. A high database query load, however, requires long periods of time. A good performance of database queries is therefore crucial for a good user experience.
Finally, rendering the main page and charts in the browser relies on the computational power of the end-user machine.
In the end, we have a pipeline and we need our tasks to complete in similar periods of time to avoid performance penalties. We have to work in near real time for a good user experience. The final requirements and the dimensioning of the architecture depend on the amount of traffic that we will be analyzed. A good starting point is the sizes of the ONTS files produced every day (see deliverable D2.5 [3]).
8.2.5 Open issues, deviations and future developments
A partial mock-up of the dashboard is already available. More work is still expected in order to integrate all measurement parameters and link them to the different modules it needs to be connected to.
Regarding the anomaly detection engine, once a validated version of the algorithm will be released by WP4 it will be integrated in the framework of UC #1, depicted in Figure 4. As mentioned in the previous section, its evaluation requires labeled datasets. For a thorough evaluation, we plan to develop a new synthetic dataset to avoid relying on a dataset as old as KDD’99.
The open lines identified to progress on the dashboard are:
• Completing the integration with the anomaly detection engine. This involves the display of detailed information about detections and traffic details in the same time interval in which anomalies occur.
• Improving the data input throughput and increasing the database insertion throughput with a good time response (system scalability).