Building a Wireless Mesh Networked Real-Time Electricity Metering System in an
MIT Dormitory
by
Austin L. Oehlerking
Submitted to the Department of Mechanical Engineering in partial Fulfillment of the Requirements for the Degree of
Bachelor of Science in Engineering as Recommended by the Department of Mechanical Engineering
at
the
Massachusetts Institute of Technology
February 2009
@Austin
L. Oehlerking
All rights reserved
MASSACL , U
SEP 16
2009
LIBRARIES
ARCHIVES
The author hereby grants to MIT permission to reproduce and to distribute publicly paper and electronic copies of this thesis document in whole or in part in any medium now known or hereafter created.
Signature of Author ... ... ... -- 1...
Department of Mechdical Engineering February 6, 2009
Certified by. ... ...
Sanjay E. Sarma Associate Professor of Mechanical Engineering Thesis Advisor
Accepted by ... ---. ---.. ... . .. ...
John H. Lienhard Professor of Mechanical Engineering Chairman, Undergraduate Thesis Committee
9 3
AIH4O~JV
Oehlerking -
2-Building a Wireless Mesh Networked Real-Time Electricity Metering System in an
MIT Dormitory
by
Austin L. Oehlerking
Submitted to the Department of Mechanical Engineering on February 6, 2009 in Partial Fulfillment of the Requirements for the Degree of Bachelor of Science in Engineering as Recommended by the Department
of Mechanical Engineering
ABSTRACT
A competitive, closed-loop information feedback system of wireless electricity meters was designed, tested, and implemented in seven MIT dormitory rooms. The meters utilized Allegro Hall
Effect current sensors as well as ZigBee based mesh networking transceivers. A remote database stored energy use data for the community and implemented data and graph caching for an online web
interface made available to the system users. The website displayed detailed statistics on energy consumption within the dormitory, rankings of the community members, and individualized pages with positive or negative normative feedback messages based upon a user's consumption level. Over the course of a three week test period, the average demand level of the seven rooms was 56.53 watts, which is equivalent to an annualized cost of $84.18 and emissions of 480 pounds of CO2. The largest
consumer used 28% of the total energy, while the bottom three consumers combined used only 26% of the overall energy. The seven rooms together demanded between 300-490 watts 95% of the time.
Thesis Supervisor: Sanjay Sarma
Oehlerking
-3-Table of Contents
1. Introduction...
4
2. Literature Review ... ...
... 4
3. System Overview ...
6
4. Hardw are: M eter Design and Production ...
... 7
5. Data M anagem ent ... 14
6. W eb Interface ... 16
7. Sam ple Data ... 20
8. Conclusion ...
23
9. References ...
25
Oehlerking
-4-1. Introduction
Despite the pervasive interest in energy conservation that has recently come about in the United States, many individuals are still left with little idea of how much energy they are consuming or how their energy usage compares to their neighbors. Using a student living community at MIT named German Haus as an experimental study group, a wireless mesh network of electricity meters was developed and installed in eight dormitory rooms. The real time data was fed to a web interface that presented detailed statistics on personal energy consumption as well as rankings among the neighbors.
The project consisted of three primary phases. First, the hardware was designed, assembled, tested, and installed. The meters used Hall Effect current sensors to determine the power usage of
device loads in the rooms as well as a ZigBee based wireless mesh network to communicate the data to a receiver unit. Second, the raw data was processed and organized into a database on a remote server. Data caching and graph caching enabled quick access to large amounts of data by system users. Lastly, an interface was developed that presented socially normative data as well as injunctive emotional messages that in combination offered a high chance of reducing community energy consumption.
2. Literature Review
Metering technologies are as old as the earliest electronic devices, although modern day meters are far more accurate. For industrial applications, expensive, high-tech metering solutions are used to minimize costs and to monitor for errors. Most households, however, still use analog electricity meters attached to the outside of their homes. These setups provide almost no opportunity for user feedback, except through monthly billing statements that usually provide little useful data.
Better user feedback has been shown to reduce energy consumption by a significant amount in many cases. Susan Darby, a researcher at Oxford's Environmental Change Institute, has extensively studied energy feedback systems, and she divides them into five main categories: direct feedback, indirect feedback, inadvertent feedback, utility controlled feedback, and energy audits. Interactive feedback through a PC, which is what we have achieved with this project, can be further classified as a
direct feedback tool. In a survey of over 38 feedback studies over 25 years, direct feedback averaged an energy use savings of 10% and faired the best among all feedback categories (Darby 2001).
A study by Ontario Hydro tested direct feedback systems that consisted of computer monitors with simple data interfaces. The experiment lasted for a 60-day period with sample and control groups
Oehlerking -5
-totaling 100 households. The homes with the feedback installed saved an average of 12.9% over the
control groups (Dobson 1992). Since our system also uses computer monitors to display feedback data,
we could potentially expect similar results.
Several principles must come into consideration when developing a useful energy feedback
system. One study of eighty residential electricity consumers found that those asked to achieve a
difficult goal of 20% energy use reduction saved significantly more than those asked to achieve an easy
goal of 2% energy use reduction (Becker 1978). So, a feedback system should integrate an element of
challenge for the users to maintain interest levels and to achieve the best possible performance. The
designers of the system should be careful, however, not to assign impossible tasks to consumers that
would merely lead to those users ignoring the system.
Another strategy that can be quite effective is using competition among a set of peers. A basis
for this strategy is found in the theory of social norms, which capitalize on the tendency of human
beings to move towards behavior they perceive as normal. In a 2007 study, two types of normative
feedback were used among 290 residences. After a baseline period, the first half received handwritten
feedback indicating how much energy had been consumed above or below the neighborhood average
during a billing period. This feedback resulted in a predictable boomerang effect in which behavior
change largely depended on whether or not users were already consuming above or below the average
(the smaller consumers actually ended up using more energy). For the second half of users, a smiling or
frowning face was also hand-drawn on the note according to whether consumption was below or above
average, respectively. This injunctive message of positive or negative emotion effectively eliminated the
boomerang effect, causing the lower consumers to continue saving energy as before (Schultz et al 2007).
Integrating the lessons of previous user feedback studies into our electricity metering system is
essential, as the primary objective of the system is to maximize the positive behavior change of our
users. Additionally, our current and future versions of the wireless metering system should draw on the
lessons learned from the commercial metering industry over the past century.
Although electricity meters have historically been analog, converting the incoming data to a
digital signal can greatly enhance the accuracy and flexibility of the measurement. Accurate analog
metering is further made difficult by multiplier drift and variation over long periods of time (Johnston et
al. 1978). Furthermore, electronic electricity meters that utilize analog-to-digital converters as well as
voltage and current sensors can achieve a high measure of accuracy. Microcontrollers on board the
Oehlerking
-6-circuit can control and standardize the output so that very little in terms of scaling and calibration is
necessitated after production (Edge et al. 1998).
The wireless mesh networking could be handled by a range of various platforms, but the ZigBee
(802.15.4) protocol is the most convenient for quick and efficient production. The protocol is used by
many manufacturers to design mesh network transceivers, and it is being used more and more often
within the world of sensor technologies (Hill et al. 2004).
Although combining all of the desired technical features into the first iteration of the meter
design may not be practical, we can identify a clear path towards our goal of obtaining an effective,
low-cost, and reliable wireless electricity metering system. By integrating friendly neighborhood competition
and injunctive user feedback into the system, we hope to foster a sense of action and excitement among
our entire user base.
3. System Overview
The system was designed for closed loop interactive feedback through communication between
a wireless mesh network of electricity meters and a real time data interface on the web. The success of
the system is determined by the functionality of four elements working together: the hardware
infrastructure, the data management process, the web interface, and the user community.
The project's main objectives throughout the design, development, and implementation stages
were to:
1) Maximize the range of the wireless network so that a broad distribution of meters could
operate with minimal infrastructure.
2) Minimize the power consumption of the sensor network and data management system.
3) Achieve a data update cycle time of under fifteen minutes from usage to display.
4) Present the data to users in such a way that maximizes the chances of positive behavior
change.
5) Identify all major challenges and errors of the metering system for use in the next design
iteration.
The completed system has mostly achieved the first four objectives, and this report contains
data that will help to fulfill the fifth objective. In future systems, the basic information loop will remain
Oehlerking
-7-the same, as is illustrated in Figure 1. A range of improvements can be made, however, to the meters themselves as well as to the data management process to improve the cycle time. Additionally, there is currently a high degree of research interest in the field of behavior change and energy conservation. This version of the metering system does utilize the latest principles of establishing social norms in energy consumption patterns, but future iterations of the system will need to incorporate concepts from the continuously growing body of psychological knowledge in conservation.
Meter 3
'
*
i
I~~rI Metern
I I
I ZlgBee wireless Mesh Network I
Figure 1: Diagram of Overall System Functionality
4. Hardware: Meter Design and Production
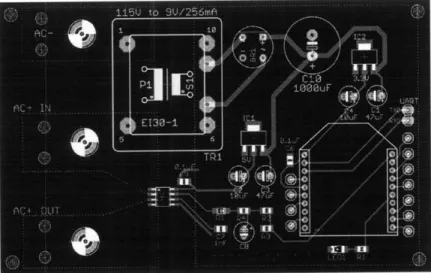
The meters contain five primary components: a custom designed PCB ( Figure 2), a
transformer, an Allegro Hall Effect current sensor, a ZigBee wireless transceiver, and GladWare casing. The PCB was designed by Ivan Sergeev '12, and it uses the transformer and a rectifier to provide power
Oehlerking -
8-to the ZigBee module. The meter is designed as a pass through circuit for AC power, so it is installed in series between a wall outlet and the user's device or power strip.
In order to maximize the range of the wireless meters, we decided to use a ZigBee-based mesh network solution. ZigBee is notable for its low power consumption in wireless networks - it has the capability of transmitting data as often as desired while consuming very little to no power during down time. Within the network, one ZigBee module is designated the coordinator while the others can be
designated as routers or end devices. Routers have the capability to pass information along from other nodes that may be out range from the coordinator. Our network consisted of one ZigBee coordinator and seventeen ZigBee routers. We could have saved some power by designating one ZigBee router per room and any extra meters in that room as ZigBee end devices, but for the first iteration we decided to allow the system to operate as a full mesh network.
Figure 2: Meter Circuit Schematic Designer: Ivan Sergeev
The Allegro Hall Effect current sensor is capable of handling currents up to 20 amps. Its output is in millivolts with an approximate zero point of 500 mV and an output scale of 10 amps/volt. The output from the Allegro that reaches the ZigBee component must also be scaled to reflect the presence of
additional voltage dividers, capacitors, and diodes within the circuit.
Each meter was assembled and calibrated by hand. For the eight rooms that were monitored, seventeen meters were installed in addition to one receiver. During the installation of each meter, the
Oehlerking
-9-types of devices connected in series with that meter were recorded, and all devices
within the
monitored rooms were covered by exactly one meter. Power strips were used for rooms in which
several devices were connected to one outlet.
German Haus, a dormitory on the west side of the MIT campus, was chosen as a test location
for
the experiment. German Haus is located within the larger New House dormitory, occupying
the
2nd-4th
floors of the
6thwing of
the building. Twenty-four student residents live within German Haus in addition
to one graduate resident tutor. Since the primary objective of the project was to install a working
version of the feedback system, students were chosen to participate on a voluntary basis. However, the
eight students who did participate ended up representing a diverse cross section of the MIT community.
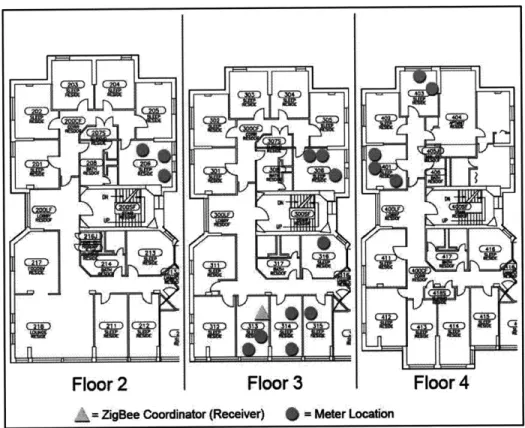
The metered rooms were dispersed throughout the three floors of German Haus at various
distances from the receiver (Figure 3), with the closest meter being only a few feet from the receiver
and the furthest meter being about 95 feet away.
Figure 3: Location of Meters and ZigBee Coordinator in German Haus (Floors 2, 3, 4)
Floor
2
Floor 3
I
Oehlerking
-10-The Allegro current sensor operates linearly, but the output delivered to the network has to be
adjusted by a scaling factor specific to our circuit design as well as by the power factor of the devices
connected to the meter. The current sensor outputs a voltage proportional to the root-mean-square
(rms) current of the AC circuit. Using a constant voltage of 120 volts, apparent power can be calculated
using the rms current. Unfortunately, this value will only be accurate for purely resistive loads. Reactive
loads which contain capacitors or inductors will induce a phase lag between the voltage and current
waveforms. The apparent power, which is what we are measuring with the current sensor, is actually
greater than the real power that is being used by the circuit. The apparent power (S) being used by a
circuit is the square root of the sum of the real power (P) squared and the reactive power (Q) squared.
So, in order to calculate the real power quickly, we can determine the power factor (pf) of a particular
circuit and simply multiply the apparent power by this value
(
Equation
1).
(P) Real Power
- Phase Angle
(S) Apparent Power
(Q) Reactive Power
S
2= P2 +Q
2P= Scos(
P
-
Power Factor
=
cosl
(
Equation 1)
S
Initial calibration of the meters was carried out on a group of purely resistive loads (pf=l) of
varying magnitudes as well as a series of highly reactive loads with a constant power factor. The resistive
loads were obtained using a combination of lamps, and the reactive loads were obtained using a
television in the lounge of German Haus in combination with several purely resistive loads. The base
voltage of the calibration meter was obtained by plugging the meter into a wall outlet with no load
attached. All further meter outputs subtracted this base voltage before applying any scaling factors.
In
order to obtain the real power of the circuits being measured, a Watt's Up Pro meter was used in series
with the load to test each combination of devices.
Oehlerking -
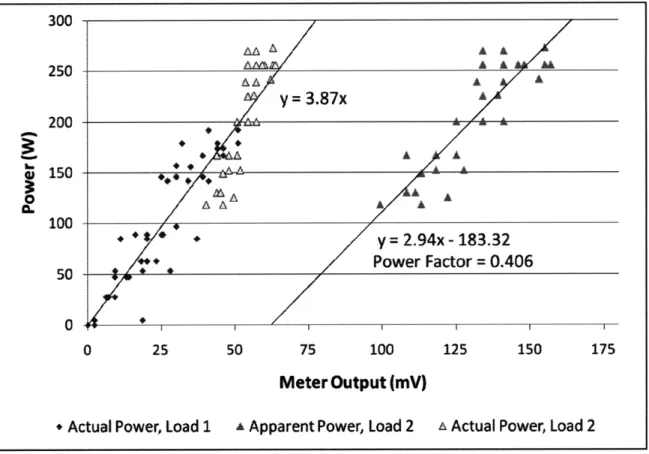
11-A line of best fit was applied to the pf=1 data to determine a scaling factor that could be used to
convert the linear current sensor output to power consumption. The slope of the best fit line was found
to be 3.57 W/mV (Figure 4). A line of best fit was also applied to the data points of the second load. The
uncalibrated data points of the reactive load appeared to follow a linear trend that was shifted to the
right from the data points of the resistive load. By applying a power factor of 0.406 to the data according
to Equation
1,
the measurements were shifted into approximately the same range as those of the
resistive load (Figure 4).
300
250
Figure 4: Meter Output vs. Power for (1) resistive loads of pf=1 (2) uncalibrated reactive loads
of pf = 0.406 and (3) calibrated reactive loads of pf = 0.406 (pf = power factor)
During the installation of the sixteen meters in the seven rooms, the base voltages of each of the meters was measured as well as the power factors of the various loads that could occur for each meter. In order to measure the power factors of each potential load, a Kill-A-Watt meter was used in series with the AC wall socket and the load. Unfortunately, depending upon which mix of devices comprised a particular load, the power factor could vary significantly over time. For instance, a laptop may show a different power factor if it is turned off and charging vs. turned on and at full charge. Also, if a power strip is connected to a lamp and a refrigerator, the power factor will change based upon which
200
150
100
0 25 50 75 100 125 150 175
Meter Output (mV)
A
Apparent Power, Load 2
aActual Power,
Load
2
*
Actual Power,
Load 1
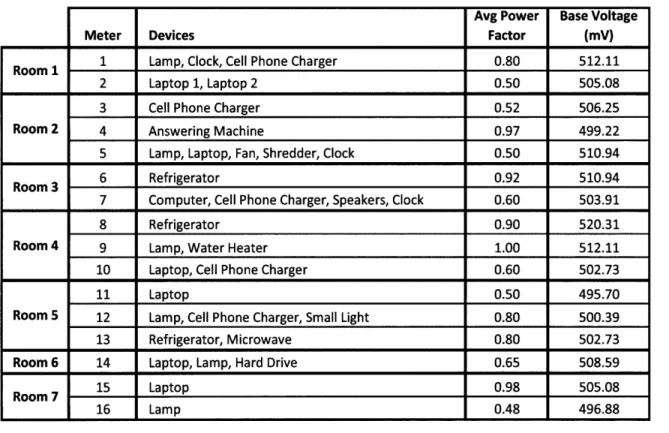
Oehlerking - 12-device is active. Since our meters are not capable of dynamically measuring a changing power factor, we used an average of the power factors that were obtained by subjecting each meter to all potential load conditions. These average power factors as well as the base voltages were then stored in the database to be applied during the data and graph caching phase of the data cycle. A complete list of the devices, average power factors, and base voltages of the sixteen meters is presented in Table 1.
Meter Devices
Avg Power Base Voltage
Room 1 1 Lamp, Clock, Cell Phone Charger 0.80 512.11
2 Laptop 1, Laptop 2 0.50 505.08
3 Cell Phone Charger 0.52 506.25
Room 2 4 Answering Machine 0.97 499.22
5 Lamp, Laptop, Fan, Shredder, Clock 0.50 510.94
Room 3 6 Refrigerator 0.92 510.94
7 Computer, Cell Phone Charger, Speakers, Clock 0.60 503.91
8 Refrigerator 0.90 520.31
Room 4 9 Lamp, Water Heater 1.00 512.11
10 Laptop, Cell Phone Charger 0.60 502.73
11 Laptop 0.50 495.70
Room 5 12 Lamp, Cell Phone Charger, Small Light 0.80 500.39
13 Refrigerator, Microwave 0.80 502.73
Room 6 14 Laptop, Lamp, Hard Drive 0.65 508.59
Room 7 15 Laptop 0.98 505.08
16 Lamp 0.48 496.88
Table 1: Meter Device Attachments, Average Power Factors, and Base Voltages
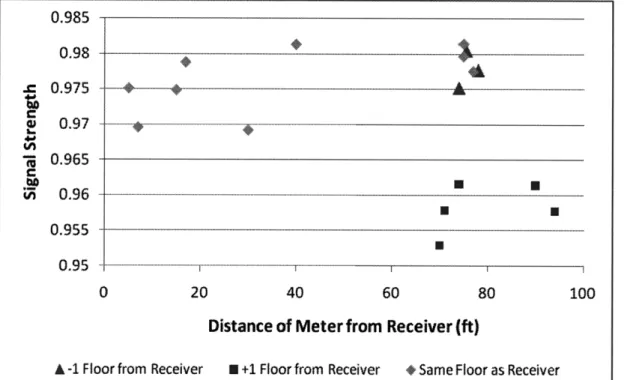
Although the ZigBee routers were programmed to transmit the output of the Allegro current sensor once every fifteen seconds, sometimes the data points were not received for one reason or another. If the mesh network was operating correctly, distance from the receiver should not have affected reception quality significantly unless a whole block of meters was cut off from the other meters
by some barrier or empty span. Figure 5 compares the distance of the meters from the receiver unit to
reception quality, which is defined as the percentage of transmissions that successfully arrive at the receiver. The data is split up further into three categories, one for each floor of German Haus. Meters located on the same floor as the receiver clearly suffer no loss of quality with an increase in distance from the receiver. Likewise, meters located one floor below the receiver also exhibit a signal quality
above 97%. The only signal degradation occurs for the six meters located one floor above the receiver,
Avg Power
Factor
Base Voltage
Oehlerking - 13
-which all have signal strengths between 95%-96.5%. This signal quality is still relatively high, but the 2%
decrease may be the result of these meters' distance from the receiver in combination with not being
vertically aligned with any other room containing meters.
0.985 0.98
--
.- .-- .--... " 0.965 n 0.960.955
0.95
0 20 40 60 80 100Distance of Meter from Receiver (ft)
A -1 Floor
from Receiver
N
+1 Floor
from Receiver
*
Same Floor
as Receiver
Figure 5: Meter Distance and Floor Level vs. Signal Strength, where
Signal Strength
=
(received_data)/(received_data + dropped_data)
Several problems related to the accuracy of the meters ended up occurring during the course of
the experiment. Although the base voltage of each of the meters was carefully measured at the
beginning of the experiment, these values seemed to wander over the course of time in several
instances. In the most extreme cases, the base voltage increased by nearly 10 mV, which if left
uncorrected would have been displayed as a constant load of 37.5 watts when all devices were turned
off. The drift of the base voltages is difficult to diagnose, but it is probably due to instabilities within the
Hall Effect current sensor. Constantly recalibrating the meters once they are in production is unreliable
and labor intensive, so future versions of the meters will need to solve this issue.
Oehlerking -
14-As a means to increase the accuracy of the power factor, future versions of the meter should also contain a voltage sensor as well as a microcontroller that can dynamically measure the power factor. Certain elements on the board can also be eliminated or replaced so as to reduce cost, such as the bulky 115 V to 9 V transformer, which could potentially be replaced by a half wave rectifier and cut-off diodes (Jiang et al. 2008). Finally, since the point of the system is to reduce the overall power
consumption of the community, it does not make sense to run an entire laptop that is attached via USB to the receiver circuit. If the receiver unit is outfitted with built-in web server and the capability to communicate with an 802.11 network, the need for a laptop would be eliminated and the data could be sent directly to the remote server in real time.
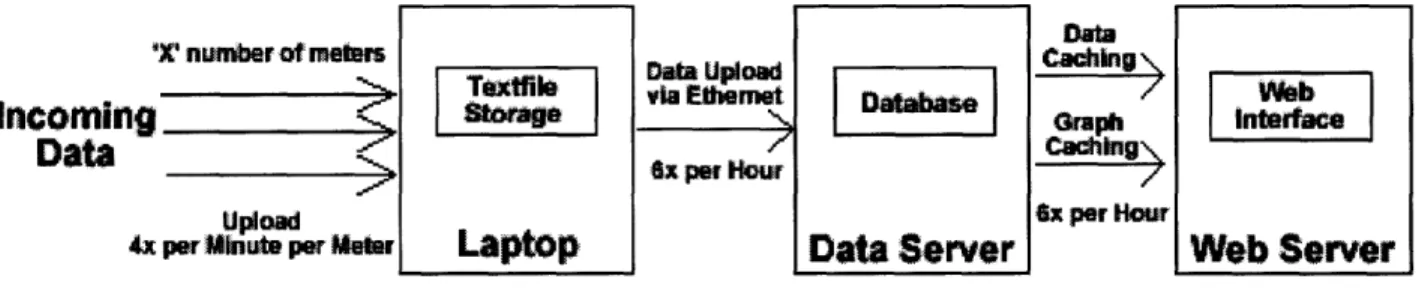
5. Data Management
The data management cycle of the system is illustrated in Figure 6. Backup copies of the data are stored in several locations in case of accidental deletion or a database error. Each meter is
programmed to transmit the instantaneous output of the Allegro current sensor once every 15 seconds. Data is stored in 10 minute blocks in text files on the receiver laptop. Processing and caching the data takes another five minutes, leading to an average time-to-display of 10 minutes with a worst case scenario of 15 minutes.
Data
4
X' numer ot reIrs ITi nwnei oData Uplod
c
alainC i
1
Ttfile via Eemw Daagb e bIncoming
>pF
x perx pego
Uplad x per Haour
Sper
Minute per MeterLaptop
Data
Server
Web Server
Figure 6: Complete Data Flow Diagram
When an incoming signal transmits a datapoint to the receiver, a script records the current timestamp of the laptop, the sixteen digit id code of the ZigBee unit from the communicating meter, and the output of the Allegro current sensor in millivolts. Another script uploads the text files to the remote server every ten minutes.
Oehlerking -15
-A PhP script on the server processes the incoming text files into the database. Occasionally, a meter fails to transmit data during a given 15 second interval. The database tracks how many data points are dropped over time so that signal strength can be computed. Blank values in the database are filled in with linear interpolation between the gaps, which allows graphs to align accurately and to appear smooth on the web interface. For calculation purposes, the interpolated data can be
automatically excluded from the overall dataset if desired. The database structure is presented in Table 2.
Database: german_haus
Table Name Fields
powerdata time, id, power
idtable device_num, unique_id, room, devices, base_voltage, power_factor
roomtable room_num, meter_nums, first, last, year, sex dropped_values date, unique_id, num_dropped, num_read
Table 2: Tables and fields for german_haus database
Another script produces data and graph caches each time the database is updated. The caches are produced for 3-hour, 24-hour, and one week increments backwards from the current time. For a single meter, one week of data spans over 40,000 database entries, so caching the data and graphs greatly reduces the loading time of the web interface.
Additionally, each data entry must be adjusted by the appropriate scaling and power factor, as it is stored in the database as the pure output from the Allegro current sensor. The data could be
translated into actual power values before entry into the database, but this would allow less overall flexibility if adjustments were required to the scaling or power factors of the meters.
The data processing and storage system does have some potential for improvement. Although updates each fifteen minutes are relatively quick compared to the timescales that customers usually receive feedback on (monthly billing statements), we observed that users strongly prefer near instantaneous feedback so that they can see the results of their actions on the web interface quickly.
Oehlerking
-
16-The process could be made nearly instantaneous by using a push system for the data transfer, transmitting the data as it comes and also recording it in a text file as a backup copy. Each incoming
piece of data to the server would be appended into a text file that is processed every second by the server. Upon processing, a copy of the text file would be made, the body of the old text file would be cleared for incoming data points, and the copy would be processed into the database. Gaps in the data
could be found by comparing the timestamps of incoming data with the previous datapoint from the same meter and making sure that the two are within a range of approximately 15 seconds of each other.
Scaling the system could also be made much more efficient. As an example, the powerdata table of the database for 17 meters over three weeks is about 95 megabytes in size. For a much larger system over a long period of time, the size of the database would balloon quickly. Currently, one timestamp is stored per meter per time slot, meaning that the same timestamp is repeated 17 times in the database. With some creative programming, the memory footprint of the timestamps in the database could be greatly reduced. Additionally, it became apparent during the course of the project that recording data once every fifteen seconds was becoming a bit excessive. Although shorter timescales do help to capture short term demand fluctuations, a script could be written that would condense incoming data into an average value for a 5 minute time period. The day and week graphs on the web interface would
not lose any resolution with this data reduction. The data reduction could occur 3-5 hours after the original data is processed into the database so that short term graphs would still retain a high level of
detail.
6. Web Interface
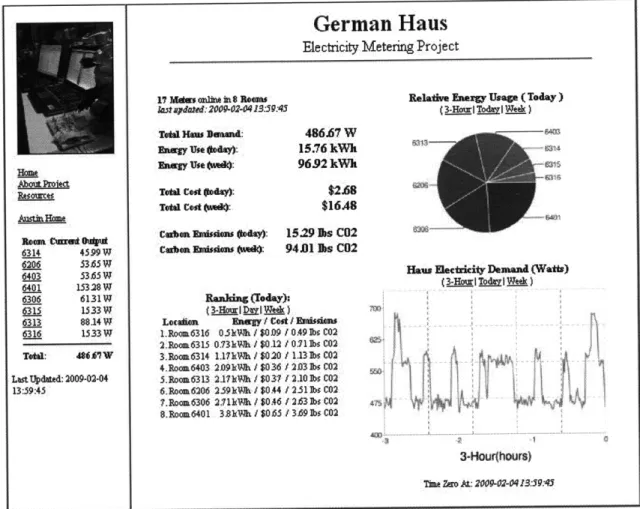
The website was designed to provide users with the maximum amount of useful information, and also to foster a sense of competition among the community members. A main homepage presents the data for the community (Figure 7). Values for the overall energy consumption, cost of electricity, and carbon emissions of the community are displayed. Additionally, a ranked list of rooms based on energy use is viewable for the previous three hours, day, or week. A pie chart and line graph are also viewable on each of these three timescales.
Oehlerking
Abu t oie Arm H= uiw 6314 4599 Wl 6206 5365 W 6403 5365W 6401 15328W 6306 6131W 6315 1533 W 6313 8814 W 6316 1533W Total: 486 '7W Last Udted: 2009-02-04 13:59:45German Haus
Electricity Metering Project 17 Mor online in8 Reams
II ardated: 200-02-04.13:59:45
Total HaWs enm t: 486.67 W
Ehy Use (eday): 15.76 kWh
Neuy Use o*: 9692 kWh
Totl Costod : $2.68
ToW CEst OWm*: $16A8
C a aisns 0d"a): 15.29 lbs C02
Cua an nmisis (u : 94.01 ls C02
Rankiag (oday):
Locaiam Engy / Cost / Emidnon
1.Ro 6316 0.l Wh/ $09 / 0.491bs C02 2.Room6315 03kWh 1$0.12 / 0311bs C02 3.Room6314 1.17kTWh / $020 I 1.13 bs C02 4.Roao6403 2N9kWh / $036 203 1bs C02 5.Roac6313 2.17tlWh $037 I 2.10lbs C02 6.Rocn6206 259kWh f $0.44 / 251lbs C02 7.Roa6306 2.71Wh / $0.46 1 263lbs C02 8. Rom 6401 3BlWh I $065 / 369 s C02
Relative Energy Usage (Today)
(~Ii~IA)
Haut Electicity Deanand (Wativ) (3o1 d odl Week)
ij
;I~*~
i
3-Hour(hours)
The Zero At: 2009-02-041359:45
Figure 7: Main Page of Data Interface
The cost of electricity is assumed to be $0.17 per kWh, which is typical of New England. Carbon emissions are a bit trickier, and they must take into account the unique energy supply of MIT. The co-generation plant, located on campus, provides about 2/3 of MIT's power. The plant produces electricity, steam, and chilled water. Overall carbon emissions for the co-generation plant are simple to calculate, but attributing those emissions to each of the three plant outputs is difficult. We have assumed that the electricity produced by the co-generation facility is responsible for about 0.8 lbs CO2 / kWhe. The
average emissions value for NSTAR electricity in New England, which supplies the other 1/3 of MIT's power, is 1.3 lbs CO2 / kWhe. The estimated carbon emissions of electricity in an MIT dormitory are calculated in ( Equation 2 ).
17-Oehlerking -
18-lbs
CO
2lbs
CO,
lbs
CO(
Emmissions= 1/3*(1.3
)+2/3*(0.8
=
0.97
2( Equation 2 )
kWhe kWhe kWh,
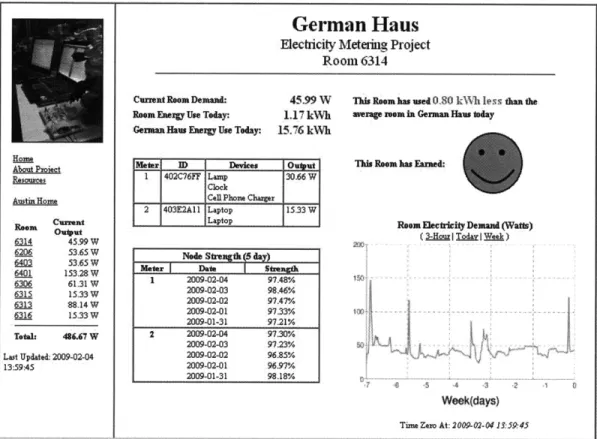
Users can also navigate to room pages that display graphs and statistics about the meters in
their individual rooms. The latest available demand and energy use of the room is displayed, as well as a
list of each of the meters in the room and the devices attached to those meters. The node strength of each meter over the previous five days is displayed so that any major problems with one of the meters can be quickly identified. A line chart displays the recent energy demand of the room for the previous three hours, day, or week. Finally, if the user is has consumed a below-average amount of energy in the previous day, a smiley face is displayed and the user is notified of how much energy they have saved compared to their peers (Figure 8). Conversely, if the user is consuming more than the community average, a frowning face is displayed and a message tells the user how much energy above the average is being used (Figure 9).
The current system allows for any visitor to the website to view detailed statistics about any metered room. Although the website does not divulge the identities of any of the users, there are privacy concerns with such a setup. The first question is whether or not users should be allowed to see the consumption of other users, or if they should only be allowed to see the overall average of the
community compared to their own use. In a commercial setting, privacy considerations would probably dictate that detailed statics for each residence remain confidential to that household.
The second question is whether or not the outside world should be able to see the details of a community's energy consumption. On one hand, the system is attempting to influence the behavior of the community members only, so it would seem to make sense to remove access from all outside viewers. However, outside communities could potentially learn from seeing feedback systems such as this one installed and available online. More open access could lead to this framework being replicated to larger competitions between whole communities.
The web interface could be vastly improved with a user login system, which would protect personal privacy while allowing somewhat open access to the rest of the world. Users would have the only access to their individual pages, but the community homepage would be available for anyone to
Oehlerking - 19-Home Abtot Proict Austin Hoe Room Cu nt 6314 45.99 W 6206 53.65W 6403 53.65W 6401 153.28 W 6306 61.31 W 6315 15.33W 6313 88.14 W 6316 15.33 W Total: 48.647 W Last Updated: 2009-02-04 13:59:45
German Haus
Electricity Metering ProjectRoom 6314
Current Room Demand: Room Energy Use Today: German Hats Energy Use Today:
45.99 W 1.17 kWh 15.76 kWh Meter ID Dke O t 1 402C76FF Lamp 30.66 W Clock
Cell Phone Charger
2 403E2AI1 Laptop 15.33 W
Laptop
Node Strngth day)
Meter Data Stren
1 2009-02-04 97.48% 2009-02-03 98.46% 2009-0202 97.47% 2009-02-01 97.33% 2009-01-31 97.21% 2 2009-02-04 97.30% 2009-02-03 97.23% 2009-02-02 96.85% 2009-02-01 96.97% 2009-01-31 98.18%
This Room has used 0.80 kWh less than the avenge room in German Haws today
This Room has Earned:
Room Electricity Demand (Watts)
(3-Hor Todavr Week )
Week(days)
Time Zero At: 2009-02-04 13: 59 45
Figure 8: Data Page for a Below Average Consumption Room
About Proect Austin Home CRrent Room u 6314 45.99 W 6206 53.65 W 6403 53.65W 6401 15328 W 6306 61.31W 65 15.33 W 6313 88.14 W 6316 15.33W Total 46.67 W Last Updated: 2009-02-04 13:59:45
German Haus
Electricity Metering ProjectRoom 6403
Curent Room Demand: Room Energy Use Today:
German Hau Energy Use Today:
53.65 W 209 kwh 15.76 kwh
leter ID Devices Owuat
24 404856E0 Refrigerator 22.99W
52 40485736 Desktop Computer 30.66 W CellPhone Charger Speakers
IClock
Node Strength 5 day)
Meter Date Sireng
24 2009-02-04 96.10% 2009-02-03 95.73% 2009-02-02 93.79% 2009-02-01 94.79% 2009-01-31 93.59% 52 2009-02-04 95.86% 2009-02-03 94.62%, 2009-02-02 93.54% 2009-02-01 96.39% 2009-01-31 96.353%
This Room has wed 0 12 kh more than the average room in German Haws today
This Room has Earmed:
Room Electricity Demand (Watts)
w
- InTodari We e)
S.uY...
OL(...11.
3-Hour(hours)
Time Zero At: 2009-02-04 135945
Oehlerking
-20-see. With this setup, users would also be able to update the status of their meters by adding
or subtracting devices from specific meters. They could also have an option to flag output
that seems obviously inaccurate so that problems could be fixed more quickly.
7. Sample Data
Data was taken for seven rooms and sixteen meters over a three week time period.
Although an eighth room was also included in the study, it was discovered at the end of the
experiment that the user had unplugged all devices from the meter at the beginning of the
testing period after being confused about how the meters operated.
The base voltages of each meter were measured two weeks before the start of this
experiment, after which time they were immediately installed in the rooms. During the
following five week time period, some of the base voltages changed, which resulted in
graphs and rankings being displayed on the website that were not entirely accurate. As
some of these problems were discovered, the base voltages were measured again and the
database information was reset.
Onn --o C 400 E 300 a 00 0 7 14 21 * Room4 E Room5 Time (Day)
M Room3 M Room 7 Room2 E Room 1 Room6
Figure 10: Demand over time for community, individual room demands stacked
Oehlerking -
21-A graph of demand over time for the entire community is presented in Figure 10, with individual room demands over time stacked by rank. It is apparent that room 4 consumed by far the most amount of power over the three week time period, with a demand that was consistently higher than that of the other rooms.
Frequency demand curves are used by utility companies to plan for the likelihood of particular demand levels on the grid. The German Haus electricity demand can also be represented with a
frequency chart (Figure 11). The distribution appears roughly similar to a normal curve with a tail to the right for demand spikes. The demand of the eight rooms is most likely to fall somewhere between 370-410 watts, and there is a 95% chance that the total demand will fall between 300-490 watts at any given time.
Total
Haus Demand
Curve
0.1 021 0.08 0.06 0.04 0.02 0 550 600 650 400 450 500
Electricity Demand (WI
Figure 11: Frequency Demand Curve of 7 Sample Rooms, 3 Weeks
Demand varied greatly between the seven rooms, with the worst room averaging 112.64 watts and the best room averaging 24.18 watts (Table 3). The total annualized cost of electricity for the seven rooms was $589.25 with associated carbon emissions of 3,362.17 pounds (1.68 tons). The total energy consumption over the three week period is further depicted in Figure 12, where it appears to maintain a fairly constant rate of increase when all rooms are combined. Figure 13 illustrates the disparity in energy
... i I...
Oehlerking -22
-use between the rooms, with Room 4 consuming 28% of the total for all seven of the rooms. The bottom three consumers (Rooms 1, 2, and 6) consumed only 26% of the overall energy.
Average Demand (W) p U Annualized Energy Use (kWh) Annualized Cost Annualized CO2 Emissions (Ibs) Room 1 34.44 301.69 $51.29 292.64 Room 2 42.13 369.26 $62.77 358.18 Room 3 61.87 541.89 $92.12 525.64 Room 4 112.64 986.88 $167.77 957.27 Room 5 70.15 614.44 $104.45 596.00 Room 6 24.18 211.54 $35.96 205.20 Room 7 50.28 440.45 $74.88 427.23 Total 395.69 3,466.15 $589.25 3,362.17 Average Room 56.53 495.16 $84.18 480.31
Table 3: Average Demand, Energy Use, Cost, and C02 Emissions (annualized) over three week period for study rooms and overall community
Total Energy Consumption
(3
Week)
180 140 120 100 80 E 60 2U 0 0 7 14 21 Time (Day)
Oehlerking -23
-Figure 13: Relative Energy Usage of 7 Sample Rooms, 3 Weeks
8. Conclusion
The construction of a wireless real-time electricity metering system with user feedback is one step in the larger process of reducing household energy consumption. All of the elements of the feedback system must work together towards one common goal: informing users of their energy consumption patterns such that they are continuously motivated to adjust their behavior in sustainable ways. This knowledge will allow users to identify trouble areas in their personal consumption profiles, which in turn may lead to them removing inefficient devices, upgrading the space around them with
sustainable technologies, and becoming more aware of conservation techniques.
Our electricity metering system can be greatly improved with the knowledge obtained during the course of this project. The meters should be redesigned to integrate a microcontroller that will track the power factor of the circuit as it changes dynamically as well as the base voltage of the current sensor output. The cost of the meters can also be reduced by making changes like eliminating the transformer. The data management system can be upgraded to reduced that data cycle time from an average of ten minutes to an average of under 30 seconds, and the data itself can be reduced in size to allow for easier
Room 6 Room 1 6% 9% Room 4 28% Ii Room 4 Room 2 U Room 5 11% m Room 7 n Room 2 * Room 1 Room 7 Room 6 13% Room 3 15%
Oehlerking -
24-scaling of the system. The web interface must be changed to account for privacy considerations and to reflect the latest research knowledge of behavior change techniques and energy conservation.
After the necessary updates to the metering system are made, the data will be reliable enough to test in an actual commercial setting. The experiment would be optimal with users that pay for their own electricity directly and live in a small community in which competition may be enthusiastically embraced. In dormitory settings, students do not usually pay for electricity directly. Instead, they pay a yearly housing fee in most instances. So, for an experiment that attempts to determine the potential savings from a metering system such as ours, a small apartment building or cluster of homes in a
Oehlerking -25
-9. References
Becker, L.J. "Joint effect of feedback and goal setting on performance: a field study of residential energy conservation." Journal of Applied Psychology. Vol 63 Issue 4. 1 Jan 1978. Pages 428-433.
Brandon, Gwendolyn and Lewis, Alan. "Reducing Household Energy Consumption: A Qualitative and Quantitative Field Study." Journal of Envrionmental Psychology. Vol 19 No 1. March 1999.
Pages 75-85.
Darby, Sarah. "Making it obvious: designing feedback into energy consumption." (2001).
Dobson, John and Griffin, Anthony. "Conservation Effect of Immediate Electricity Cost Feedback on Residential Consumption Behaviour." Proceedings of the 7th ACEEE Summer Study on Energy
Efficiency in Buildings (1992).
Edge, Ellen et al. "Electronic Electricity Meters." U.S. Patent 5,742,512. 21 Apr. 1998.
Hill, Jason et al. "The Platforms Enabling Wireless Sensor Networks." Communications of the ACM. Vol 47 No 6. June 2004.
Jiang, Xiaofan et al. "Creating greener homes with IP-based wireless AC energy monitors." Conference On Embedded Networked Sensor Systems. Pages 355-356. Raleigh, NC, 2008.
http://portal.acm.org/citation.cfm?id=1460449.
Johnston, Paul and Szabo, Andras. "Digital Processing and Calculating AC Electric Energy Metering System." U.S. Patent 4,077,061. 28 February 1978.
Kill A Watt. P3 International I Innovative Electronic Solutions.
http://www.p3international.com/products/special/P4400/P4400-CE.html.
Schultz, P., Nolan, Jessica, Cialdini, Robert, et al. "The Constructive, Destructive, and Reconstructive Power of Social Norms." Psychological Science. Vol 18 Issue 5. Pages 429-434. 15 Jun 2007. Watts up? PRO. Electronic Educational Devices. http://www.wattsupmeters.com/secure/products.php.
Oehlerking - 26
-10. Acknowledgements
This project could not have been completed without the generous support of Professor Sanjay Sarma and the Lab for Manufacturing and Productivity (LMP) at MIT. Additionally, Ivan Sergeev, MIT
Class of 2012, took on the role of lead circuit designer for the electricity meters, resulting in an excellent first round of data that has led to a great number of insights. The students of German Haus must be thanked for their willingness and enthusiasm to participate in this experiment. Finally, the idea of this
project must be credited to countless conversations among the broader community of sustainability-focused student groups, faculty, and staff members at MIT over the past couple of years. Live metering of dormitories and investigation into behavior change techniques have often been suggested as
potential projects that could transform our campus into a "living laboratory" of energy research, and it has been extremely rewarding to contribute towards that reality.