Publisher’s version / Version de l'éditeur:
Materials Science and Engineering A, 370, 1-2, pp. 401-406, 2004-04-15
READ THESE TERMS AND CONDITIONS CAREFULLY BEFORE USING THIS WEBSITE. https://nrc-publications.canada.ca/eng/copyright
Vous avez des questions? Nous pouvons vous aider. Pour communiquer directement avec un auteur, consultez la première page de la revue dans laquelle son article a été publié afin de trouver ses coordonnées. Si vous n’arrivez pas à les repérer, communiquez avec nous à PublicationsArchive-ArchivesPublications@nrc-cnrc.gc.ca.
Questions? Contact the NRC Publications Archive team at
PublicationsArchive-ArchivesPublications@nrc-cnrc.gc.ca. If you wish to email the authors directly, please see the first page of the publication for their contact information.
NRC Publications Archive
Archives des publications du CNRC
This publication could be one of several versions: author’s original, accepted manuscript or the publisher’s version. / La version de cette publication peut être l’une des suivantes : la version prépublication de l’auteur, la version acceptée du manuscrit ou la version de l’éditeur.
For the publisher’s version, please access the DOI link below./ Pour consulter la version de l’éditeur, utilisez le lien DOI ci-dessous.
https://doi.org/10.1016/j.msea.2003.07.019
Access and use of this website and the material on it are subject to the Terms and Conditions set forth at
Influence of steel heat treatment on ultrasonic absorption measured by
laser ultrasonics
Lamouche, Guy; Bolognini, Stéphane; Kruger, Silvio E.
https://publications-cnrc.canada.ca/fra/droits
L’accès à ce site Web et l’utilisation de son contenu sont assujettis aux conditions présentées dans le site LISEZ CES CONDITIONS ATTENTIVEMENT AVANT D’UTILISER CE SITE WEB.
NRC Publications Record / Notice d'Archives des publications de CNRC:
https://nrc-publications.canada.ca/eng/view/object/?id=9d4d3d7b-74f3-4ed1-ae05-9f7257150418 https://publications-cnrc.canada.ca/fra/voir/objet/?id=9d4d3d7b-74f3-4ed1-ae05-9f7257150418Influence of steel heat treatment on ultrasonic absorption
measured by laser ultrasonics
Guy Lamouche
∗, Stéphane Bolognini, Silvio E. Kruger
IMI-National Research Council of Canada, 75 de Mortagne Blvd., Boucherville, Que., Canada J4B 6Y4Received 12 July 2002; received in revised form 24 January 2003
Abstract
Laser ultrasonics is combined with the reverberation technique to measure ultrasound absorption during thermal cycles applied to medium-carbon steel samples. During heating to the austenitic phase, a small Snoek peak is observed around 360◦C at 10 MHz along with
a signature of the ferromagnetic to paramagnetic transition near 768◦C. Upon cooling, the behavior of the internal friction is much different
from that of heating: reduced high-temperature absorption, delayed phase transition, smaller magnetoelastic contribution and stronger Snoek peak are observed. The austenitizing temperature is found to have primary importance on the internal friction behavior during cooling. These measurements show that ultrasound absorption measurements using laser ultrasonics could serve as a basis for a technique to characterize the microstructure evolution of steel in various temperature ranges.
© 2003 Published by Elsevier B.V.
Keywords:Internal friction; Ultrasound absorption; Reverberation technique; Laser ultrasonics
1. Introduction
In this paper, we use an approach that combines laser ul-trasonics with the reverberation technique to follow the evo-lution of internal friction during thermal cycles applied to medium-carbon steel samples. The long-term goal of this type of measurements is to identify potential industrial ap-plications for a technique based on ultrasound absorption to characterize the microstructure evolution of steels. Despite the industrial importance of steel, literature does not contain a wealth of references on this topic. Recent papers include measurements in low-carbon steel as a function of
temper-ature and applied magnetic field [1] and a demonstration
of the potential use of ultrasound absorption to monitor the
annealing of low-carbon steel[2].
In the reverberation technique, first proposed by Willems
[3], an ultrasonic pulse is generated at the surface of a
finite-size sample. The pulse propagates and looses its co-herence due to scattering by the microstructure and to side-wall reflections and mode conversions. After a certain time, it gives rise to a “diffuse field” with energy distributed over
∗Corresponding author. Tel.: +1-450-641-5198; fax: +1-450-641-5106.
E-mail address:guy.lamouche@nrc.ca (G. Lamouche).
the volume of the sample, the amplitude of the distribution decreasing only by absorption. An absorption coefficient can thus be evaluated by following the temporal evolution of this “diffuse field” at any point on the surface of the sam-ple. For polycrystalline materials, this technique represents a huge improvement over the previously used attenuation measurements in the pulse-echo approach. In the latter case, ultrasound attenuation is caused by both scattering and ab-sorption and it is not always obvious to discriminate the two contributions.
Paul et al. further improved the reverberation technique[4]
by combining it with laser ultrasonics. In laser ultrasonics, ultrasound is generated with a short laser pulse and detected with another laser combined with an interferometer, mak-ing this technique completely non-contact. It thus improves over the initial version of the reverberation technique using conventional transducers at least in two aspects. Firstly, it
solves the problem encountered by Willems [3] related to
parasitic losses induced by contact transducers. Secondly, it also allows reverberation measurements on samples at high temperature, something not obvious to do with contact transducers. Additionally, since the ultrasonic pulse gener-ated by a laser pulse is broadband, a single measurement can provide ultrasound absorption over a wide frequency range. Although this is an advantage in most cases, it can be
0921-5093/$ – see front matter © 2003 Published by Elsevier B.V. doi:10.1016/j.msea.2003.07.019
402 G. Lamouche et al. / Materials Science and Engineering A 370 (2004) 401–406
a disadvantage in a few cases. For example, the analysis of phenomena observed in the MHz range can be complicate when coupled to phenomena occurring at lower frequencies. In this paper, we have chosen the reverberation technique for its conceptual simplicity. We first provide some details about the experimental setup. We then present and discuss internal friction measurements performed during thermal cy-cles applied to medium-carbon steel.
2. Experimental methods
Medium-carbon steel (0.3 wt.% C, 0.8 wt.% Mn,
0.95 wt.% Cr) samples (about 1 mm thick) are cut into an
irregular four-sided shape of about 1 cm2 area. Not much
is known about the prior history of the samples other than that they are cut-out of a piece previously deformed in the austenitic phase and probably free cooled to room temper-ature. The samples are suspended vertically in the middle of a radiant furnace by a thermocouple welded on their rim (Fig. 1). Thermal cycles are applied in a helium atmosphere in order to avoid oxidation and to insure a good heating contact. Two windows, transparent to laser radiation wave-lengths, allow the generation and detection laser beams to enter the furnace. Ultrasound is generated on one side of the sample by an excimer laser pulse (KrF at 248 nm) of about 5 ns duration and of about 200 mJ energy. The laser spot is <0.1 mm and generates ultrasonic waves in a broad frequency range by ablating a very small amount of ma-terial on the surface. For detection, the 1064 nm output of either a long-pulse (2 ms duration) Nd:YAG laser producing 150 mJ or a continuous 200 mW Nd:YAG miser is focused on the other side of the sample. The reflected laser light is frequency modulated due to the Doppler effect caused by the surface motion induced by the ultrasonic vibrations. It is collected in an optical fiber and demodulated with a 0.5 m confocal Fabry–Perot interferometer. This experimental configuration allows ultrasound absorption measurements
Generation laser Fabry-Perot interferometer Optical fiber He flow Window Thermocouple Sample Heating elements Detection laser
Fig. 1. Laser-ultrasonic setup in the radiant furnace (side view). Ultrasound is generated on one side and detected on the other side of the sample held by a thermocouple welded on its rim.
in the 2–45 MHz frequency range, although ultrasound is generated over a much wider frequency range.
The noise-like signal resulting from mode conversion and
scattering is processed by joint time-frequency analysis[5].
This means that multiple Fourier transforms are performed using a sliding time window in order to follow the evolution of the power spectrum as a function of time. Waiting long enough after the initial pulse to ensure that a diffuse field is obtained, absorption coefficients are evaluated by fitting the decrease in amplitude of the Fourier components with an exponential decay for durations varying between 30 and 500 s. An average of 30 signals generated at different lo-cations on the samples’ surface is used to obtain a spatial average of the diffuse acoustic field. Ultrasound absorption measurements are converted to the internal friction
parame-ter Q−1using:
Q−1= 0.115
π α
f, (1)
where α is the absorption in dB/s, f the frequency in MHz and the 0.115/π factor is a conversion factor from dB into Nepers/radian.
3. Results and discussion
Fig. 2shows the variation in internal friction measured at 10 MHz during a thermal cycle in which the sample is heated
(1◦C/s) from room temperature up to an austenitizing
tem-perature of 1200◦C, where it is held for 10 min and then
allowed to cool (1◦C/s) to room temperature. The 10 min
upper plateau leaves enough time for the grains to attain a
stable size. Measurements are limited to 900◦C and below.
At high temperature, there is a loss of reflected light when the low power 200 mW miser is used. This may be caused by an optical misalignement due to the thermal deformation of the sample holder (thermocouple wires) or by a decrease in reflectivity of the sample surface. When measurements are performed with the more powerful Nd:Yag pulsed laser, internal friction can nevertheless be recorded at high tem-perature. Unfortunately, the pulsed Nd:Yag laser was not
available when the measurements ofFig. 2were performed.
At the beginning of the heating process, internal friction is rather small and does not vary much with temperature.
A small peak appears below 400◦C. It is identified as a
Snoek peak and it will be discussed further below during the analysis of the cooling part. A steep rise in internal
friction occurs above 500◦C. We attribute an important
part of this increase to magnetoelastic effects (attributed
to micro-eddy currents as in [3]) as suggested by the
sud-den decrease observed right after the Curie temperature
(768◦C). Dilatometry measurements indicate that the
trans-formation to austenite for this steel happens near the Curie temperature. It could also contribute to this sudden fall in internal friction. We nevertheless favor the hypothesis of the disappearance of the magnetoelastic contribution on the
G. Lamouche et al. / Materials Science and Engineering A 370 (2004) 401–406 0 100 200 300 400 500 600 700 800 900 0.000 0.001 0.002 0.003 0.004 0.005 Internal friction Temperature (oC) F= 10MHz Heating (about 1oC/s) Cooling (about 1oC/s)
Fig. 2. Internal friction (Q−1) measured at 10 MHz for a medium-carbon steel sample heated to 1200◦C (1◦C/s), held at that temperature for 10 min and cooled down to room temperature (1◦C/s). Only measurements below 900◦C are shown.
basis of previous measurements in low-carbon steel [1].
Between 800 and 900◦C, internal friction increases rapidly
with temperature in the austenitic phase.
Upon cooling after the austenitizing plateau at 1200◦C,
the behavior in internal friction is much different. First ob-servations are that the internal friction at high temperature is much smaller than before, that there is no abrupt signature of a ferromagnetic transition, that there is a small increase in
internal friction starting below 600◦
C, that the peak below
400◦
C is much higher in amplitude, and that the resulting
0 100 200 300 400 500 600 700 800 900 0.0000 0.0005 0.0010 0.0015 0.0020 0.0025 0.0030 Internal friction Température [˚C] F = 20MHz cooling from 950oC cooling from 1200oC
Fig. 3. Internal friction (Q−1) measured at 20 MHz for medium-carbon steel samples heated to 950 and 1200◦C (10◦C/s), held at these temperatures for 10 min and cooled down to room temperature (1◦C/s). Only measurements below 950◦C are shown. The dashed lines indicate the phase transition boundaries for the 950◦C cycle. The dotted lines indicate the region where most of the phase transition occurs for the 1200◦C cycle.
internal friction at room temperature is smaller than before the thermal cycle.
In fact, the behavior during cooling is also strongly de-pendent upon the austenitizing temperature. It is, thus, bet-ter discussed by considering two austenitizing temperatures. Fig. 3shows the internal friction measured at 20 MHz dur-ing the cooldur-ing part of two thermal cycles beginndur-ing by a
heating (10◦C/s) to 950◦C for one case and to 1200◦C for
the other case. In both cases, the heating is followed by a 10 min plateau at the austenitizing temperature ended by a
404 G. Lamouche et al. / Materials Science and Engineering A 370 (2004) 401–406
cooling at 1◦C/s. Note that the heating rate is faster from
that ofFig. 2, but the increased heating rate does not alter
much the behavior observed upon cooling since the differ-ence in internal friction at 20 MHz upon cooling between the
two cycles at 1200◦
C with different heating rates is <6% on average.
The 1200◦C cycle leads to smaller internal friction at
high temperature than the 950◦C cycle. It is not yet
identi-fied if this is due to the larger grain size, to the dissolution
of precipitates occurring when heating to 1200◦C, or to a
different dislocation configuration.
For the 950◦C cycle, there is a clear increase in internal
friction between 700 and 635◦C, followed by a decrease.
This is related to the austenite-to-ferrite transition. The percentage of austenite during the phase transition is deter-mined from dilatometry measurements and is presented in Fig. 4. These dilatometric measurements were performed on larger samples in a Gleeble thermomechanical simulator with thermal cycles identical to those applied during absorp-tion measurements. It can be clearly observed that the phase
transition begins near 700◦C and ends just below 600◦C.
The dashed vertical lines indicate the beginning and ending
of this phase transition in bothFigs. 3 and 4. The apparent
peak observed within this temperature range inFig. 3is
ex-plained as follows. A magnetoelastic contribution is added to the internal friction as the content of ferrite increases
since all this happens below the Curie point (768◦C). But,
this magnetoelastic contribution also decreases with
tem-perature, leading to an apparent peak near 635◦C.
For the 1200◦C cycle, there is an apparent peak just
below 800◦C. The nature of this feature that has been
ob-served for many cycles with high austenitizing temperatures
300 400 500 600 700 800 0 20 40 60 80 100 Percentage of austenite Temperature [˚C] Cooling from 950oC Cooling from 1200oC
Fig. 4. Percentage of austenite evaluated from dilatometry for the phase transformation occurring during the cooling portion of the 950 and 1200◦C cycles. The dotted and dashed lines identify the regions where most of the phase transitions occur.
(not shown) has yet to be identified. It does occur near
the Curie temperature (768◦C), but since it happens in the
paramagnetic austenitic phase, it cannot be attributed to any
magnetoelastic effect. Below 700◦
C, the evolution of inter-nal friction is again related to the austenite decomposition that occurs mostly at much lower temperature than for the
950◦C cycle. The percentage of austenite during the phase
transition as evaluated using dilatometry is presented in Fig. 4. Above 540◦C, there is formation of a slight amount
of ferrite and pearlite. This leads to a slight increase in
internal friction inFig. 3. But, most of the phase transition
occurs between 540 and 400◦C, these two temperatures
being identified by vertical dotted lines in Figs. 3 and 4.
This temperature range corresponds to the formation of
bainite[6]. Again, the gradual appearance of bainite as the
temperature decreases leads to a magnetoelastic
contribu-tion to internal friccontribu-tion below 550◦C but it can hardly be
isolated since it occurs very close to a large peak observed
near 380◦
C.
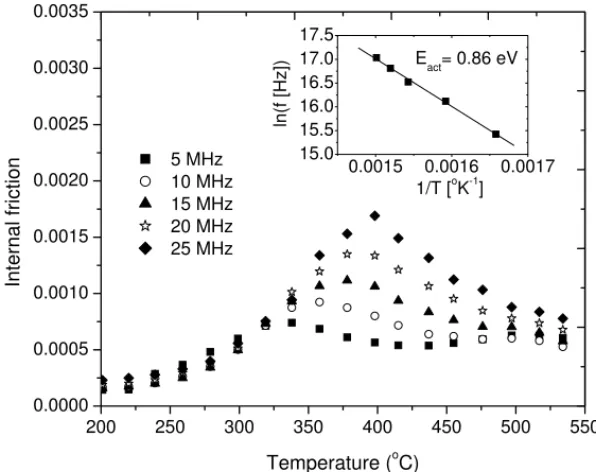
The peak near 380◦
C is present for both the 950 and
1200◦C cycles, but is much stronger in the latter case.
This peak is present in the heating portion, but again with much smaller amplitude. It is attributed to a Snoek peak. As pointed in the introduction, the measurements performed with laser ultrasonics are broadband, so the variation of this peak with frequency is easily obtained as
presented in Fig. 5. It is a difficult exercise to remove the
background, so a rough estimate of the peak positions is performed without removing it. The Arrhenius plot
pro-vided as an insert in Fig. 5 gives an activation energy of
0.86 eV. Taking into account the uncertainty in the peak position, this is in good agreement with a C (0.87 eV) or N
G. Lamouche et al. / Materials Science and Engineering A 370 (2004) 401–406 200 250 300 350 400 450 500 550 0.0000 0.0005 0.0010 0.0015 0.0020 0.0025 0.0030 0.0035 0.0015 0.0016 0.0017 15.0 15.5 16.0 16.5 17.0 17.5 5 MHz 10 MHz 15 MHz 20 MHz 25 MHz Internal friction Temperature (oC) Eact= 0.86 eV ln(f [Hz]) 1/T [oK-1]
Fig. 5. Snoek peak observed at 5–25 MHz for the 1200◦C cycle. Insert shows the Arrhenius plot from which an activation energy of 0.86 eV is evaluated.
(0.81 eV) Snoek peak [7]. The fact that the peak is much
higher for the 1200◦
C case is probably due to a better dispersion of carbon or nitrogen at high temperature lead-ing to a higher concentration of interstitial elements upon cooling.
Finally, near room temperature, the resulting internal
friction is smaller for the 1200◦C than for the 950◦C.
The major contribution to internal friction at room tem-perature should again be of magnetoelastic nature. As said
above, the microstructure resulting from the 1200◦C is
mostly composed of bainite. This microstructure is char-acterized by fine plates of ferrites and is probably less prone to magnetoelastic losses than the ferrite–pearlite
mi-crostructure resulting from the 950◦C cycle. Willems [3]
also reports different behavior in internal friction due to magnetomechanical damping for steels presenting different microstructures.
4. Conclusion
Ultrasound absorption measurements are performed with the combination of the reverberation technique and laser ul-trasonics during thermal cycles applied to medium-carbon steel samples. During heating, a small Snoek peak is ob-served along with a magnetic transition and a high tempera-ture background. Upon cooling, the behavior of the internal friction is much different from that of heating and varies with the austenitizing temperature: reduced high-temperature absorption, delayed phase transition, reduced magnetoelas-tic contribution, and stronger Snoek peaks are observed. This work shows that a technique to measure ultrasound absorption using laser ultrasonics would be of high value to
characterize the microstructure evolution of steel in various temperature ranges.
The reverberation technique combined with laser ultra-sonics is restricted to finite-size samples. Consequently, it is not a technique that could be used in an industrial en-vironment, except for very special cases. Ultrasound ab-sorption measurements could nevertheless be performed in polycrystalline materials by using the diffuse field
tech-nique developed by Guo et al. [8]. In this approach, an
ultrasonic pulse is generated on the surface of the mate-rial and gives rise, after many scattering events, to a lo-calized energy cloud that evolves as a diffusion process. Combined with laser ultrasonics, this approach provides a nondestructive and non-contact technique to measure both
the diffusion and absorption coefficients of ultrasound [9].
This approach is nevertheless restricted to materials that scatter ultrasound enough for the diffusion regime to be attained.
Acknowledgements
The authors would like to thank Ian Leroux, Laetitia Gille, and Martin Lord for technical support and for performing experimental measurements.
References
[1] S. Bolognini, A. Moreau, J. Appl. Phys. 94 (2003) 3771.
[2] S. Kruger, S. Bolognini, G. Lamouche, in: Proceedings of the 11th International Symposium on Non-destructive Characterization of Materials, 2002, Berlin, Germany, Springer Verlag (2003) 33– 38.
406 G. Lamouche et al. / Materials Science and Engineering A 370 (2004) 401–406
[3] H. Willems, in: D.O. Thompson, D.E. Chimenti (Eds.), Review of Progress in Quantitative Non-destructive Evaluation, 1987, pp. 473–481.
[4] M. Paul, B. Haberer, W. Arnold, Mater. Sci. Eng. A168 (1993) 87. [5] A. Moreau, M. Lord, D. Lévesque, M. Dubois, J.F. Bussière, J.
Alloys Compd. 310 (2000) 427.
[6] R.W.K. Honeycombe, H.K.D.H. Bhadeshia, Steels: Microstructure and Properties, 2nd ed., Edward Arnold, London, 1995.
[7] M. Weller, in: R. Schaller, G. Fantozzi, G. Gremaud (Eds.), Mechanical Spectroscopy Q−1 with Applications to Materials Sci-ence, Trans Tech Publications, Aussois, France, 2001, pp. 95– 137.
[8] C.B. Guo, P. Holler, K. Goebbels, Acustica 59 (1985) 112. [9] G. Lamouche, A. Moreau, M. Lord, D. Lévesque, Apparatus and
Method for Evaluating the Physical Properties of a Sample Using Ultrasonics, US Patent 6, 532, 821, 2003.