HAL Id: halshs-01109838
https://halshs.archives-ouvertes.fr/halshs-01109838
Submitted on 27 Jan 2015HAL is a multi-disciplinary open access archive for the deposit and dissemination of sci-entific research documents, whether they are pub-lished or not. The documents may come from teaching and research institutions in France or abroad, or from public or private research centers.
L’archive ouverte pluridisciplinaire HAL, est destinée au dépôt et à la diffusion de documents scientifiques de niveau recherche, publiés ou non, émanant des établissements d’enseignement et de recherche français ou étrangers, des laboratoires publics ou privés.
Has structural economic vulnerability decreased in Least
Developed Countries? Lessons drawn from retrospective
indices
Joel Cariolle, Michaël Goujon, Patrick Guillaumont
To cite this version:
Joel Cariolle, Michaël Goujon, Patrick Guillaumont. Has structural economic vulnerability decreased in Least Developed Countries? Lessons drawn from retrospective indices. 2014. �halshs-01109838�
fondation pour les études et recherches sur le développement international
LA FERDI EST UNE FOND
A TION REC ONNUE D ’UTILITÉ PUBLIQUE . ELLE ME T EN ŒUVRE A VEC L ’IDDRI L ’INITIA TIVE POUR LE DÉ VEL OPPEMENT E
T LA GOUVERNANCE MONDIALE (IDGM).
ELLE C
OORDONNE LE LABEX IDGM+ QUI L
’ASSOCIE A U CERDI E T À L ’IDDRI. CE T TE PUBLIC A TION A BÉNÉFICIÉ D ’UNE AIDE DE L ’É TA T FR ANC AIS GÉRÉE P AR L ’ANR A U TITRE DU PR OGR A MME «INVESTISSEMENT S D ’A VENIR» POR
TANT LA RÉFÉRENCE «ANR-10-LABX
-14-01».
Abstract
Monitoring of structural change in Least Developed Countries (LDCs) requires
examination of the changes in their structural economic vulnerability. This cannot
be done by comparing the level of the Economic Vulnerability Index (EVI) that is
calculated for each triennial review of the list of LDCs, because of the change in
the design of the index. In this paper, the change in the structural vulnerability of
LDCs is assessed according to two retrospective series of EVI, based on constant
deinitions, those respectively used at the 2006 and 2012 reviews. The real change
in structural economic vulnerability is thus isolated from the impact of the changes
in the design of the index (components, weighting, methods of calculation, and
data
updating).
... /...
Acknowledgments: Martine Bouchut, Mathilde Closset, Sosso Feindouno and Olivier Santoni at Ferdi and Cerdi are acknowledged for their invaluable assistance, without being committed by opinions
Has structural economic
vulnerability decreased in Least
Developed Countries? Lessons
drawn from retrospective indices
Joël Cariolle, Michaël Goujon, Patrick Guillaumont
Michaël Goujon is Associate Professor in economics at CERDI-CNRS-University of Auvergne. He is also program oicer for “Innovative
Development Indicators” at the Ferdi.
Patrick Guillaumont is the President of the Fondation pour les Études et Recherches sur le Développement International (Ferdi). He is also Professor Emeritus at the University of Auvergne.
Joël Cariolle has a PhD in Economics. He is an Associate researcher for FERDI, addressing issues related to economic vulnerability and governance. He is also expert in anti-corruption policies. // [email protected]
W
ork
ing Paper
D
ev
elop
ment Ind
ica
to
rs
October 2014
…/… According to both retrospective series, structural vulnerability is not only markedly higher in LDCs than in other developing countries, but it shows a later and smaller decline over the period 1990-2011. The declining trend of EVI is due mainly to the trend of the shock sub-index which is more marked in non-LDCs than in LDCs according to both designs. On the other hand, the exposure trend, which declines at a similar rate in LDCs and non LDCs, seems to result from two factors which do not reflect a real structural change in LDCs: a higher population growth and a less rapid increase of the share of population located in low elevation areas.
Moreover the change in 2012 of the weighting of the exposure index, together with the addition of the low elevation coastal zone (LECZ) component (at the expense of population size), introduced a bias into the distribution of vulnerability values within the LDC group. It works against dry land countries, which are often threatened by climate change. It also leads to underestimate the increase in the gap between the structural vulnerability of LDCs and non-LDCs.
1.
Introduction
Economic vulnerability can be defined as the likelihood that a country’s economic development could be hindered by unforeseen exogenous shocks (Guillaumont, 2009ab). In 2000, economic vulnerability, measured by the Economic Vulnerability Index (EVI), became one of the three criteria for the triennial reviews of the list of Least Developed Countries (LDCs) by the United Nations Committee for Development Policy (UN-CDP). This index replaced the Economic Diversification Index, which was introduced in 1991, and which reflected economic vulnerability to a lesser extent. The other two indices used as identification criteria are GDP per capita and the Human Assets Index (HAI) (Guillaumont 2009a). The EVI measurement methodology was revised for the 2006 and 2012 reviews of the list of LDCs (see Figure 1).
Economic vulnerability can be seen as resulting from three main components: the size and likelihood of exogenous shocks (either natural or external), the exposure to these shocks, and the resilience to these shocks (or the capacity to react). While the two former determinants mostly depend on country structural features (e.g. international price fluctuations, geographic location, etc), resilience relies on the current economic policy of countries, as well as on the levels of income per capita and human capital, which are taken into account separately for the identification of LDCs. The EVI is intended to reflect a structural vulnerability to exogenous shocks, and so is composed of two sub-indices: for exposure, and for shocks.
Figure 1: Composition of the EVIs
2006/2009 COMPOSITION OF THE EVI
• Exposure index (50%): (smallness of) population size (25%), remoteness from world markets (12.5%), export concentration (6.25%), share of agriculture, forestry and fishing in GDP (6.25%).
• (Size and likelihood of) shock index (50%): Homeless population due to natural disasters (12.5%), instability in agricultural production (12.5%), instability of exports of goods and services (25%).
2012 COMPOSITION OF THE EVI
• Exposure index (50%): (smallness of) population size (12.5%), remoteness from world markets (12.5%), export concentration (6.25%), share of agriculture, forestry and fishing in GDP (6.25%), share of population living in low elevation coastal zones (12.5%).
• (Size and likelihood of) shock index: victims of natural disasters (12.5%), instability in agricultural production (12.5%), instability in exports of goods and services (25%).
Note: weighting of components given in brackets
While the 2006 and 2009 reviews of the list of the LDCs were based on the same definition of EVI, in its 2012 review, the CDP made several changes regarding the weighting and calculation of EVI components.
In the exposure index:
• a new component, the share of population living in low elevation coastal zones (LECZ), was added to the other components of the exposure index, thereby reducing the weighting of the population size component from 50% to 25% of the exposure index in 2012;
• while the 2006 and 2009 reviews used annual data for the calculation of the export concentration and the share of agriculture indices, the 2012 review used 3-year average data; • the remoteness from the world market index in 2012 was the average distance necessary for
a country to reach 50% of total world trade. It consists in ranking a country’s closest trade partners according to their simple physical distance, then selecting these partners and summing their shares of trade in total world trade until the 50% threshold is reached. The average distance is then calculated as the average bilateral distance weighted by the partners’ world trade shares. In the 2006 and 2009 reviews, the remoteness index consisted in ranking a country’s closest trade partners according to their physical distance weighted by their share of exports in total world exports, then selecting these partners and summing their shares of exports in total world exports1. The average distance was then calculated as the
average bilateral distance weighted by the partners’ world exports shares. In the shock index:
• the index of homeless caused by natural disasters used in the 2006 and 2009 reviews was replaced by a broader index of victims of natural disasters;
• the period used for computing instability indicators covered 28 years for exports, and 16 years for agricultural production in the 2006 and 2009 reviews. The calculation period for both these instability indicators is set at 20 years in the 2012 review.
According to the EVI of the UN-CDP triennial reviews of LDCs, structural economic vulnerability in LDCs might appear to have decreased between the 2006 and the 2012 reviews. However, because of the changes in the definitions of EVI, and data updating, any conclusion drawn from the comparison of the 2006 and 2012 EVIs may be misleading.
This drawback can be addressed by computing “retrospective EVI” series according to unchanged definitions. This was done first for the 1970-2005 period, using both 10-year and 5-year indices measured according to the definition used by the CDP in 2006 (Guillaumont, 2007, 2009a), then with updated data for the 1975-2008 period, using annual data, according to the 2006/2009 definition (Cariolle, 2011; Cariolle and Guillaumont 2011).
In this paper we use two “retrospective EVI” series, both based on updated raw data and using constant definitions, the 2006/2009 definition (called “retrospective 2006/2009 EVI”), and the 2012
1 Annex B provides additional insights into the way the remoteness index was calculated in the 2006 / 2009 and the 2012
definition (called “retrospective 2012 EVI”) (Cariolle and Goujon, 2013).2 Both (annual) series cover
48 LDCs and 82 non-LDCs over the period 1975-2011 for the 2006/2009 retrospective EVI, and the period 1979-2011 for the 2012 retrospective EVI. Comparing these two retrospective series leads to evaluation of the impact of the various changes in the definition of EVI between the 2006/2009 reviews and the 2012 review on the level and changes in structural economic vulnerability in LDCs, and on its components.
In section 2, the changes in UN-CDP EVI between the 2006 and the 2012 reviews is shown to depend on four categories of factors: (i) the variations caused by the changes in the index design, which include both the weighting of components and the composition of the index, (ii) the method of components calculation, (iii) data updating, (iv) and the actual changes in structural vulnerability.
In section 3, the effects of the change in the design of EVI on cross-country differences in EVI levels are analyzed for LDCs for the year 2011.
Section 4 presents a comparative appraisal of the changes in structural vulnerability in LDCs and non-LDCs, using the retrospective series built with new data and constant design, the 2006/2009 retrospective EVI and the 2012 retrospective EVI.
Section 5 discusses ways of moving toward a revised EVI, the retrospective series of which would better reflect structural change than the 2006/2009 and 2012 retrospective series.
This study shows that, while improvements in the EVI calculation may be desirable, only the analysis of retrospective series, calculated with constant definitions, allows observers to properly assess the trends in structural vulnerability over time.
2.
Assessing the changes in structural vulnerability: the need for retrospective series
with constant definition
Three main sources of variation in the UN-CDP EVI values between the 2006 and the 2012 reviews can be identified:
• the change in the weighting of EVI components,
• the change in the measurement of EVI components, resulting from: - changes in the method of calculation of these components; - changes due to updates in component raw data;
• the actual change in structural vulnerability, resulting from the “real” change in the EVI components, when holding the EVI design constant (weighting + measurement).
2 However, in particular due to data updating, the “retrospective 2006/2009 EVI” and the “retrospective 2012 EVI” differ
In this section, we disentangle the contribution of each of these sources of variation, to isolate the “real” change in EVI, by using the 2006/2009 definitions (i.e. the retrospective 2006/2009 EVI values for 2004 and 2010). The results of this breakdown are given below in Tables 1 to 3, respectively related to the whole set of LDCs, considered on average, and to specific countries, Bangladesh and Central African Republic (CAR). Results for the whole set of LDCs are also given with the 2012 definition series (Table 1, last column).
Table 1. Breakdown of the change in EVI between the 2006 and 2012 CDP reviews – LDCs average
Constant 2006 Definition Constant 2012 Definition
A. OFFICIAL EVI VALUES (CDP REVIEWS)
A.1. EVI 2006 review 53.24 53.24
A.2. EVI 2012 review 45.55 45.55
Total variation between 2006 and 2012 reviews: A.2 - A.1 -7.69 -7.69
B. RETROSPECTIVE EVI VALUES*
B.1. Retrospective EVI for the year 2004 47.85 47.24
B.2. Retrospective EVI for the year 2010 44.11 45.10
Variation explained by real change in components, index design unchanged: B.2 - B.1 -3.74 -2.15
C. BREAKDOWN OF EVI VARIATION (2006-2012)
C.1. Total variation 2006-2012 = C.2 + C.3 + C.4 -7.69 -7.69
C.2. Variation explained by the change in the weighting of components -2.95 -5.78 C.3. Variation explained by the change in the measurement of components = C.3.1 + C.3.2 -1 0.24
C.3.1. change in component calculation 3.94 5.18
C.3.2. data updating -4.94 -4.94
C.4. Variation explained by real change in components, index design unchanged: B.2 - B.1 -3.74 -2.15
* The EVI values in the 2006 and 2012 Reviews are based on data corresponding to 2004 and 2010 respectively. This is why we use retrospective EVI values in 2004 and 2010.
In Table 1, we break down the variation of EVI average values for the LDCs between the 2006 review and the 2012 review according to the methodological framework set out in Annex A.
The difference between the value reported in the CDP reviews of 2006 (A.1), and the value for the year 2004 recalculated with the retrospective EVI (B.1), is mainly due to data updating since the difference in methods is marginal. From A.1 to A.2, the average “official” EVI value decreases by 7.7. The decrease in the retrospective EVI estimated on the basis of constant 2006/2009 definition, between B.1 and B.2, is 2 or 3 times smaller (3.7 with the 2006 design, 2.1 with the 2012 design). This suggests that the actual progress of LDCs in decreasing their EVI between the two reviews would be highly over-estimated if it was assessed from official figures.
Data updating greatly contributes to the over-estimation of the progress. In what follows, we assess the respective contribution of the three above-mentioned sources of EVI variations (data, design and real structural change) to the differences observed between the 2006 and 2012 official EVI values. In particular, we highlight the contribution of the change in the design of the EVI, and its implications for the measurement of structural economic vulnerability within the LDCs.
2.1.Impact of the change in the weighting of EVI components
A major change in the EVI concerns its components and their weighting pattern: the reduction of the weighting of the population size component from 25% to 12.5% with the other 12.5% being allocated to a new component, the share of population located in low elevation coastal zones (LECZ). Table 1 shows that this change in weighting reduces by 2.95 the average LDC index value with the “2006 retrospective series” (5.78 with the “2012 retrospective series”), contributing to nearly 38% (75%) of the “official” reduction in vulnerability in LDCs between the 2006 and the 2012 reviews. However, as shown later, this hides disparities within the LDC group: this change obviously pulls down EVI values in LDCs with few or no low coastal areas (landlocked countries), but pulls up values in LDCs with a large share of the population located in coastal areas.
Table 2 presents the same breakdown of the variation of vulnerability values between the 2006 review and the 2012 review, using the 2006/2009 retrospective series, in one landlocked LDC – Central African Republic (CAR), and one coastal LDC – Bangladesh. The effect of the change in the weighting of EVI components is striking in both countries, which saw their official vulnerability values decline by 15 and increase by 6.6 respectively.
Interestingly, Table 2 shows that the level of EVI for CAR in 2004 is similar to its 2010 level – keeping the 2006/2009 EVI definition. The change in weighting accounts for 40% (6 out of 15) of the decrease in official EVI values. The difference between official EVIs and retrospective EVI is even more salient for Bangladesh, as illustrated by the opposite variation of the official EVI which increases by 6.6, and the retrospective 2006/2009 EVI which declines by 4.4 between 2004 and 2010.
2.2.Impact of the change in the measurement of EVI components
The calculation method for some components also changed. This contributes a lot to the change in the EVI values between the UN-CDP Reviews. In particular, the index of natural disaster was proxied in 2006/2009 by a homeless indicator, and in 2012 by a broader indicator of the share of population victim of natural disaster. Also important are the change in the calculation of the remoteness indicator, and to a smaller extent the length of the period over which export instability was calculated. All these changes in the method of measurement of the EVI components contribute, artificially, to an increase in the average LDC EVI of 3.94, an increase in the EVI of Bangladesh of 4.48, and a decrease in CAR’s EVI of 4.67.
Data updating has a significant impact on EVI values, but in the opposite direction (minus 4.9 for the average LDC EVI). It is mainly due to export instability (minus 2.1), and to a lesser extent to the Disaster index (minus 0.9), agricultural instability (minus 0.7), and remoteness (minus 0.7).
Taken together, changes in weighting, calculation method, and data updating explain the gap of 4 between the decrease of 7.7 in the official EVI and the real decrease of 3.7 in the EVI according to the unchanged 2006/2009 design. According to the 2012 design or series, these changes together amount to minus 5.4, corresponding to an even higher gap since the estimate of the real decrease is 2.1 instead of 3.7.
Only the decrease in the EVI with unchanged design can be seen as reflecting a structural change, a fall in structural economic vulnerability, since it results from an actual improvement in some EVI components. The change in structural vulnerability over time is better captured with retrospectively updated data.
In what follows we use the two retrospective series calculated according to constant definitions for highlighting to what extent changes in the definitions affect cross-country differences in the level of EVI and its components.
Table 2. Breakdown of the change in EVI between the 2006 and 2012 CDP reviews, Central African Republic (CAR) and Bangladesh, using 2006 definition as a reference3.
Explaining the change in CAR A. Official EVI (CDP Reviews)
A.1. EVI 2006 review 50,80
A.2. EVI 2012 review 35,65
Total variation between 2006 and 2012 reviews: A.2 - A.1 -15,14
B. Retrospective EVI values*, constant definition (2006/2009 definition)
B.1. Retro EVI for the year 2004 42,09
B.2. Retro EVI for the year 2010 41,86
Variation explained by actual change in components, index design unchanged: B.2 - B.1 -0,23 C. Breakdown of EVI variation (2006-2012)
C.1. Total variation 2006-2012: A.1 - A.2 = C.2 + C.3 + C.4 -15,14
C.2. Variation explained by the change in the weighting of components -6,03 C.3. Variation explained by the change in the measurement of components = C.3.1 + C.3.2 -8,89
C.3.1. change in component calculation -4,67
C.3.2. data updating -4,22
C.4. Variation explained by real change in components, index design unchanged: B.1 - B.2 -0,23
Explaining the change in Bangladesh Official EVI (CDP Reviews)
A’.1. EVI 2006 review 25,78
A’.2. EVI 2012 review 32,41
Total variation 2006-2012: A’.1 – A’.2 6,63
B. Retrospective EVI values*, constant definition (2006/2009 definition)
B’.1. Retro EVI 2004 23,48
B’.2. Retro EVI 2010 19,07
Variation explained by real change in components, index design unchanged: B’.1 – B’.2 -4,41 C. Breakdown of EVI variation (2006-2012)
C’.1. Total variation 2006-2012: A’.1 – A’.2 = C’.2 + C’.3 + C’.4 6,63
C’.2. Variation explained by the change in the weighting of components 8,44 C’.3. Variation explained by the change in the measurement of components = C.3.1 + C.3.2 2,60
C’.3.1. change in component calculation 4,48
C’.3.2. data updating -1,88
C’.4. Variation explained by real change in components, index design unchanged: B’.1 – B’.2 -4,41
* The reference year for comparing retrospective series with EVI review values is slightly earlier than the review year.
3.
How do changes in the design of the index affect EVI cross-country rankings among
LDCs
Since data updating is applied to the two retrospective series identically, the difference between the retrospective EVI values are related to the weighting and the method of calculation of EVI components. We first examine this point through correlations between index/sub-index/component cross-country values in the last available year 2011, and for the whole set of LDCs.
Figure 2 provides evidence of the degree of divergence between the values given by the two retrospective series, by displaying a rank correlation of 84%.4
Figure 2. Graph of the correlation between EVI values in 2011, as measured according to the 2012 and the 2006/2009 designs.
Source: Authors
Now putting both data updating and change in the weighting pattern aside, we examine in what follows how changes in the calculation of EVI components between the two retrospective series make the cross-country assessments diverge.
We first compare the EVI components which have been subject to minor changes in their method of calculation (export concentration and the share of agriculture, fisheries, and forestry in GDP indices), and second, those subject to major changes (remoteness index, natural disaster index, and
instability indices). The population index, which is the same in both retrospective series, and the
new component for population of LECZs are not discussed.
4 Please note that since EVI components are normalized on a 0-100 scale following a min-max procedure (Cariolle and
Goujon, 2013), cross-country differences in raw components’ values are altered.
Kiribati Suriname Rank correlation = 84% 0 2 0 4 0 6 0 8 0 0 20 40 60 80 retro EVI 2006-09 95% CI Fitted values Scores re tr o E V I 2 0 1 2
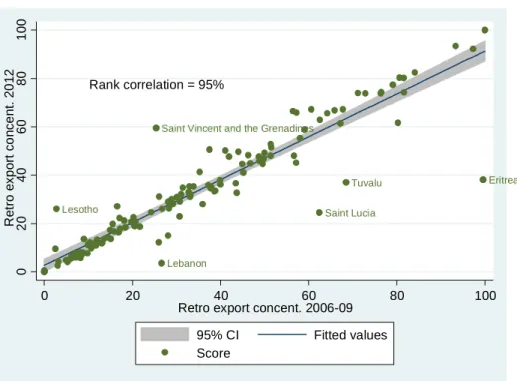
3.1.Replacing annual data by pluri-annual average data: a minor impact on export concentration, and on the share of agriculture, fisheries, and forestry in GDP
The export concentration and the share of agriculture, fisheries, and forestry in GDP indices were subject to minor changes in their calculation between the 2006/2009 and the 2012 reviews. While both indices are calculated on an annual basis in the 2006/2009 reviews, they are calculated on a 3-year average basis in the 2012 review. This change aims to smooth the change observed in the index (in accordance with the aim of measuring structural exposure), and possibly to squeeze in some outliers not seen in annual data. The divergence between the values is small, with a rank correlation of 95% for the export concentration index, and a rank correlation of 99% for the share of agriculture index. The graph of the correlation between the values in 2011 for the export concentration index is displayed in Figure 3.
Figure 3. Graph of the correlation between the values of the export concentration indices in 2011, measured according to the 2012 and the 2006/2009 designs.
Note: The values plotted in this graph are index values. Source: Authors
The components subject to major changes in their calculation methods are remoteness from world markets, natural disaster, export instability, and agricultural instability indices.
3.2.The effect of the change in the way trade partners’ shares in world trade are computed on the remoteness assessment: a moderate impact
Regarding the remoteness index, the change in calculation method concerns the way trade partners are selected. As explained in the introduction, the 2006 and 2009 reviews use the bilateral distance weighted by partners’ share of exports in total world exports to calculate the cumulative
Eritrea
Lebanon
Lesotho Saint Lucia
Saint Vincent and the Grenadines
Tuvalu Rank correlation = 95% 0 2 0 4 0 6 0 8 0 1 0 0 0 20 40 60 80 100
Retro export concent. 2006-09
95% CI Fitted values Score R e tr o e x p o rt c o n c e n t. 2 0 1 2
share of trade partners in total world exports. As a consequence, the weighted distance between one country and a potential trade partner is reduced (increased) when this partner is a large (small) exporter. For a given bilateral distance, bigger exporters are therefore more likely to enter the list of trade partners. In the 2012 review, the cumulative list of partners is calculated according to the
geographical bilateral distance only (unweighted).
One other important difference between the 2006/2009 retrospective series and the 2012 retrospective series is the threshold up to which trade partner shares are cumulated. We set a threshold of 33% of world trade for the new (and older) 2006 and 2009 retrospective series (Cariolle, 2011). We used a 50% threshold for the 2012 retrospective series, following the definition in the 2012 review. Because this threshold applies to all countries and remoteness values are normalized, changes in its value do not trigger major differences in cross-country rankings. Moreover, a lower threshold for the 2006/2009 retrospective series may lead to ignore remote but important trading countries, which would otherwise have appeared at the end of the list of trade partners necessary to reach a 50% share of world trade. Finally, in the 2006/2009 reviews the share of partners’ trade in total world trade is measured as the share of partners’ exports in total world exports. In the 2012 review it is measured as the share of partners’ imports plus exports in total world imports plus exports.
Despite these differences, the correlation between remoteness values in 2011 depicted in Figure 4 remains high (92% rank correlation), with no extreme outlier.
Figure 4. Graph of the correlation between retrospective values of the remoteness indices in 2011, measured according to the 2012 and the 2006/2009 designs.
Note: The values plotted in this graph are index values. Source: Authors
Rank correlation = 92%
North Korea
Philippines
BruneiLao PDR Timor Leste
Papua New Guinea Solomon Isl. Kirib. Vanuatu 0 2 0 4 0 6 0 8 0 1 0 0 0 20 40 60 80 100 Retro remoteness 2006-09 95% CI Fitted values Score R e tr o r e m o te n e s s 2 0 1 2
3.3.The effect of the change in the length of the period covered by the calculation of instability indicators: a significant impact
For the export and agricultural instability indices, the 2012 retrospective series were calculated using a 20-year rolling time window following the 2012 CDP review. The 2006 and 2009 retrospective series were calculated using a 15-year rolling time window.5
Although at first glance these changes are minor, they have a direct implication on the measurement of instability as mentioned in Cariolle and Goujon (2014): the longer the window (the estimation period of the trend around which fluctuations are summed), the larger the measured fluctuations. This point is illustrated in Figure 5 where all outliers are located in the upper left-side of the graphs, showing that instability values in the 2012 retrospective series (with a longer trend calculation period) are higher than those in the 2006/2009 retrospective series (this is more obvious for export instability where some outliers can be clearly observed).
Figure 5. Graph of the correlation between retrospective values of the instability indices in 2011, measured according to the 2012 and the 2006/2009 designs.
Agricultural instability Export instability
Note: The values plotted in this graph are index values. Source: Authors
3.4.The effect of the change in the scope of the component measuring the size of natural disasters: a major impact
The natural disaster index is the component submitted to the biggest change between the two reviews. Discrepancies between the two indices are explained by (i) a change in the scope of natural disaster indices, (ii) a change in the way homeless or victims are averaged, (iii) a change in the period over which homeless or victims are averaged.
5 The calculation of retrospective series necessitated this 15-year rolling window, which differs from the definition of the
2006/2009 review : a 28-year calculation period for the export instability indicator and a 16-year period for the agricultural instability index.
Rank correlation = 90% 0 2 0 4 0 6 0 8 0 1 0 0 0 20 40 60 80 100
Retro Agricultural instability 2006-09 95% CI Fitted values Score R e tr o A g ri c u lt u ra l in s ta b ili ty 2 0 1 2 Iraq Mongolia Suriname Rank correlation = 90% 0 5 0 1 0 0 0 20 40 60 80 100
Retro Export Instability 2006-09 95% CI Fitted values Score Instabexport_2012 R e tr o E x p o rt I n s ta b ili ty 2 0 1 2
First, the former index of homeless caused by natural disasters is replaced by a broader index of
victims of natural disasters (killed or affected requiring immediate food, water, shelter, sanitation or
medical assistance), both as percent of population.
Second, the homeless index in the 2006/2009 design is the annual average share of homeless due to natural disasters cumulated over the period 1970-2011, while the victim index in the 2012 design is the share of victims in the population averaged over a rolling 20-year period (Cariolle and Goujon, 2014). Moreover, the 2006 and 2009 retrospective series required generation of missing data for Saudi Arabia, Libya, Côte d’Ivoire, Tuvalu, and Singapore.6 This is no longer the case for the
2012 retrospective series which required data on victims to be available for at least 1 year in these countries (null values are not considered as missing data, but zero victims or no disaster). Also, the values of the Victim index for Ivory Coast, Saudi Arabia, and Singapore equal 0 because the number of victims is too small to fall within normalization boundaries. For Libya the 20-year time window used for the Victim index excludes disasters which are considered by the Homeless index. So it is possible that the Homeless index value exceeds the Victim index value for a given year, inasmuch records for homeless people start before the Victim index’s 20-year time window.
These extensive changes in the definition of the index, explain why the two series display a very low (23%) rank correlation (see figure 6). Note that even with the same definition, the index of victims for any one year may change significantly over time, with the updating of data (see Cariolle and Goujon, 2013).
Figure 6. Graph of the correlation between retrospective values of the natural disaster indices in 2011, as measured in the retrospective series according to the 2012 and the 2006/2009 designs.
Note: The values plotted in this graph are index values. Source: Authors
6 Procedures for approximations are explained in Cariolle (2011).
Rank correlation = 23%
Saudi Arabia Libya Ivory Coast Tuvalu Singapore
0 2 0 4 0 6 0 8 0 1 0 0 0 20 40 60 80 100 Retro homeless 2006-09 95% CI Fitted values Score R e tr o V ic ti m s 2 0 1 2
Having explained the differences in rankings between indices, sub-indices and components of the EVI 2012 and EVI 2006/2009 retrospective series, it is possible to provide a comparative assessment of the changes in structural economic vulnerability in LDCs and non-LDCs according to the two retrospective databases.
4.
Patterns of change in the structural economic vulnerability of LDCs and non-LDCs
In this section we highlight the consequences of the change in the definition of structural economic vulnerability on its assessment over time, by comparing the changes in EVI, in the exposure index, and in the shock index for LDCs and non-LDCs.
4.1.Changes in structural economic vulnerability of LDCs and non-LDCs according to 2006/2009 and 2012 retrospective EVIs.
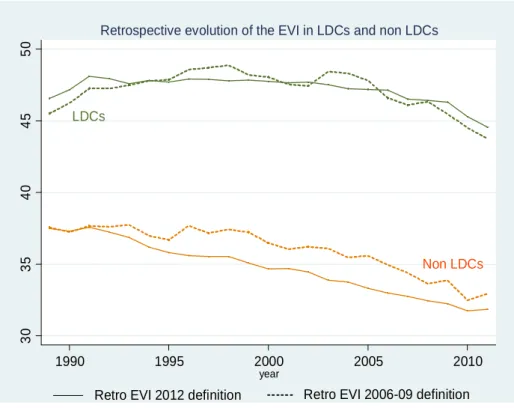
In figure 7, we plot the retrospective average vulnerability values of LDCs and non-LDCs, according to the definitions of the UN-CDP 2006/2009 and 2012 reviews. The retrospective EVIs show that, on average, structural economic vulnerability is much higher in LDCs than in non-LDCs. They also show that structural economic vulnerability appears to fall in both groups, however only in the late 2000s in LDCs.
Figure 7. The changes in structural economic vulnerability 1990-2011, LDCs and non-LDCs averages, 2006/2009 versus 2012 retrospective EVI definitions.
In reflecting structural change, the retrospective EVI series show a more steeply declining trend for non-LDCs than for LDCs, whatever the design of the index. However, this pattern of decline of EVI
Non LDCs LDCs 3 0 3 5 4 0 4 5 5 0 1990 1995 2000 2005 2010 year
Retrospective evolution of the EVI in LDCs and non LDCs
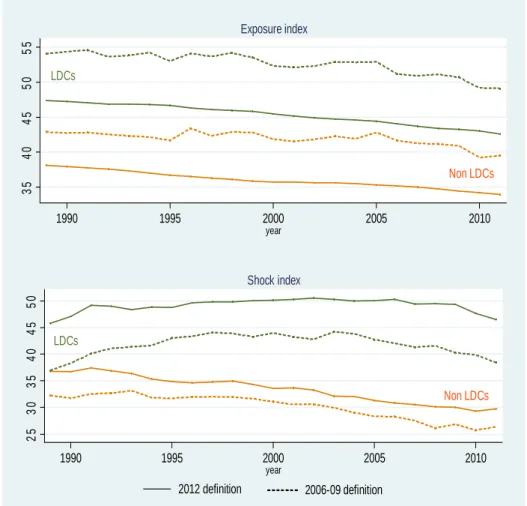
for both country groups, according to the two retrospective series, covers different levels and changes in the exposure and shocks indices, as shown in Figure 8.
First it should be noted that although the historical and average values of the EVI are very similar for the two designs, both for LDCs and non-LDCs, this similarity results from opposite relative positions of the shock and exposure indices: although historical values for the exposure index, measured using the 2012 definition, are on average lower in both groups, compared to the 2006/2009 definition, the values recorded for the shock index are higher in both groups.
Second, the changes in the 2006/2009 retrospective exposure index show more (year-to-year) variability, over time, than the 2012 retrospective exposure index, because of the use of 3-year moving averages for two components in the 2012 design, but not in the 2006/2009 design. Also, for the shock index a slightly higher variability can be seen with the 2006/2009 design, because of the calculation of instabilities over longer periods.
Third and more importantly for our purpose, the overall trend, which is the relevant variable to consider for assessing a structural change, is not markedly affected by the design of the EVI. However this is not necessarily the case for the exposure index and the shock index.
Figure 8. The change in structural economic vulnerability from 1990 to 2011 in LDCs and non-LDCs. Non LDCs LDCs 3 5 4 0 4 5 5 0 5 5 1990 1995 2000 2005 2010 year Exposure index LDCs Non LDCs 2 5 3 0 3 5 4 0 4 5 5 0 1990 1995 2000 2005 2010 year Shock index 2012 definition 2006-09 definition
4.2.How changes in the definition affect the changes in the exposure index.
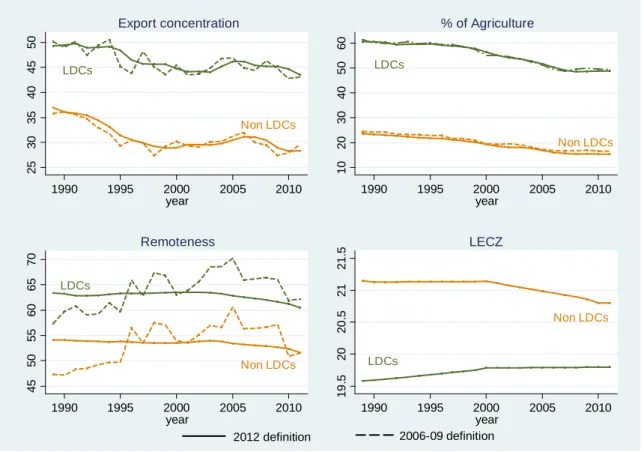
Figure 9 highlights the effect of switching from the 2006/2009 definition to the 2012 definition on the average value, and changes in the exposure to shocks index.
Let us first consider the values. As shown in Figure 8 for both LDCs and non-LDCs, average levels of export concentration, share of agriculture, and to a lesser extent remoteness, are not markedly affected by the change in the design. The new LECZ component, because of its low average values in both LDCs and non-LDCs, is the main cause of the lower value in the 2012 retrospective exposure index, relative to the 2006/2009 one. As shown on the bottom-right graph of Figure 8, this reduction is sharper for the LDCs than for the non-LDCs, as the share of population in low-elevation coastal areas is larger in non-LDCs than in LDCs.
Let us now consider the changes from 1990 to 2011. As regards the export concentration and agriculture share indices, not only the average values but also the changes are very similar for the 2006/2009 and the 2012 retrospective series. However they show a smoother path. This pattern is a direct consequence of switching from an index based on annual values to an index based on 3-year rolling averages.
Regarding remoteness, the 2006/2009 and 2012 retrospective series diverge dramatically7. As seen
above, the 2012 remoteness index consists of ranking (from the closest to the farthest) a country’s trade partners according to the simple bilateral distance, and then summing their shares in World trade (exports plus imports). The 2006/2009 remoteness index consists of ranking a country’s trade partners according to the bilateral distance weighted by the partners’ share in world exports, and then summing the shares in world exports. This change has major implications for the historical changes in the remoteness index. According to the 2012 definition, the list of a country’s trade partners takes into account its neighbors incrementally by closeness, while according to the 2006/2009 definition, geographically remote partners are taken as closer when they represent a big share of international trade. As a consequence, the retrospective remoteness series based on the 2012 definition is more stable, since the list of trade partners used to sum trade shares remains relatively unchanged (except for the last countries used to reach the 50% threshold). By contrast, the retrospective remoteness series calculated according to the 2006/2009 definition changes more, because the list of trade partners is a function of the changing trade shares of trade partners, varying from year to year. Therefore the change over time of the 2006/2009 remoteness index depends more on the emergence of new international trading relations. The trends in the remoteness indices differ, the 2012 design shows a continuous decline in remoteness, whereas there is a rise followed by a decline with the 2006/2009 design.
To sum up, neither the level nor the trend of export concentration and share of agriculture indices, which both decline for both LDCs and non-LDCs, are affected by the change in the component
7
design. However, the change in the calculation of remoteness significantly modifies the profile of its trend over time.
Figure 9. The changes in structural economic vulnerability from 1990 to 2011 in LDCs and non-LDCs.
4.3.How changes in the definition affect the changes in the shock index.
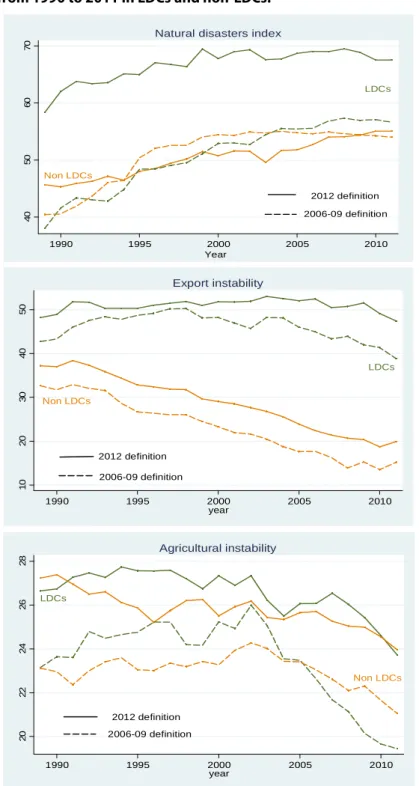
Between the 2006/2009 and the 2012 reviews, the Victims of natural disasters index replaced the Homeless index, and the trend estimation period switched from 15 years to 20 years for the instability indices.
As shown in Figure 9, these changes lead to an increase in the recorded instability in LDCs, and to a widening of the gap between LDCs and non-LDCs. However, this does not affect the (rising) path of the natural disaster index over time for both LDCs and non-LDCs. As regards the export instability index, switching from a 15-year to a 20-year trend estimation period slightly shifts the level of export instability upwards in both LDCs and non-LDCs. The 2012 export instability index in LDCs also experiences a later and smoother decline than the 2006/2009 index. The change in the two retrospective indices is similar in non-LDCs. The agricultural instability index is also shifted upwards in both country groups when the trend estimation period is extended, with no marked consequences on the historical changes in agricultural instability, nor on the gap between LDCs and non-LDCs. It can be seen that the level of the 2006/2009 agricultural instability index in LDCs
LDCs Non LDCs 2 5 3 0 3 5 4 0 4 5 5 0 1990 1995 2000 2005 2010 year Export concentration LDCs Non LDCs 1 0 2 0 3 0 4 0 5 0 6 0 1990 1995 2000 2005 2010 year % of Agriculture LDCs Non LDCs 4 5 5 0 5 5 6 0 6 5 7 0 1990 1995 2000 2005 2010 year Remoteness 2012 definition LDCs Non LDCs 1 9 .5 2 0 2 0 .5 2 1 2 1 .5 1990 1995 2000 2005 2010 year LECZ 2006-09 definition
falls below that in non-LDCs five years later than with the 2012 index, which corresponds to the extension of the instability calculation period.
To sum up, the changes in the calculation methods for the shock index components contributed to the increase in the number of shocks recorded during the period, but they do not significantly change the direction of the trends, they just make them smoother.
Figure 10. The changes in the shock index components from 1990 to 2011 in LDCs and non-LDCs.
Non LDCs LDCs 4 0 5 0 6 0 7 0 1990 1995 2000 2005 2010
Natural disasters index
2012 definition 2006-09 definition Year 2012 definition 2006-09 definition LDCs Non LDCs 1 0 2 0 3 0 4 0 5 0 1990 1995 2000 2005 2010 year Export instability 2012 definition 2006-09 definition LDCs Non LDCs 2 0 2 2 2 4 2 6 2 8 1990 1995 2000 2005 2010 year Agricultural instability
4.4.How each component contributes to an EVI change in LDCs and other developing countries.
In the above analysis a decline of EVI is highlighted for both country groups, according to the two retrospective series. Here, focusing on the decline observed over the 2000s, we assess the relative contributions of the components in such a decline. Still we examine whether they differ between the two retrospective series.
Table 3 reports the changes in EVI averages between 2000 and 2011, for both country groups and with both definitions. It appears that for both groups the decline of the EVI is slower with the 2012 index than with the 2006-2009.. This is the logical result of the transfer of half of the initial weight of the small population size component to the LECZ component, which nearly does not change. Since the population growth is faster in LDCs than in non-LDCs, the contribution of this component to the LDCs EVI decline is higher than in non-LDCs.
Moreover almost all components (average values) contribute to the decline in the EVI averages, whatever the group and the series. A noticeable exception, as observed in the previous section, concerns the natural disaster index, which increases in LDCs, but decreases in non-LDCs with the 2006-2009 definition, and inversely with the 2012 definition. As for the export instability index, which is the main contributor to the decline observed in the EVI averages, its contribution is stronger with the 2006-2009 definition for the LDCs, and weaker for the non-LDCs.8
Table 3. Changes in EVI and its components between 2000 and 2011, calculated with constant definitions 2006-2009 or 2012, LDCs vs non-LDCs averages.
Sources: authors
8 Extending the time-window for trend estimation may inflate (deflate) instability measurement in economies where
trend variations display shorter (longer) periodicity. See Cariolle and Goujon (2014).
EVI -4,6 -3,4 -3,4 -2,8
Expos ure i ndex -1,6 -1,4 -1,2 -0,9
Popul a ti on -1,0 -0,5 -0,7 -0,3
Remotene s s -0,1 -0,4 -0,3 -0,2
Export conce ntra ti on -0,2 -0,1 0,0 0,0
Sha re of a gri cul ture -0,3 -0,4 -0,2 -0,3
LECZ - 0,0 - 0,0
Shock i nde x -3,1 -2,0 -2,2 -1,9
Di s a s ter 0,4 -0,1 -0,1 0,5
Agri cul t. Ins ta b. -0,8 -0,5 -0,3 -0,2
Export. Ins ta b. -2,7 -1,4 -1,8 -2,2
Contri buti on of Exp Ins t
to the cha nge i n EVI 58% 41% 54% 79%
EVI a nd compone nts 2006-2009 de fi ni ti on 2012 de fi ni ti on 2006-2009 de fi ni ti on 2012 de fi ni ti on LDCs Non LDCs
Contribution of Exp Inst EVI Exposure Population Remoteness Export conc. Share of agri LECZ Shock Disaster Agri. Instab. Exp. Instab. to the change in EVI
-24,7 -3,1 -0,7 -2,2 -0,1 -0,1 - -21,6 -0,6 -0,4 -20,6 83% -14,4 -2,7 -0,3 -1,8 0,1 -0,7 0,0 -11,6 0,5 -1,1 -11,0 77% -16,3 0,0 -0,6 -0,3 0,9 0,0 - -16,3 -0,5 -0,3 -15,5 95% -11,3 0,8 -0,3 -0,4 1,5 0,0 0,0 -12,1 0,3 -0,9 -11,5 102% -17,4 -4,5 -0,7 -2,5 0,3 -1,6 - -12,9 -0,8 -2,6 -9,5 54% -18,2 -3,9 -0,4 -2,0 0,0 -1,5 0,0 -14,3 0,0 -1,5 -12,8 70% -24,4 -1,1 -1,3 0,9 -0,7 0,0 - -23,3 0,8 -6,5 -17,6 72% -12,5 -1,1 -0,7 0,0 -0,5 0,0 0,1 -11,5 -1,9 -2,0 -7,6 61% -18,4 -2,5 -1,1 -0,3 -1,1 0,0 - -15,9 -0,8 -2,5 -12,6 69% -14,4 -1,7 -0,6 -0,3 -0,8 0,0 0,0 -12,7 1,7 -1,1 -13,3 92% -11,9 -3,3 -1,4 -0,2 -1,2 -0,5 - -8,6 3,1 -0,3 -11,4 96% -12,1 -4,0 -0,7 -0,2 -2,5 -0,6 0,0 -8,1 0,9 -0,3 -8,7 72% -20,1 -3,4 -1,1 -0,3 -1,9 -0,1 - -16,7 -0,8 -1,5 -14,4 72% -11,3 -2,5 -0,5 -0,5 -1,2 -0,3 0,0 -8,8 0,2 -1,1 -7,9 70% Liberia 2012 definition Djibouti 2006 definition 2012 definition Lao PDR 2006 definition 2012 definition Yemen 2006 definition 2012 definition
EVI and its components
According to Country 2006 definition 2012 definition Somalia 2006 definition 2012 definition Uganda 2006 definition 2012 definition Cambodia 2006 definition
Because group averages may mask significantly different country results, we report in Annex D the changes in EVI between 2000 and 2011, calculated with the constant definitions 2006-2009 or 2012, by countries. Countries are ranked by decreasing order of the decline in the EVI with the 2012 design. Correlation between the changes in the two EVI is high, in terms of values and ranks, with only few outliers (e.g. Sao Tome and Principe, Burkina Faso, Haiti), roughly reinforcing the previous conclusions.
In Table 4, we select the seven countries showing the sharpest decline in the 2012 EVI (excluding Sao Tome and Principe) and present the results for EVI and its components. With few exceptions (particularly for the natural disaster 2012 index in half cases and for the exportation concentration in Djibouti and Laos), all components contribute to the drop in the EVI. Even more for these countries than for group averages, the drop is due to the shock components more than to the exposure components, which may be considered as reflecting more clearly a structural economic change. Exports instability index is the main contributor, for all countries and EVI designs, explaining 50 to 100% of the decline in the EVI.
Table 4. Changes in EVI and its components between 2000 and 2011, calculated with constant definitions 2006-2009 or 2012, for seven countries.
5.
Which EVI retrospective series better reflects structural change?
Retrospective series of EVI, set up respectively from the 2006/2009 and the 2012 definitions, have been used to assess the structural change in LDCs compared to that of other developing countries. What we want to capture is a change in the structural handicaps to development faced by LDCs. 9
For this assessment the two versions of the design, the 2006/2009 or the 2012 version, may not be equally relevant. We here consider this design issue with regards to the purpose of assessing structural change.
5.1 Which design for exposure components?
Let us first consider the exposure index and its components. The population size component (the weighting of which was reduced by half from the 2006/2009 to the 2012 design) declines progressively, particularly where population growth is higher. One may ask whether in the globalized world, the handicap (due to the smallness of the domestic market) is better reflected by the absolute size of the population (as it is presently) or by its share of world population (which could be preferable).
More importantly, the introduction of the LECZ component in the EVI formula appears to have major implications for the assessment of structural economic vulnerability over time, and between countries. The LECZ component pulls down developing countries exposure index values, with a slightly stronger impact on LDCs, which have a smaller share of population located in low elevation coastal areas, than non-LDCs. Moreover, the impact of the LECZ component on the assessment of structural economic vulnerability within the LDC group is heterogeneous. While this component increases the vulnerability in several small island and coastal LDCs, it reduces that of landlocked LDCs. This is particularly debatable for landlocked countries with large dry areas (e.g. Sahelian countries like Niger or Burkina Faso) which are vulnerable to climate change, and see their vulnerability level reduced with the new design. One way of more fairly accounting for climate change in both types of countries would be to combine the LECZ component with an index reflecting the share of population located in dry areas.
As explained elsewhere (Guillaumont 2013), the introduction of the LECZ component, which does not reflect an obstacle to economic growth (it is positively correlated with economic growth, not negatively as are the other components), but only a long term threat to sustainable development, seems too much or not enough. It may not be appropriate for the assessment of structural change through changes in EVI. In any case, the fact that it is not combined with an indicator of dry land results in an increasing bias in the assessment since the LECZ indicator is increasing in the countries concerned, whereas the (not included) share of dry lands is also increasing in the other countries concerned.
As for the other exposure components, the new 2012 EVI has some desirable properties. In so far as EVI is intended to reflect structural economic vulnerability, retrospective series should display low variability over time. In this regard, the 2012 retrospective EVI performs better than the 2006/2009 one, due to the use of a 3-year rolling average for the export concentration and agriculture share indices. The remoteness index calculated according to the 2012 formula also displays less variability over time, and could be preferable according to this criterion of stability.10 These
changes made in 2012 are improvements in the assessment of structural vulnerability across countries at a given point of time. They also give a better picture of the structural changes in the countries’ vulnerability, although they do not change the long term trend of the series.
5.2. Which design for shock components?
A major source of divergence between the 2006/2009 and the 2012 definitions of vulnerability is the natural disaster index. The Homeless index used in the 2006/2009 reviews is based on a very specific category of victims of natural disasters. The Victim index in the 2012 review uses a broader definition of victims, including people killed and requiring assistance. It is not clear which of the two indices is the more appropriate to assess the changes in structural vulnerability. While extending the scope of the index to other victims than homeless may introduce conceptual imprecision, the number of homeless after a natural disaster may not have the same meaning between countries and over time. Biases in the reporting process may arise for both indices. Another criticism may apply to the exogeneity hypothesis behind the two indices, since a country’s resilience to natural disasters, which largely depends on policy rather than structural factors, may have an impact both on the number of homeless and the number of victims. The respective advantages and disadvantages of the two indices for the assessment of structural trends have still to be explored.
Finally, for the instability indices, extending the calculation period from a 15-year time window to a 20-year time window resulted in an increased number of recorded instabilities, and a smoother trend in the changes in the instabilities. While this smoothing can be seen as an improvement in the assessment of the changes in structural vulnerability, it has the statistical disadvantage of reducing the time-coverage of retrospective series.
Briefly stated, a new retrospective series of EVI would permit a better assessment of the levels and changes in structural vulnerability in introducing the 2012 improvements in the calculation of the indices into the 2006/2009 structure of the index, or if there was a new index combining the LECZ component with a dry land component in a balanced way.
10 However, because the theoretical foundations underlying the 2006/2009 and the 2012 remoteness indices differ, which
version of the remoteness index to choose remains an open question. A FERDI working paper on the measurement of remoteness from world market will be soon produced.
6.
Concluding remarks
In this paper, we assess the changes in structural vulnerability in LDCs according to two retrospective series of EVI, based on constant definitions, those used for the 2006 and the 2012 reviews of the list of LDCs. As a point of departure, we disentangle the impacts of the change in the design of EVI on the changes in its official level. In so doing we isolate what can be seen as a real change in structural economic vulnerability between the 2006 and 2012 reviews, instead of the change in design (components, weights, methods of calculation), or of data updating.
According to both long-term retrospective series (from 1975 to 2011), structural vulnerability is markedly higher in LDCs than in non-LDCs, and as already noted from 1970 to 2004 in Guillaumont (2009a), and from 1975 to 2008 in Cariolle (2011), declined later and to a smaller extent than for non-LDCs. This means that over a long period structural change has been slower in LDCs than in non-LDCs. In other terms, LDCs face a bigger structural handicap and a bigger relative structural handicap due to their vulnerability, even if in absolute terms their structural vulnerability appears to have decreased.
The value of the index as such has no economic meaning for a country taken alone. What matters is the impact of the change in design on the relative positions of countries, and on the assessment of structural change over time, which is our main concern in this paper.
The change in the weighting of the 2012 exposure index, together with the addition of the low elevation coastal zones (LECZ) component (at the expense of population size), increases the relative value of the exposure index of several island and coastal LDCs (e.g Bangladesh), and decreases that of many of those small LDCs which have no coastal areas, or sparsely populated coastal areas (especially landlocked countries). It thus introduces a bias against the dry land countries (often landlocked). These dry landlocked countries are threatened by climate change, as much as the countries with low coastal areas. This change had serious consequences not only on the distribution of vulnerability values within the LDC group, but also on the assessment of structural change through the EVI. In particular, it leads to an underestimation of the increase in the gap between the structural vulnerability of LDCs and that of non-LDCs, since the LECZ component is increasing faster in non-LDCs, while the increase in the share of dry lands, probably faster in LDCs, is not taken into account.
In the shock index, replacing the homeless (due to natural disasters) index by the victims index had a major impact, and extending the trend calculation period of the two instabilities from 15 years to 20 years had a minor impact, on the LDCs’ values. However, this had a little impact on the average trend of the index: the trend is declining in non-LDCs in both series, while for LDCs in both series it is slightly increasing until 2004, then declining. This pattern of change may to some extent result from better registration of victims of natural disasters over time.
Finally the change in EVI in LDCs and non-LDCs from 1990 to 2011 does not significantly differ according to the two retrospective series using the 2006/2009 and the 2012 designs. In both cases
it shows a more declining trend in non-LDCs than in LDCs over time. The retrospective series with the 2006/2009 design displays more variability over time than that with the 2012 design, due to the way in which some exposure components are calculated (the 3-year average export concentration index, and the remoteness index). The trend in EVI, which is similar for the two designs for both LDCs and non-LDCs, but declining more for the non-LDCs, actually results from slightly different trends in the shock and exposure sub-indices. The difference in the changes in the EVI for LDCs and non LDCs essentially results from the differences in the shock indices. The exposure trends are similarly declining, in fact a little less for non-LDCs than for LDCs, but due to two factors which do not really reflect a relevant structural change in LDCs: a higher population growth, and (with the 2012 design) a less rapid increase of the share of population located in low elevation areas. This strengthens the diagnosis of a lower reduction in structural economic vulnerability in the LDCs.
Of course, the average changes examined in this paper hide discrepancies between LDCs and between non-LDCs. The stronger declines in the EVI of LDCs are due to a decline in the size of recurrent shocks, not to a change in their structural exposure.
References
Cariolle, J. (2011) “The Economic Vulnerability Index: 2010 Update”, Ferdi Working Paper I09
Innovative Indicators Series,. Fondation pour les études et recherches sur le développement
international, Clermont-Ferrand, France.
Cariolle, J., and M. Goujon (2014) “Measuring Macroeconomic Instability: A Critical Survey Illustrated with Export Series”, forthcoming in the Journal of Economic Surveys (published online the 9th July 2013).
Cariolle, J., and M. Goujon (2013) “A Retrospective Economic Vulnerability Index, 1990-2011: Using the 2012 UN-CDP definitions”, Ferdi Working Paper I17 Innovative Indicators Series, Fondation pour les études et recherches sur le développement international, Clermont-Ferrand, France.
Cariolle J. and P.Guillaumont (2011), “A retrospective Economic Vulnerability Index: 2010 update”
Ferdi Policy Brief /17, Fondation pour les études et recherches sur le développement international,
Clermont-Ferrand, France.
Guillaumont, P. Caught in a trap: Identifying the Least Developed Countries. Economica, 2009a.
Guillaumont, P. (2009b). “An Economic Vulnerability Index: Its design and Use for International Development Policy”. Oxford Development Studies, 37(3), 193-228.
Guillaumont (2013) Measuring Structural Vulnerability to Allocate Development Assistance and Adaptation Resources, Ferdi Working Paper 68, Fondation pour les études et recherches sur le développement international, Clermont-Ferrand, France.
United Nations, Handbook on the Least Developed Country Category: Inclusion, Graduation and
Special Support Measures, United Nations Committee for Policy Development and Department of
Annex A. Breakdown of the sources of variations of the EVI between successive
triennial reviews: methodological framework
EVI is designed by V EVI components by Ci
EVI weights of components wi
So that V= ∑ Ci . wi
Each value of V and Ci refers either to a year t or a year 0, and is measured according to the
definition of the EVI and its components used in year t or 0. So that
Citt is the component i in year t, according to t definition
Cit0 is the component i in year t, according to the 0 definition
Ci00 is the component i in year 0, according to the 0 definition
Ci0t is the component i in year 0, according to the t definition
Similarly,
Vtt is EVI in t definition of t = ∑Citt . wit
Vt0 is EVI in t definition of0 = ∑Cit0 . wi0
V00 is EVI in 0 definition of0 = ∑Ci00 . wi0
V0t is EVI in 0 definition of t = ∑Ci0t . wit
As produced by the CDP Secretariat, the official values of EVI at the years tand in 0 the reviews of the list of LDCs are Vtt and V00 (t in the application being the year of the last review 2012, and 0 the
year of a previous review, used as a base where another definition of EVI was retained, for instance 2006 or 2009). We can write:
ΔV = Vtt - V00 = ∑Citt . wit - ∑Ci00 . wi0
= ∑Citt . wit - ∑Citt . wi0 + ∑Citt . wi0 - ∑Cit0 . wi0 + ∑Cit0 . wi0 - ∑Ci00 . wi0
= ∑Citt . Δwi + ∑(Citt-Cit0) . wi0 + ∑ΔCi0 . wi0
The change in the observed value of EVI can thus be broken down into three parts:
Q= ∑Citt .. Δwi : the impact of the change in the weights given to each component
(including the impact of a new component)
R= ∑(Citt - Cit0) . wi0 : the impact of the change in the measurement of each component
S= ∑ΔCi0 . wi0 : the impact of the change in the value of each component measured in an
unchanged way.
(Q + R) represents the impact of the change in the definition of the index (either through the weighting or the measurement of components).
Refined breakdown
Let us define:C'itt : the component iin year t, according to the t Ferdi definition, which may slightly differ from
the t review definition (due to updated data and minor refinements)
C'i00 : the component i in year 0, according to the 0 Ferdi definition, which may slightly differ from
the 0 review definition (with updated data). accordingly
V'tt is the Ferdi “retrospective” or virtual EVI in t
V'00 is the Ferdi “retrospective” or virtual EVI in 0
So that R the impact of the change in the measurement of the components can be broken down as:
R = ∑(Citt - Cit0) . wit
= ∑[(Citt - C'itt) + (C'itt - C'it0) + (C'it0 - Cit0)] . wit
= R1 + R2
with
R1 = ∑ (C'itt - C'it0) . wit
Annex B. The remoteness index in the 2006/2009 and 2012 reviews: some
mathematical insights.
In the 2012 review, the remoteness component is the trade-weighted minimum average distance to reach 50% of the world markets. For each country and each year, partner countries are ranked by their physical distances. Then the trade-weighted average distance from the nearest countries that make up 50% of the world market is estimated:
Min Dij ∗XX
∈
with J = j t. q. Xj
∈
≥ X/2 .
Wirh Dij the bilateral distance between country i and trade partner j, Xj the trade (imports + exports) of partner j, X total world trade (imports + exports). The market share for each country is calculated using the 3-year (t-2, t) average trade of each country:
• 3-year Avg. Trading Volume = 0.5 * (3-year Avg. Imports + 3-year avg. Exports)
• Market share of country A = Avg. 3-year trading volume of country A/ Avg. 3-year World Volume
The distance is then normalized: Distance= 100*[ln(DA) - ln(Dmin)]/[ln(Dmax) – ln(Dmin)] Distance is then adjusted for the additional handicap of landlocked countries:
Remoteness = [0,85*Distance + 0,15*L]
With L a variable indicating whether the country is landlocked (L=100) or not (L=0).
In the 2006/2009 review, trade partners are selected and ranked according to the geographical distance weighted by their contribution to total world trade. Then the remoteness indicator is the sum of geographical distances between the country and its trade partner weighted by their share in total world trade, until the threshold of 50% of total world trade is reached. The following formula is applied:
∑ Dij ∗∈ with J = j t. q. ∑ Xj∈ ≥ and ∀k ∈ J, j ∈ J; Dij ∗ $1 − ' ≤ Dik ∗ $1 − )'*.
The calculation of the indicator consists of the following steps:
1. The 2012 review ranks countries according to their (non-corrected) geographical distance, the 2006/2009 review ranks countries according to their distance weighted by their share in total trade DW, = D, ∗ $1 − ' ;
2. The first k partners for which cumulated trade reaches 50% of total world trade are retained;
3. Then the distance from these k trade partners weighted by their trade share is summed. As in the 2012 review, Distance is finally adjusted for the additional handicap of landlocked countries:
Remoteness = [0,85*Distance + 0,15*L]
Annex C. Breakdown of the change in EVI between the 2006 and 2012 CDP reviews
for Central African Republic (CAR) and Bangladesh, using 2012 definition as
reference
Explaining the change in CAR A. Official EVI (CDP Reviews)
A.1. EVI 2006 review 50,80
A.2. EVI 2012 review 35,65
Total variation between 2006 and 2012 reviews: A.2 - A.1 -15,14
B. Retrospective EVI values*, constant definitions (2006/2009 definitions)
B.1. Retro EVI for the year 2004 32.88
B.2. Retro EVI for the year 2010 31.16
Variation explained by actual change in components, index design unchanged: B.2 - B.1 -1.71 C. Breakdown of EVI variation between 2006 and 2012
C.1. Total variation 2006-2012: A.1 - A.2 = C.2 + C.3 + C.4 -15,14
C.2. Variation explained by the change in the weighting of components -6.24 C.3. Variation explained by the change in the measurement of components = C.3.1 + C.3.2 -7.19
C.3.1. change in component calculation -2.97
C.3.2. data updating -4.22
C.4. Variation explained by real change in components, index design unchanged: B.1 -
B.2 -1.71
Explaining the change in Bangladesh A. Official EVI (CDP Reviews)
A’.1. EVI 2006 review 25,78
A’.2. EVI 2012 review 32,41
Total variation 2006-2012: A’.1 – A’.2 6,63
B. Retrospective EVI values*, constant definitions (2006/2009 definitions)
B’.1. Retro EVI 2004 34.96
B’.2. Retro EVI 2010 31.99
Variation explained by real change in components, index design unchanged: B’.1 – B’.2 -2.97 C. Breakdown of EVI variation between 2006 and 2012
C’.1. Total variation 2006-2012: A’.1 – A’.2 = C’.2 + C’.3 + C’.4 6,63
C’.2. Variation explained by the change in the weighting of components 0.00 C’.3. Variation explained by the change in the measurement of components = C.3.1 + C.3.2 9.60
C’.3.1. change in component calculation 11.48
C’.3.2. data updating -1,88
C’.4. Variation explained by real change in components, index design unchanged: B’.1 –