HAL Id: halshs-02407125
https://halshs.archives-ouvertes.fr/halshs-02407125
Submitted on 12 Dec 2019
HAL is a multi-disciplinary open access archive for the deposit and dissemination of sci-entific research documents, whether they are pub-lished or not. The documents may come from teaching and research institutions in France or abroad, or from public or private research centers.
L’archive ouverte pluridisciplinaire HAL, est destinée au dépôt et à la diffusion de documents scientifiques de niveau recherche, publiés ou non, émanant des établissements d’enseignement et de recherche français ou étrangers, des laboratoires publics ou privés.
What motivates CAC 40 companies to disclose
information on climate-related financial risks?
Jeanne Amar, Samira Demaria, Sandra Rigot
To cite this version:
Jeanne Amar, Samira Demaria, Sandra Rigot. What motivates CAC 40 companies to disclose infor-mation on climate-related financial risks?. Infiniti9, Jun 2019, Glasgow, United Kingdom. �halshs-02407125�
What motivates CAC 40 companies to disclose
information on climate-related financial risks?
J. Amar*, S. Demaria†, S. Rigot‡
This version: January 2019
Abstract
In this article, we examine the determinants of CAC 40 companies' compliance with the recommendations of the FSB Task Force on Climate Financial Reporting (TCFD). We use in this analysis a new index measuring the level of compliance of firms with TCFD’s recommendations, the Comprehensive Compliance Index (CCI). Using a panel Tobit model, we find that environmentally friendly companies are more compliant with TCFD's recommendations, especially when operating in an industry with high environmental stakes. In addition, media environmental exposure increases the level of compliance of firms with TCFD’s recommendations. We also find a strong influence of ownership structure on the CCI as a high shareholder concentration and a high proportion of foreign shareholders decrease the level of compliance with TCFD’s recommendations. Overall, our results shed new light on the company's voluntary environmental reporting for regulators seeking to improve financial transparency in relation with climate risks.
JEL Classification : G38; Q51; M41; Q56
Keywords : Environmental disclosure; TCFD; Compliance; Climate-related financial risk; Comprehensive Compliance Index
Funding: This work was supported by ANC (The French Authority for Accounting Standards) and the Chair « Energie et Prospérité, Financements et Evaluations de la Transition Energétique » de la Fondation du Risque.
Acknowledgements: The authors would like to thank Sylvain Borie and Alain Grandjean for their advice
* University Côte d’Azur, Gredeg UMR 7321. jeanne.amar@univ-cotedazur.fr † University Côte d’Azur, Gredeg UMR 7321. samira.demaria@univ-cotedazur.fr ‡ University Paris 13, CEPN UMR 7234. sandra.rigot@univ-paris13.fr
Introduction
The COP 21 (2015) was an historic moment when 175 countries committed to complying with the Paris Agreement to maintain the global temperature increase below to 2°C by 2100. On this occasion, the Financial Stability Board (FSB) launched an international initiative to introduce the Task Force on Climate-related Financial Disclosures (TCFD). The aim of this working group, made up with account users (e.g. analysts), account preparers, and international experts from different sectors, was to make recommendations about financial transparency to help companies identify and disclose information to investors on Climate Risks and Opportunities (CROs). These recommendations specify the elements of environmental reporting expected in the annual reports of all types of companies with regard to governance, strategy, risk management and environmental metrics. The aim is to improve the information provided by companies on how they integrate CROs in these four areas (see Section 1 below). These disclosure recommendations must be incorporated into the efficient markets theory framework via the market discipline mechanism. Indeed, to function efficiently through the low carbon transition and to encourage trust, capital markets require quality and timely data. In other words, firms and investors need better information to make informed decisions about the impact of climate risks on their business and future capital investments.
After receiving support from the European Union Technical Expert Group on Sustainable Finance (2019) for its integration into the non-financial reporting directive scheduled for June 2019 (21014/95 EU), the TCFD grid appears to have become a world reference (but not binding) for financial transparency in relation to climate risks. At the 2017 One Planet Summit, 237 companies, including twenty CAC 40 firms (with a total market capitalization of $6.3 trillion and assets under management of $81.7 trillion) pledged to follow TCFD’s recommendations (Henze, 2017). This growing interest requires a better understanding of the firms’ reporting practices with regard to climate risk. The paper of Demaria and Rigot (2018) shows that French groups have already started to integrate TCFD's recommendations into their annual reports. The authors show a clear improvement in the TCFD compliance score (Comprehensive Compliance Index or CCI) over the 2015-2017 period. As a follow-up to this paper, our article aims to identify the determinants of this increase in the CCI. Even if the literature has already investigated the determinants of voluntary environmental disclosures (Reverte 2009; Clarkson et al. 2011; Latridis 2013), TCFD’s recommendations changed the situation and the determinants of firm’s level of compliance with this new grid haven’t been
identified yet. This paper aims to fill this gap in the literature by identifying the factors that explain the more or less good disclosure of information in accordance with TCFD’s recommendations.
Using an original database including the CCI of CAC 40 companies between 2015 and 2017, financial, environmental and corporate governance variables, we use a Tobit panel model to identify the variables that influence the level of compliance of these companies with TCFD's recommendations.
Anticipating on our results, we find that environmentally friendly companies are more compliant with TCFD's recommendations, especially when operating in an industry with high environmental stakes. In addition, media environmental exposure increases the level of compliance of firms with TCFD’s recommendations. We also find a strong influence of ownership structure on the CCI as a high shareholder concentration and a high proportion of foreign shareholders decrease the level of compliance with TCFD’s recommendations. When we analyze separately high and low stake sectors, our results reveal significant differences in the determinants of compliance with TCFD's recommendations. Firms with a good financial performance are more compliant when they operates in a low stake sector while the inverse relationship is found for companies operating in high stake sectors. Finally, when operating in high stake sectors, more polluting companies tend to be less compliant with TCFD’s recommendations.
This article is in line with previous research on the voluntary disclosure of environmental information. It sheds new light on the subject by studying specifically the TCFD's recommendation grid, which is on the way to becoming the European reference in non-financial information reporting. Our study confirms, on the one hand, that financial performance has no influence on the level of environmental disclosure of companies, and on the other hand, that the level of disclosure is explained by the firm's governance system as well as its desire to legitimize its activities. The originality of this study is mainly based on the new measurement of the level of compliance with TCFD’s recommendations (CCI index).
The remaining of the paper is structured as follow: Section 1 details TCFD’s recommendations and its added value, Section 2 reviews the academic literature on environmental disclosures and introduces the our empirical hypothesis, Section 3 provides details on our data. Section 4 presents the methodology and Section 5 reports our empirical findings.
1 TCFD’s recommendations
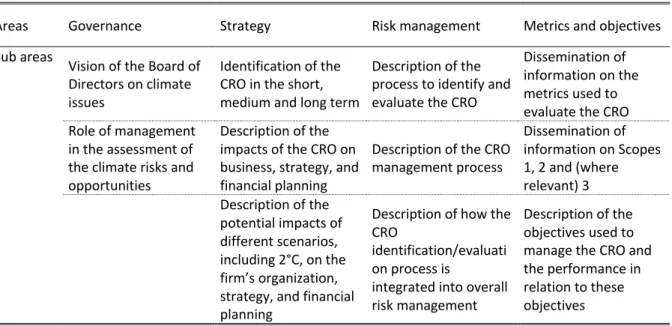
The 2007-2008 financial crisis was an important reminder of the repercussions that weak corporate governance and risk management practices can have on asset values. This resulted in increased demand for transparency from organizations on their governance structures, strategies and risk management practices. Without the right information, investors and others may incorrectly price or value assets, leading to a misallocation of capital. Hence the objective of the TCFD is to develop voluntary and consistent climate-related financial risk disclosures for use by companies to provide information to investors, lenders, insurers and other stakeholders. The Task Force consider the physical, liability and transition risks associated with climate change and what constitutes effective financial disclosures across industries. In June 2017, the TCFD published a final report that established recommendations for disclosing clear, comparable and consistent information about CROs. The recommendations take the form of a grid of themes for which companies may provide information on their practices in terms of governance, strategy, risk management and environmental indicators.4 Details on the areas and
sub-areas of the TCFD’s grid are reported in Table 1.
Table 1 - Areas and sub-areas of the TCFD’s recommendations grid
Areas Governance Strategy Risk management Metrics and objectives Sub areas Vision of the Board of
Directors on climate issues
Identification of the CRO in the short, medium and long term
Description of the process to identify and evaluate the CRO
Dissemination of information on the metrics used to evaluate the CRO Role of management
in the assessment of the climate risks and opportunities
Description of the impacts of the CRO on business, strategy, and financial planning
Description of the CRO management process Dissemination of information on Scopes 1, 2 and (where relevant) 3 Description of the potential impacts of different scenarios, including 2°C, on the firm’s organization, strategy, and financial planning
Description of how the CRO
identification/evaluati on process is
integrated into overall risk management
Description of the objectives used to manage the CRO and the performance in relation to these objectives
Source : TCFD
The TCFD reference system has several benefits. First, it attempts to link financial and non-financial information by encouraging companies to present the non-financial implications of CROs on their business and financing plans in financial documents. Second, it adopts a
looking approach by asking companies to disclose, not only their past performance, but also what they plan to do to deal with the CROs. Third, it requires information on the resilience of the companies’ business in relation to low carbon scenarios, including 2°. Fourth, it emphasizes the climate risks but also the climate opportunities (in comparison with the European directive on non-financial information). And finally, it is an international initiative (and not a state initiative) better able to promote the “level playing field”.
2 Theoretical background and empirical hypothesis
Legitimacy theory
This research is in the line with the literature studying voluntary environmental disclosures that are based on the legitimacy theory (Deegan et al. 2002; O’Donovan 2002; Cormier et al. 2005; Hummel and Schlick 2016; Nègre et al. 2017; Russo-Spena et al. 2018). The main concept behind this theory is defined by Suchman (1995) as “a generalised perception or assumption
that the actions of an entity are desirable, proper or appropriate within some socially-constructed system of norms, values, beliefs and definitions. In order to assert their legitimacy, companies must act within the limits that society identifies as socially acceptable”. The
legitimacy theory makes it possible to understand companies’ practices by analysing managers’ strategic choices to meet society's expectations (Deegan et al. 2002). This leads O’Donovan (2002) to estimate that legitimacy theory posits that “the greater the likelihood of adverse shifts
in the social perceptions of how an organisation is acting, the greater the desirability on the part of the organisation to attempt to manage these shifts”. This point of view is explained by
the fact that the various stakeholders perceive the legitimate organization not only as more worthy, but also as more meaningful, more predictable and more trustworthy (Suchman 1995). There would therefore be a kind of social contract established between organizations and society. According to Shocker and Sethi (1973), all organizations are linked to society by a social contract (expressed or implied), whereby the organization’s survival and growth are based on first, the delivery of some socially desirable ends to society in general, and second by the distribution of economic, social or political benefits to groups from which it derives its power. Therefore, organizational legitimacy and social contract compliance go hand in hand, and a breach of the contract may lead to a perception by society that the organization is not legitimate (Nègre et al. 2017).
With regard to environmental information, Depoers and Jérôme (2017) consider that legitimacy theory places organizations within a socio-political framework and environmental disclosure is a means for managers to establish and maintain a firm's legitimacy. Companies can manage their legitimacy by increasing the volume of information, using narrative and positive language, or avoiding alarmist information (Albertini 2014). In this perspective, companies are required to disclose environmental information according to the image they want to project to the market. If environmental legitimacy is not a priority, a company may not disclose environmental information (Larrinaga et al. 2002; Chelli et al. 2014; Depoers and Jérôme 2017). In other words, legitimacy theory suggests that particularly poorly performing companies use sustainability disclosure as a legitimation tactic to influence public perceptions regarding their sustainability performance (O’Donovan 2002; Deegan et al. 2002; Cho and Patten 2007; Hassan 2018). In the same sense Cho and Patten (2007) show that it is because disclosure is used as a tool to reduce exposures to social and political pressures that worse environmental performers are expected to make more extensive environmental disclosures. It should be noted, however, that the inverse relationship is also identified by several studies. Clarkson et al. (2008) find a positive relation between environmental performance and environmental disclosure because better performers have an incentive to signal this to potential users of the information. In the same way Latridis (2013) show that companies that display smaller amounts of hazardous waste and take on initiatives to reduce, reuse, substitute or phase out toxic chemicals or substances exhibit higher environmental disclosure scores. Hummel and Schlick (2016) specifically assert that companies with high environmental performance will disclose good-quality information (accurate and quantified), while those with poor environmental performance, poor-quality information (fuzzy, descriptive and unquantified). Another approach is based on the study of media exposure of firms. According to the theory of legitimacy, managers divulgate environmental information to manage pressures from their environment (Depoers and Jérôme 2017). Previous research in corporate environmental reporting has focused on the effect of media exposure on environmental disclosures and find that higher public media coverage of environmental issues puts public pressure on firms to increase environmental disclosures (Aerts and Cormier 2009). In short, environmental disclosures are often linked to legitimation intentions either to compensate for poor environmental performance or to promote virtuous practices. With regard to the theory of legitimacy and prior work, we are led to make the following two hypothesis:
H1a - Firms with high environmental performance have a higher level of compliance with TCFD’s recommendations.
H1b – Firms that are highly exposed to environmental media exposure comply more closely with TCFD's recommendations.
Literature on voluntary disclosure of environmental information
There is an abundant literature studying voluntary disclosure of environmental information. Overall, results reveal certain factors that strongly encourages companies to voluntarily disclose information on their environmental performance. These are firm-level characteristics related to its sector, financial performance and governance
Sectoral determinant
Empirical research investigating the determinants of voluntary disclosures rely on the signal theory. It can indeed be argued that within the same sector, companies are required to align with each other on their disclosure practices, as any deviation will be considered bad news by the market. However, it appears that in the specific case of voluntary environmental disclosures, sectoral variables have a low explanatory power. Previous studies have indeed shown that belonging to a sector considered sensitive or polluting is not a systematic factor explaining the quality of environmental communication (Delbard 2008; Dejean and Martinez 2009).
On the contrary, many studies find a link between the sector and the level of voluntary environmental disclosure, particularly for sensitive sectors. This is the case for samples from North American firms (Alnajjar 2000; Li and Bewley 2000) , as well as European samples (Cormier and Magnan 2003; Brammer and Pavelin 2008; Depoers 2010; Depoers and Jérôme 2017). These papers shows that the level of disclosure of environmental information, or more specifically GHGs or environmental expenditures, is affected by a sectoral effect. Thus, firms in so-called sensitive sectors tend to disseminate more information. According to Fifka (2013), based on a study of 200 articles on the explanation of voluntary disclosure of environmental information, the operating sector is a highly explanatory variable for the level of environmental reporting.
As firms operating in high stake sectors have a high sensitivity to potential environmental legislation and given the recent trend towards a stronger regulation of environmental performance reporting, we make the following hypothesis:
H2 - Firms in a sector with a high environmental stake will have a higher level of compliance with TCFD’s recommendations
Determinants related to the firm's financial characteristics
The use of financial variables to explain voluntary disclosure of environmental information is based on the idea that it reduces the informational asymmetry between managers and investors (Guidry and Patten 2012). However, it must be noted that previous empirical research leads to diverging results.
Thus Chung and Cho (2018) underline that recent work concludes either that there is no relationship between CSR information and financial performance, or that the relationship can be either positive or negative. On a French sample for the year 2006, Dejean and Martinez (2009) fails to conclude that the level (volume and type of information) of environmental information disclosed is influenced by economic profitability (not significant variable). Similarly, Sen et al. (2011) and Qiu et al. (2016), on Indian and British samples, find no relationship between environmental information and firm profitability. Interestingly, Guidry and Patten (2012) research studies 13 articles on the links between voluntary disclosure of environmental information and financial variables (debt ratio, return on investment, stock market returns, Tobin's Q, and firm size). The authors conclude that there is no systematic relationship between financial variables and the differences in environmental disclosure between the firms studied. This is confirmed by the article by Hussain et al. (2018) according to which environmental performance indicators are not linked to financial performance variables for a sample of American companies reporting GRI between 2007 and 2011.
Several variables are generally used to measure financial performance. While the size of the firm seems to be a systematically chosen and overwhelmingly significant control measure (Fifka 2013), the results concerning the other variables are contradictory. Concerning the indebtedness of firms, several studies identify a significant and negative relationship, i.e. the more indebted the firm is, the less it will disclose environmental information (Aerts et al. 2008; Sen et al. 2011). The rationale behind the negative relationship can be that companies with high leverage may have closer relationships with their creditors and may use other ways to disclose information rather than disclosing environmental information in the annual reports (Purushothaman et al. 2000). While other studies show a significant positive relationship on disclosure (Brammer and Pavelin 2008; Hummel and Schlick 2016), assuming that increased disclosure would legitimize highly indebted firms. The link between financial performance (measured by ROE-ROA or Tobin's Q) and voluntary disclosure is also the subject of conflicting results. If several studies show a significant and positive relationship, i.e. a successful company will have a better level of disclosure (Latridis 2013). Others show that low profitability can lead to increased disclosure in order to legitimize the firm's action (Villiers and
van Staden 2011). In addition, this variable is not significant in many models (Aerts and Cormier 2009; Sen et al. 2011).
Considering the diversity of results from the previous literature, we ground our third hypothesis on the theory. According to the signaling theory, well-performing companies tend to make voluntary disclosures more easily, since it is an easy way to differentiate themselves from others in the industry. On the contrary, if the information to be disclosed is of a negative nature, increasing environmental disclosure can be costly for a company. The relative size of these costs and the ability to bear them are influenced by the company's financial situation. Indeed, a company with poor financial performance would be less able to resist pressure of stakeholders. Conversely, a financially successful company that discloses similar information will have the means to better resist stakeholder pressure and resolve the environmental problem more quickly. Thus, a financially successful company can voluntarily engage in disclosure despite the costs involved, as this would increase its credibility with investors (Hughes (1986) and Scott (1994)).
H3 - The financial performance of firms impacts the level of compliance with TCFD’s recommendations.
Determinants related to the firm's governance
Another avenue of investigation is the effects of the governance model on the environmental disclosure of companies and more specifically of firm’s ownership structure. According to the agency theory, the risk of conflict of interest between management and shareholders is higher in large companies with dispersed share ownership than in companies with reduced share ownership. Indeed, investors with a small percentage of shares have less power to influence management decisions and have limited access to company’s information. They are therefore more likely to lobby for voluntary disclosures in order to better monitor the management while large shareholders have internal access to information and are not encouraged to request better environmental information.
Previous empirical studies show a strong influence of ownership structure on the level of information disclosed. Depoers and Jérôme (2017) show that French companies with a high share of socially responsible ownership tend to report on environmental spending. Roy and Ghosh (2017) identify, out of a sample of 29 Indian firms (over two successive periods: 2008-2009 and 2012-2013), a significant relationship between shareholding concentration and a low disclosure score. On the contrary, firms with diversified shareholdings have a better strategy for disclosing environmental information. This study confirms that of Brammer and Pavelin
(2008) showing that the dispersion of ownership leads to a higher level of disclosure but not necessarily of better quality.
Regarding the theory as well as previous empirical findings, we assume that the more "open/diversified" the governance is, the more likely firms will be to disclose environmental information which leads to the fourth hypothesis:
H4 - Firms with "open/diversified" governance will have a higher level of compliance with TCFD’s recommendations.
3 Data and descriptive analysis
The Comprehensive Compliance Index (CCI)
In this paper, we use the Comprehensive Compliance Index (CCI) introduced by Demaria and Rigot (2018). The authors use content analysis to determine the compliance of CAC 40 companies with TCFD’s recommendations. Their methodology consist in the creation of a specific database indicating whether or not the information required by TCFD’s recommendations is available in the four areas (i.e. governance, strategy, risk management, and metrics & targets) and in their sub-areas. They identify 8 questions for governance, 13 for strategy, 7 for risk management and 10 for metrics & targets and assign each question a value of 1 point. The overall compliance index (i.e. the CCI) ranges from 1 to 38.
The indices have been standardized to make them comparable and easier to use in time series analysis. For each index/sub-index we applied the following transformation:
!"#$% '(# =*+,-.
/0. × 10
where !"#$% '(# is the standardized index, !"#$% is the value of the index in the original database and 45% is the maximum value of the original index.
The CCI as well as the Governance Index, the Strategy Index, the Risk Index and the Metrics Index range from 0 to 10. The higher the indices, the more compliant the firms.
We chose here to study the French companies of the CAC 40. This choice is explained by the fact that France is regarded as a country with a considerable number of regulations regarding
mandatory environmental disclosures and that The French government supports the implementation of TCFD’s recommendations at European and G20 level. We focused more specifically on the CAC 40 companies, which are those that are subject to the most stringent environmental legislation: the NER Act and the Energy Transition Act. In addition, these companies sometimes go further than the regulations by disclosing voluntary information because they may be subject to pressure from stakeholders (NGOs, analysts, the general public, etc.) regarding the dissemination of environmental information.
Our sample includes the CCI and the four sub-indices for 395 firms over the period 2015-2017.
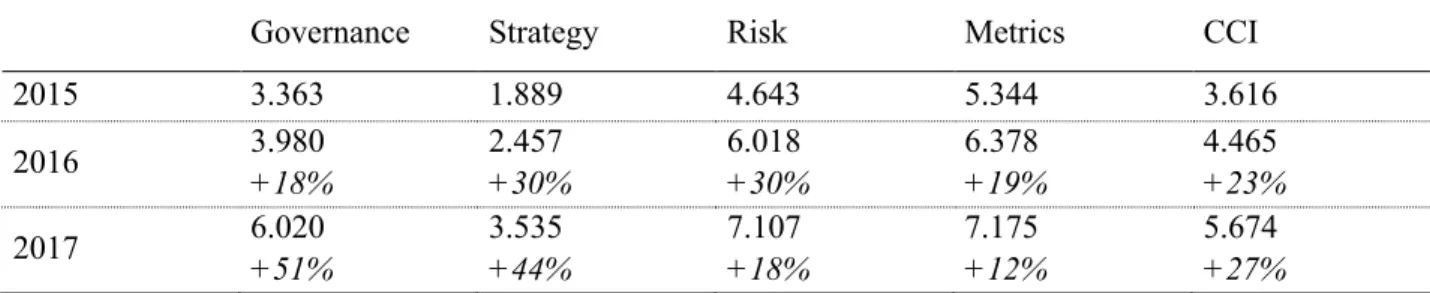
Table 2 - Evolution of the mean of the CCI and its sub-indices
This table provides the annual evolution of the mean of the CCI and its sub-indices. For years 2016 and 2017, the second lines give the rate of change compared to the previous year.
Governance Strategy Risk Metrics CCI
2015 3.363 1.889 4.643 5.344 3.616 2016 3.980 +18% 2.457 +30% 6.018 +30% 6.378 +19% 4.465 +23% 2017 6.020 +51% 3.535 +44% 7.107 +18% 7.175 +12% 5.674 +27%
Table 2 gives the evolution mean of these indices over time. This table shows a strong increase of the CCI between 2015 and 2017 (more than 20% per year). Between 2015 and 2016, this increase is driven by a 30% increase in the Strategy and Risk indices. Between 2016 and 2017, increase driven by an increase in the GOVERNANCE and STRATEGY indices, respectively by 51% and 44%. The slight increase in the Metrics Index is explained by an already high level of this index in 2015 (higher than 5). From 2016 onwards, the focus is placed on the two indices that are still below the average (Governance and Risk). Despite a significant increase in the STRATEGY index over the period, it remains very low (3.535).
Table 3 - Repartition of firms having a CCI < 2, < 5 and > 7
This table provides the annual evolution of the proportion of firms having a CCI lower than 2, lower than 5 and higher than 7
CCI < 2 CCI < 5 CCI > 7
2015 20% 73% 0%
2016 18% 60% 13%
2017 8% 33% 35%
5 The Technip company is excluded from the sample because following its merger with FMC in 2016, it did not
publish a report for the said year and then in 2017 the document published does not take the form of an annual report but only of a financial statement in British format.
Table 3 provides the annual evolution of the proportion of firms having a CCI lower than 2, lower than 5 and higher than 7. In 2017, only 8% of companies have an overall index below 2 compared to 20% in 2015 (3 companies in 2017 compared to 8 in 2015). These are Arcelor (1.25), and Vivendi (1.25). In 2017, 35% of companies (14 companies) have an index higher than 7 compared to 0 in 2015, which shows a strong willingness of companies to move towards a high level of compliances with TCFD’s recommendations.
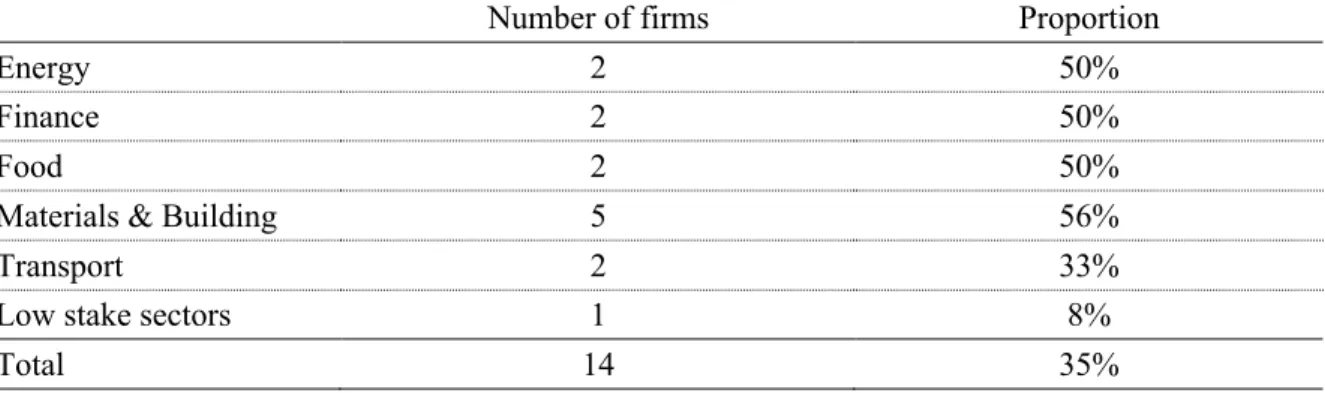
Table 4 - Sectorial repartition of firms displaying a CCI > 7 in 2017
Table 4 gives the sectorial repartition of firms displaying a CCI higher than 7 in 2017. We consider five high stake sectors: i) energy; ii) finance; iii) food; iv) materials and building and v) transports. In 2017, the highest concentration of firms with a CCI higher than 7 is in the materials and building sector. Moreover, more than 50% of companies operating in a high-stake sector have an index higher than 7, with the exception of the transport sector (33%). Firms low-stake sectors still have low indices, with only 8% of companies in these sectors having a CCI higher than 7 in 2017.
Table 5 - Descriptive statistics of the CCI of companies in low stake sectors in 2017
This table provides the mean, median, minimum and maximum of the CCI of firms operating in low stake sectors in 2017
Mean 4.96
Median 5.03
Min 1.25
Max 7.53
Table 5 displays descriptive statistics of the CCI in 2017 of firms operating in low stake sectors. These companies have an average index in 2017 that is significantly lower than the overall average (4.962 compared to 5.674 for all companies). Half of these companies have a CCI index lower than 5.033 in 2017 (6.299 for all companies)
This table provides the annual evolution of the proportion of firms having a CCI lower than 2, lower than 5 and higher than 7
Number of firms Proportion
Energy 2 50%
Finance 2 50%
Food 2 50%
Materials & Building 5 56%
Transport 2 33%
Low stake sectors 1 8%
Other data
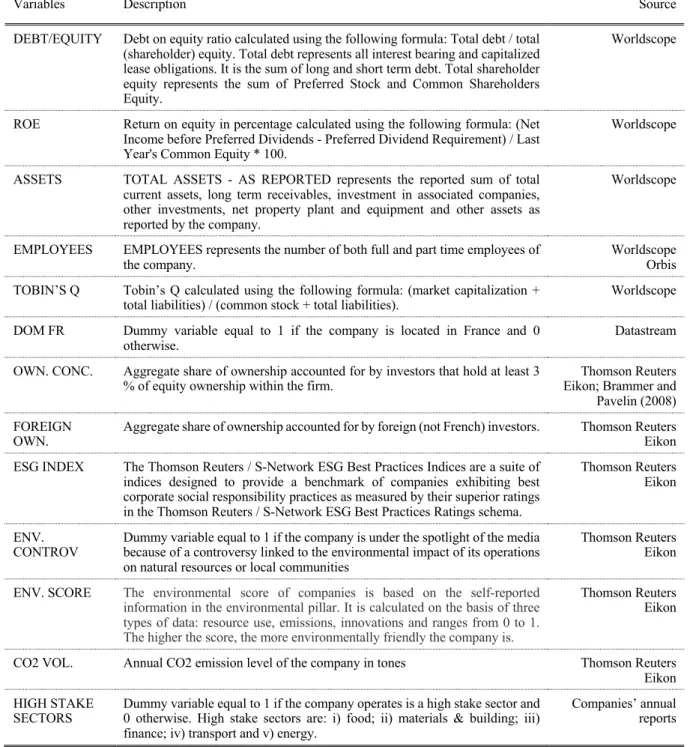
We employ a number of variables that should potentially explain the level of compliance of CAC 40 firms with TCFD’s recommendations. The description of the variables is reported in Table 6. These variables relate i) the firm’s environmental performance and environmental media exposure; ii) the firm’s sector ; iii) the firm’s financial performance and iv) the firm’s governance. Details on variables construction and sources are presented in Table 6.
The firm’s environmental performance and environmental media exposure
In order to test whether firms with a high environmental performance have a higher level of compliance with TCFD’s recommendations (H1a), we include in our analysis three variables indicating the environmental performance of the company. First, the Thomson Reuters environmental score (ENV. SCORE) of each firm. This score is based on the self-reported information in the environmental pillar. It is calculated on the basis of three types of data: resource use, emissions, innovations and ranges from 0 to 1. Second, a dummy variable that indicates if the firm is part of the Thomson Reuters / S-Network ESG Best Practices Indices (ESG INDEX). And third the level of CO2 emissions of the company (CO2 VOL.). In addition, in order to test if media exposure related to environmental issues encourage firms to increase their level of environmental disclosure (H1b), we include a dummy variable equal to 1 if the company is under the spotlight of the media because of a controversy linked to the environmental impact of its operations on natural resources or local communities (ENV. CONTROV.) The firm’s sector As H2 indicates that the company's sector influences its level of compliance with TCFD's recommendations, we include in our analysis a dummy variable that indicates if the company operate in a high stake sectors (HIGH STAKE SECTORS). According to the TCFD classifications, high stake sectors are: i) Food ; ii) Energy ; iii) Transports ; iv) Materials and Building and v) Finance.
Table 6 - Descriptive of the variables
The firm’s financial performance
In order to test whether the financial performance of the firm influences its level of compliance with TCFD’s recommendations (H3), we include three measures of financial performance: the ratio of the firm’s total debt on its total equity (DEBT/EQUITY), its return on equity (ROE) and its Tobin’s Q.
Variables Description Source
DEBT/EQUITY Debt on equity ratio calculated using the following formula: Total debt / total (shareholder) equity. Total debt represents all interest bearing and capitalized lease obligations. It is the sum of long and short term debt. Total shareholder equity represents the sum of Preferred Stock and Common Shareholders Equity.
Worldscope
ROE Return on equity in percentage calculated using the following formula: (Net Income before Preferred Dividends - Preferred Dividend Requirement) / Last Year's Common Equity * 100.
Worldscope
ASSETS TOTAL ASSETS - AS REPORTED represents the reported sum of total current assets, long term receivables, investment in associated companies, other investments, net property plant and equipment and other assets as reported by the company.
Worldscope
EMPLOYEES EMPLOYEES represents the number of both full and part time employees of the company.
Worldscope Orbis TOBIN’S Q Tobin’s Q calculated using the following formula: (market capitalization +
total liabilities) / (common stock + total liabilities). Worldscope DOM FR Dummy variable equal to 1 if the company is located in France and 0
otherwise.
Datastream OWN. CONC. Aggregate share of ownership accounted for by investors that hold at least 3
% of equity ownership within the firm. Eikon; Brammer and Thomson Reuters Pavelin (2008) FOREIGN
OWN. Aggregate share of ownership accounted for by foreign (not French) investors. Thomson Reuters Eikon ESG INDEX The Thomson Reuters / S-Network ESG Best Practices Indices are a suite of
indices designed to provide a benchmark of companies exhibiting best corporate social responsibility practices as measured by their superior ratings in the Thomson Reuters / S-Network ESG Best Practices Ratings schema.
Thomson Reuters Eikon
ENV.
CONTROV Dummy variable equal to 1 if the company is under the spotlight of the media because of a controversy linked to the environmental impact of its operations on natural resources or local communities
Thomson Reuters Eikon ENV. SCORE The environmental score of companies is based on the self-reported
information in the environmental pillar. It is calculated on the basis of three types of data: resource use, emissions, innovations and ranges from 0 to 1. The higher the score, the more environmentally friendly the company is.
Thomson Reuters Eikon
CO2 VOL. Annual CO2 emission level of the company in tones Thomson Reuters Eikon HIGH STAKE
SECTORS Dummy variable equal to 1 if the company operates is a high stake sector and 0 otherwise. High stake sectors are: i) food; ii) materials & building; iii) finance; iv) transport and v) energy.
Companies’ annual reports
The governance of the firm
As we want to test if firms with open/diversified governance are more compliant with TCFD’s recommendations (H4), we include the ownership concentration of the firm (OWN. CON.) and the aggregate share of ownership accounted for by foreign (not french) investors (FOREIGN OWN.) in our analysis.
Additional controls
We finally include two variables to control for the size of the firm: the total assets of the firm (ASSETS) and (EMPLOYEES) that represents the number of employees of the company. We also include a dummy variable that indicates if the company is located in France (DOM FR).
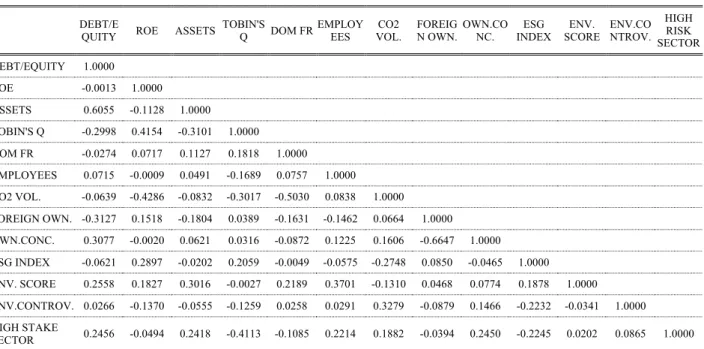
The correlation matrix of these variables is provided in Table 7.
Table 7 - Correlation matrix
The coefficients indicate that largest firms are the most indebted (0.6055) and that firms with concentrated share ownership have fewer shareholders (-0.6647).The level of GHG emissions is negatively correlated to ROE (-0.4268) and to the binary variable indicating whether the firm is based in France (-0.5030). These two results suggest that the most polluting firms are those that are not based in France and are the least profitable. Like Villiers and van Staden (2011), we find a significant and positive correlation between ROE and Tobin's Q. Overall, the
DEBT/E
QUITY ROE ASSETS TOBIN'S Q DOM FR EMPLOY EES CO2 VOL. FOREIG N OWN. OWN.CO NC. ESG INDEX ENV. SCORE ENV.CO NTROV. HIGH RISK SECTOR DEBT/EQUITY 1.0000 ROE -0.0013 1.0000 ASSETS 0.6055 -0.1128 1.0000 TOBIN'S Q -0.2998 0.4154 -0.3101 1.0000 DOM FR -0.0274 0.0717 0.1127 0.1818 1.0000 EMPLOYEES 0.0715 -0.0009 0.0491 -0.1689 0.0757 1.0000 CO2 VOL. -0.0639 -0.4286 -0.0832 -0.3017 -0.5030 0.0838 1.0000 FOREIGN OWN. -0.3127 0.1518 -0.1804 0.0389 -0.1631 -0.1462 0.0664 1.0000 OWN.CONC. 0.3077 -0.0020 0.0621 0.0316 -0.0872 0.1225 0.1606 -0.6647 1.0000 ESG INDEX -0.0621 0.2897 -0.0202 0.2059 -0.0049 -0.0575 -0.2748 0.0850 -0.0465 1.0000 ENV. SCORE 0.2558 0.1827 0.3016 -0.0027 0.2189 0.3701 -0.1310 0.0468 0.0774 0.1878 1.0000 ENV.CONTROV. 0.0266 -0.1370 -0.0555 -0.1259 0.0258 0.0291 0.3279 -0.0879 0.1466 -0.2232 -0.0341 1.0000 HIGH STAKE SECTOR 0.2456 -0.0494 0.2418 -0.4113 -0.1085 0.2214 0.1882 -0.0394 0.2450 -0.2245 0.0202 0.0865 1.0000
correlations between the variables are not high enough to cause concerns with multi-collinearity when used in the same model.
4 Empirical part
Methodology: the panel Tobit model
Since our dependent variable is bounded between 0 and 10, we use a Tobit regression analysis rather than ordinary least squares regression. Tobit regression analysis accounts for the censoring of the response variable, and hence is the appropriate analytical method when analyzing bounded dependent variables (Greene, 1993). Moreover, we consider a panel dimension in the model in order to take into account two central aspects: i) the temporal dimension that is necessary to explain the evolution of the CCI over time ; and ii) the unobserved heterogeneity between firms.
The panel Tobit model can be described as follows : !"# = %"#& + (" + )"# with * = 1, … ,39 and
0 = 2015, 2016, 2017 with ("~789:0, ;<>=? and )
"~789:0, ;@>=?
and where the observed dependent variable is !"#A = !"#
The model is estimated by maximum likelihood approximated by adaptive Gauss–Hermite quadrature, following the method of Naylor and Smith (1982).
Results: the general model
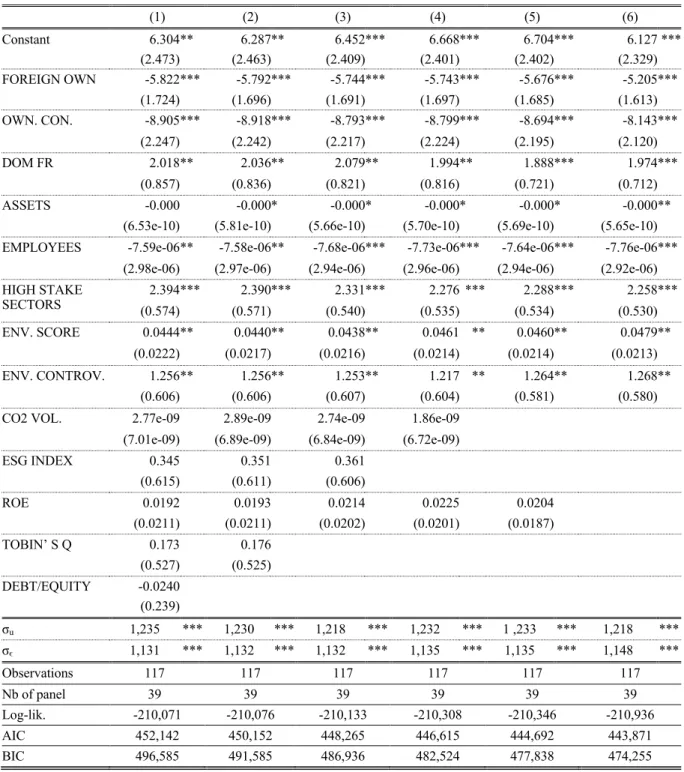
Results of the Tobit model with panel data are given in Table 8. The left-hand side variable in equation (1) is the CCI of firms the year t (t=2015, 2016, 2017). We include in the first column all the possible explanatory variables, corresponding to the full model. We then present the intermediate results (column (2) to (5)) leading to the most parsimonious model (column (6)).
Table 8 - Results of the panel Tobit model with random effects considering the CCI
This table reports results for the panel Tobit model considering the Global Index as dependent variable. Column (1) gives the results of the general model and column (6) gives the results of the most parsimonious model using a general-to-specific approach. Table 6 presents details on the variable construction.
(1) (2) (3) (4) (5) (6) Constant 6.304 ** 6.287 ** 6.452 *** 6.668 *** 6.704 *** 6.127 *** (2.473) (2.463) (2.409) (2.401) (2.402) (2.329) FOREIGN OWN -5.822 *** -5.792 *** -5.744 *** -5.743 *** -5.676 *** -5.205 *** (1.724) (1.696) (1.691) (1.697) (1.685) (1.613) OWN. CON. -8.905 *** -8.918 *** -8.793 *** -8.799 *** -8.694 *** -8.143 *** (2.247) (2.242) (2.217) (2.224) (2.195) (2.120) DOM FR 2.018 ** 2.036 ** 2.079 ** 1.994 ** 1.888 *** 1.974 *** (0.857) (0.836) (0.821) (0.816) (0.721) (0.712) ASSETS -0.000 -0.000 * -0.000 * -0.000 * -0.000 * -0.000 **
(6.53e-10) (5.81e-10) (5.66e-10) (5.70e-10) (5.69e-10) (5.65e-10) EMPLOYEES -7.59e-06 ** -7.58e-06 ** -7.68e-06 *** -7.73e-06 *** -7.64e-06 *** -7.76e-06 ***
(2.98e-06) (2.97e-06) (2.94e-06) (2.96e-06) (2.94e-06) (2.92e-06) HIGH STAKE SECTORS (0.574) 2.394 *** (0.571) 2.390 *** (0.540) 2.331 *** (0.535) 2.276 *** (0.534) 2.288 *** (0.530) 2.258 *** ENV. SCORE 0.0444 ** 0.0440 ** 0.0438 ** 0.0461 ** 0.0460 ** 0.0479 ** (0.0222) (0.0217) (0.0216) (0.0214) (0.0214) (0.0213) ENV. CONTROV. 1.256 ** 1.256 ** 1.253 ** 1.217 ** 1.264 ** 1.268 ** (0.606) (0.606) (0.607) (0.604) (0.581) (0.580) CO2 VOL. 2.77e-09 2.89e-09 2.74e-09 1.86e-09 (7.01e-09) (6.89e-09) (6.84e-09) (6.72e-09) ESG INDEX 0.345 0.351 0.361 (0.615) (0.611) (0.606) ROE 0.0192 0.0193 0.0214 0.0225 0.0204 (0.0211) (0.0211) (0.0202) (0.0201) (0.0187) TOBIN’ S Q 0.173 0.176 (0.527) (0.525) DEBT/EQUITY -0.0240 (0.239) σu 1,235 *** 1,230 *** 1,218 *** 1,232 *** 1 ,233 *** 1,218 *** σϵ 1,131 *** 1,132 *** 1,132 *** 1,135 *** 1,135 *** 1,148 *** Observations 117 117 117 117 117 117 Nb of panel 39 39 39 39 39 39 Log-lik. -210,071 -210,076 -210,133 -210,308 -210,346 -210,936 AIC 452,142 450,152 448,265 446,615 444,692 443,871 BIC 496,585 491,585 486,936 482,524 477,838 474,255 Standard errors in parentheses. *** significant at 1%, ** significant at 5%,, * significant at 10%,
First, firms’ environmental score seems to be a key determinants of the level of compliance with TCFD’s recommendations of CAC 40’s firms. More precisely, the higher the environmental score, the higher the level of compliance with TCFD’s recommendations. This result confirms previous studies showing that companies with high environmental performance have a higher level of disclosure (Clarkson et al. 2008; Latridis 2013; Hummel and Schlick
2016). In addition, the model shows that the more environmental controversies a company faces, the higher its compliance rate. This can be explained by the desire to legitimize these environmental actions with regard to stakeholders. This result is in line with the work of Cho and Patten (2007) and Hassan (2018) showing that firms use the disclosure of environmental information to legitimize themselves when facing environmental crises. Surprisingly, neither the level of CO2 emissions nor being part of the Thomson Reuters / S-Network ESG Best Practices index seems to explain the level of compliance with TCFD's recommendations. These results allow us to confirm the H1a and H1b, which are that companies with high environmental issues will disclose strongly, but also that virtuous companies also tend to have high scores. Second, companies in high-stakes sectors appears to be more compliant with TCFD’s recommendations. The companies most concerned by climate risks and opportunities, according to the TCFD classification, are those that achieve the highest compliance scores. This result is in line with previous work showing that companies in sectors considered to be polluting are the ones that communicate most about their environmental actions (Alnajjar 2000; Cormier and Magnan 2003; Depoers and Jérôme 2017). This result confirms H2 according to which belonging to a sector with high environmental stakes leads to a higher level of compliance with TCFD’s recommendations.
Third, the company's financial performance does not influence the level of the CCI, as variables measuring financial performance (i.e. DEBT/Equity, ROE, TOBIN'S Q) are not significant. These results confirm several previous studies showing that financial variables do not explain the level of disclosure of companies (Guidry and Patten 2012; Chung and Cho 2018; Hussain et al. 2018). Consequently, H3 cannot be validated.
Fourth, ownership structure strongly influence the level of the CCI as FOREIGN OWN. and OWN. CONC. are both negative and significant. This means that companies with foreign shareholders holding more than 20% of the capital and companies with a high ownership concentration are less compliant with TCFD’s recommendations. These results are consistent those of Brammer and Pavelin (2008) and Roy and Ghosh (2017) who show that firms with dispersed shareholdings have a better level of disclosure of environmental information, as well as with our theoretical grounds. These results confirm H4.
Finally, regarding our control variables, we find that the size of firms negatively affects their level of compliance with TCFD’s recommendations, as both ASSETS and EMPLOYEES are negative and significant. This result may be counterintuitive because several studies have
shown that the larger the firm, the more information it discloses (Cormier et al. 2005; Morhardt 2010). Moreover, it appears that the company's domiciliation in France, rather than in another European country, leads to a better compliance score over the period, this can be explained by the disclosure obligations already in force in France due to the NRE and energy transition laws.
Some refinements on our results
In order to take into account the differences between the four sub-indexes that make up the CIC, we have re-estimated the Tobit model using the four sub-indexes as dependent variables. Table 9 report the results of these models. For each sub-index, Column (1) gives the results of the general model and Column (2) gives the results of the most parsimonious model using a general-to-specific approach.
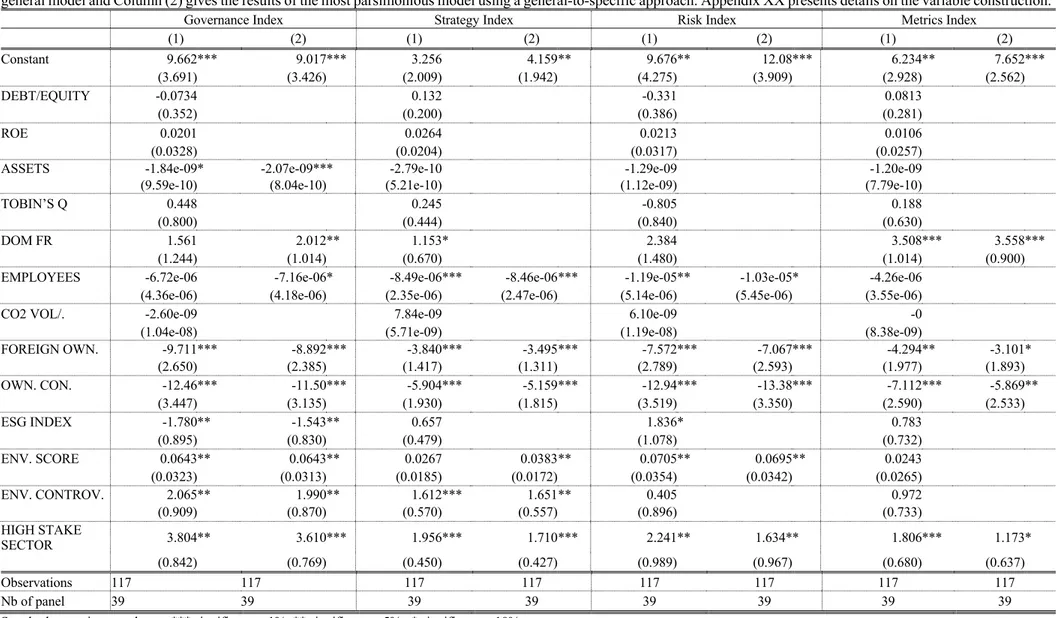
With regard to the shareholding structure, these results confirm those of the general model since FOREIGN OWN. and OWN. CONC. are negative and significant in all cases. Interestingly, it seems that the significant variables differ between indices. Regarding the size of the firm, ASSETS influence negatively the level of the Governance Index whereas it does not explain the other sub-indexes. However, the number of employees is found to have a negative and significant impact on the compliance levels of recommendations related to governance, strategy and risk management.
Table 9 - Results of the panel Tobit model with random effects considering each sub-index
This table reports results for the panel Tobit model with random effects considering each sub-index as dependent variable. For each index, Column (1) gives the results of the general model and Column (2) gives the results of the most parsimonious model using a general-to-specific approach. Appendix XX presents details on the variable construction.
Governance Index Strategy Index Risk Index Metrics Index
(1) (2) (1) (2) (1) (2) (1) (2) Constant 9.662 *** 9.017 *** 3.256 4.159 ** 9.676 ** 12.08 *** 6.234 ** 7.652 *** (3.691) (3.426) (2.009) (1.942) (4.275) (3.909) (2.928) (2.562) DEBT/EQUITY -0.0734 0.132 -0.331 0.0813 (0.352) (0.200) (0.386) (0.281) ROE 0.0201 0.0264 0.0213 0.0106 (0.0328) (0.0204) (0.0317) (0.0257)
ASSETS -1.84e-09 * -2.07e-09** * -2.79e-10 -1.29e-09 -1.20e-09 (9.59e-10) (8.04e-10) (5.21e-10) (1.12e-09) (7.79e-10)
TOBIN’S Q 0.448 0.245 -0.805 0.188
(0.800) (0.444) (0.840) (0.630)
DOM FR 1.561 2.012 ** 1.153 * 2.384 3.508 *** 3.558 *** (1.244) (1.014) (0.670) (1.480) (1.014) (0.900) EMPLOYEES -6.72e-06 -7.16e-06 * -8.49e-06 *** -8.46e-06 *** -1.19e-05 ** -1.03e-05 * -4.26e-06 (4.36e-06) (4.18e-06) (2.35e-06) (2.47e-06) (5.14e-06) (5.45e-06) (3.55e-06)
CO2 VOL/. -2.60e-09 7.84e-09 6.10e-09 -0
(1.04e-08) (5.71e-09) (1.19e-08) (8.38e-09) FOREIGN OWN. -9.711 *** -8.892 *** -3.840 *** -3.495 *** -7.572 *** -7.067 *** -4.294 ** -3.101 * (2.650) (2.385) (1.417) (1.311) (2.789) (2.593) (1.977) (1.893) OWN. CON. -12.46 *** -11.50 *** -5.904 *** -5.159 *** -12.94 *** -13.38 *** -7.112 *** -5.869 ** (3.447) (3.135) (1.930) (1.815) (3.519) (3.350) (2.590) (2.533) ESG INDEX -1.780 ** -1.543 ** 0.657 1.836 * 0.783 (0.895) (0.830) (0.479) (1.078) (0.732) ENV. SCORE 0.0643 ** 0.0643 ** 0.0267 0.0383 ** 0.0705 ** 0.0695 ** 0.0243 (0.0323) (0.0313) (0.0185) (0.0172) (0.0354) (0.0342) (0.0265) ENV. CONTROV. 2.065 ** 1.990 ** 1.612 *** 1.651 ** 0.405 0.972 (0.909) (0.870) (0.570) (0.557) (0.896) (0.733) HIGH STAKE SECTOR 3.804 ** 3.610 *** 1.956 *** 1.710 *** 2.241 ** 1.634* * 1.806 *** 1.173 * (0.842) (0.769) (0.450) (0.427) (0.989) (0.967) (0.680) (0.637) Observations 117 117 117 117 117 117 117 117 Nb of panel 39 39 39 39 39 39 39 39
Furthermore, being part of an environmental index has a strong negative influence on the level of compliance with TCFD’s recommendations regarding the governance area.
Finally, our results show that many of the variables relevant to explain the CCI and the first three sub-indices do not significantly explain the level of the Metrics Index. The latter is explained by the sector of activity, the domiciliation in France and the ownership structure but not by environmental variables. This can be explained by the fact that the Metrics Index is particularly subject to regulatory constraints that are already in force in France.
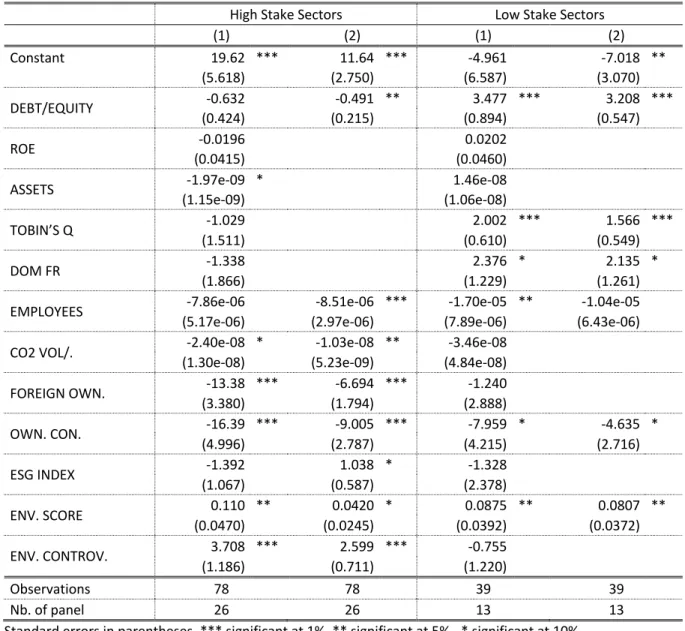
As HIGH-STAKE SECTOR is very significant in explaining the level of the CCI and its four sub-indices, we have decided to take into account this heterogeneity between firms by splitting our sample into two parts: i) companies operating in high stake sectors and ii) companies operating in low stake sectors. Table 10 display the results of the panel Tobit model considering, on the one hand, companies operating in high stake sectors, and on the other hand, companies operating in low stake sectors. For both high stake and low stake sectors Column (1) gives the results of the general model and Column (2) gives the results of the most parsimonious model using a general-to-specific approach.
While the ownership concentration and the environmental score have the same influence on the level of compliance with TCFD’s recommendations for high and low stakes sectors, the variables explaining the CIC are very different depending on the type of sector. Moreover, this distinction between high stake and low stake sectors makes it possible to highlight variables that were not significant in previous models. DEBT/EQUITY is significant in both cases but influences negatively the level of compliance with TCFD’s recommendations of companies in high stake sectors whereas it influences positively the level of compliance of companies in low stake sectors. This result is consistent with previous studies on polluting firms (Clarkson et al. 2011; Sen et al. 2011). The performance of the firm measured by the Tobin’s Q, has a strong positive influence on the CCI’s of companies in low stake sectors but has no influence on companies in high stake sectors. On the contrary, when considering only high stake sectors, companies with a high level of CO2 emissions are less compliant with the TDFD whereas this variable has no influence on companies in low stake sectors.
Table 10 - Results of the panel Tobit model with random effects considering high stake sectors and low stake sectors
This table reports results for the panel Tobit model with random effects considering, first, companies operating in high stake sectors and second, companies operating in low stake sectors. For high stake sectors (respectively low sectors), Column (1) gives the results of the general model and Column (2) gives the results of the most parsimonious model using a general-to-specific approach. Appendix XX presents details on the variable construction.
High Stake Sectors Low Stake Sectors
(1) (2) (1) (2) Constant 19.62 *** 11.64 *** -4.961 -7.018 ** (5.618) (2.750) (6.587) (3.070) DEBT/EQUITY -0.632 -0.491 ** 3.477 *** 3.208 *** (0.424) (0.215) (0.894) (0.547) ROE -0.0196 0.0202 (0.0415) (0.0460) ASSETS -1.97e-09 * 1.46e-08 (1.15e-09) (1.06e-08) TOBIN’S Q -1.029 2.002 *** 1.566 ***
(1.511) (0.610) (0.549) DOM FR -1.338 2.376 * 2.135 *
(1.866) (1.229) (1.261) EMPLOYEES -7.86e-06 -8.51e-06 *** -1.70e-05 ** -1.04e-05 (5.17e-06) (2.97e-06) (7.89e-06) (6.43e-06) CO2 VOL/. -2.40e-08 * -1.03e-08 ** -3.46e-08 (1.30e-08) (5.23e-09) (4.84e-08) FOREIGN OWN. -13.38 *** -6.694 *** -1.240 (3.380) (1.794) (2.888) OWN. CON. -16.39 *** -9.005 *** -7.959 * -4.635 * (4.996) (2.787) (4.215) (2.716) ESG INDEX -1.392 1.038 * -1.328 (1.067) (0.587) (2.378) ENV. SCORE 0.110 ** 0.0420 * 0.0875 ** 0.0807 ** (0.0470) (0.0245) (0.0392) (0.0372) ENV. CONTROV. 3.708 *** 2.599 *** -0.755 (1.186) (0.711) (1.220) Observations 78 78 39 39 Nb. of panel 26 26 13 13
Standard errors in parentheses. *** significant at 1%, ** significant at 5%,, * significant at 10%,
Overall, our results confirm that the operating sector and the ownership structure of the company is particularly discriminating, but they also highlight that the factors explaining environmental disclosure are different depending on whether the firm has strong or weak environmental issues.
Conclusion
While there is an abundant literature studying the determinants of voluntary environmental disclosures, the TCFD grid which aims at enhance financial transparency about CROs, has changed the situation by making it possible to study this issue using a globally recognized analytical framework. TCFD’s recommendations received indeed support from the French government and the European Union Technical Expert Group on Sustainable Finance (2019), and have become a world reference for financial transparency in relation with climate risks. We use in this study a new index measuring the degree of compliance of firms with TCFD’s recommendations, the Comprehensive Compliance Index (CCI) introduced by Demaria and Rigot (2018), and a panel Tobit model, in order to identify the key factors influencing voluntary environmental disclosures of CAC 40 companies.
Our results show that environmentally friendly companies are more compliant with TCFD's recommendations, especially when operating in an industry with high environmental stakes. In addition, media environmental exposure increases the level of compliance of firms with TCFD’s recommendations. We also find a strong influence of ownership structure on the CCI as a high shareholder concentration and a high proportion of foreign shareholders decrease the level of compliance with TCFD’s recommendations.
When we analyze separately high and low stake sectors, our results reveal significant differences in the determinants of compliance with TCFD's recommendations. Firms with a good financial performance are more compliant when they operates in a low stake sector while the inverse relationship is found for companies operating in high stake sectors. Finally, when operating in high stake sectors, more polluting companies tend to be less compliant with TCFD’s recommendations.
Finally, when looking at the different sub-components of the CCI, we find a difference between, on the one hand, the variables influencing the levels of the Governance Index, the Strategy Index and the Risk Index and, on the other hand, the variables influencing the level of the Metrics Index. This can be explained by the fact that the Metrics Index is particularly subject to regulatory constraints that are already in force in France.
Overall, our results shed new light on the company's voluntary environmental reporting for regulators seeking to improve financial transparency in relation with climate risks.
Bibliography
Aerts, W., & Cormier, D. (2009). Media legitimacy and corporate environmental
communication. Accounting, Organizations and Society, 34, 1-27,
doi:10.1016/j.aos.2008.02.005.
Aerts, W., Cormier, D., & Magnan, M. (2008). Corporate environmental disclosure, financial markets and the media: An international perspective. Ecological Economics, 64(3), 643-659, doi:https://doi.org/10.1016/j.ecolecon.2007.04.012.
Albertini, E. (2014). A Descriptive Analysis of Environmental Disclosure: A Longitudinal Study of French Companies. Journal of Business Ethics, 233-254.
Alnajjar, F. K. (2000). Determinants of social responsibility disclosures of U.S. Fortune 500 firms: An application of content analysis. In Advances in Environmental Accounting &
Management (Vol. 1, pp. 163-200, Advances in Environmental Accounting &
Management, Vol. 1): Emerald Group Publishing Limited.
Brammer, S., & Pavelin, S. (2008). Factors influencing the quality of corporate environmental disclosure. [Article]. Business Strategy & the Environment (John Wiley & Sons, Inc),
17(2), 120-136, doi:10.1002/bse.506.
Chelli, M., Richard, J., & Durocher, S. (2014). France's new economic regulations: insights from institutional legitimacy theory. Accounting, Auditing & Accountability Journal,
27, 283-316.
Cho, C. H., & Patten, D. M. (2007). The role of environmental disclosures as tools of legitimacy: A research note. [Article]. Accounting, Organizations & Society, 32(7/8), 639-647, doi:10.1016/j.aos.2006.09.009.
Chung, J., & Cho, C. H. (2018). Current Trends within Social and Environmental Accounting Research: A Literature Review. [Article]. Accounting perspectives, 17(2), 207-239, doi:10.1111/1911-3838.12171.
Clarkson, P. M., Li, Y., Richardson, G. D., & Vasvari, F. P. (2008). Revisiting the relation between environmental performance and environmental disclosure: An empirical
analysis. Accounting, Organizations and Society, 33, 303-327,
doi:10.1016/j.aos.2007.05.003.
Clarkson, P. M., Li, Y., Richardson, G. D., & Vasvari, F. P. (2011). Does it really pay to be green? Determinants and consequences of proactive environmental strategies. Journal
of Accounting and Public Policy, 30(2), 122-144, doi:https://doi.org/10.1016/j.jaccpubpol.2010.09.013.
Cormier, D., & Magnan, M. (2003). Environmental reporting management: a continental European perspective. Journal of Accounting and Public Policy, 22, 43-62, doi:10.1016/S0278-4254(02)00085-6.
Cormier, D., Magnan, M., & Van Velthoven, B. (2005). Environmental disclosure quality in large German companies: Economic incentives, public pressures or institutional
conditions? [Article]. European Accounting Review, 14(1), 3-39,
doi:10.1080/0963818042000339617.
Deegan, C., Rankin, M., & Tobin, J. (2002). An examination of the corporate social and environmental disclosures of BHP from 1983-1997: A test of legitimacy theory.
Accounting, Auditing & Accountability Journal, 15(3), 312-343, doi:doi:10.1108/09513570210435861.
Dejean, F., & Martinez, I. (2009). Communication environnementale des entreprises du SBF120 : déterminants et conséquences sur le coût du capital actions. Comptabilité -
Contrôle - Audit, 15, 55-78.
Delbard, O. (2008). CSR legislation in France and the European regulatory paradox: An analysis of EU CSR policy and sustainability. Corporate Governance: The
Demaria, S., & Rigot, S. (2018). Environmental Reporting Practices: Are CAC 40 firms
compliant with the recommendations of the Task Force on Climate-related Financial Disclosures? . Paper presented at the Les 8èmes Etats généraux de la recherche
comptable de l'ANC, Paris, 10 décembre 2018
Depoers, F. (2010). Gouvernance et qualité de l'information sur les gaz à effet de serre publiée par les sociétés cotées. Comptabilité - Contrôle - Audit, 16, 127-151, doi:10.3917/cca.163.0127.
Depoers, F., & Jérôme, T. (2017). Stratégies de publication des dépenses environnementales dans un cadre réglementaire. Comptabilité - Contrôle - Audit, 23, 41-74, doi:10.3917/cca.231.0041.
Fifka, M. S. (2013). Corporate Responsibility Reporting and its Determinants in Comparative Perspective - a Review of the Empirical Literature and a Meta-analysis. [Article].
Business Strategy & the Environment (John Wiley & Sons, Inc), 22(1), 1-35,
doi:10.1002/bse.729.
Greene, W. (1993). The Econometric Approach to Efficiency Analysis, in H. Fried, K. Lovell, and S. Schmidt, eds., The Measurement of Productive Efficiency, Oxford University
Press, Oxford.
Guidry, R. P., & Patten, D. M. (2012). Voluntary disclosure theory and financial control variables: An assessment of recent environmental disclosure research. Accounting
Forum, 36, 81-90, doi:10.1016/j.accfor.2012.03.002.
Hassan, O. A. G. (2018). The impact of voluntary environmental disclosure on firm value: Does organizational visibility play a mediation role? [Article]. Business Strategy & the
Environment (John Wiley & Sons, Inc), 27(8), 1569-1582, doi:10.1002/bse.2217.
Hughes, P. (1986). Signalling by Direct Disclosure under Asymmetric Information. Journal of
Accounting and Economics 7, 119-142.
Hummel, K., & Schlick, C. (2016). The relationship between sustainability performance and sustainability disclosure – Reconciling voluntary disclosure theory and legitimacy theory. Journal of Accounting and Public Policy, 35(5), 455-476, doi:https://doi.org/10.1016/j.jaccpubpol.2016.06.001.
Hussain, N., Rigoni, U., & Cavezzali, E. (2018). Does it pay to be sustainable? Looking inside the black box of the relationship between sustainability performance and financial performance. [Article]. Corporate Social Responsibility & Environmental
Management, 25(6), 1198-1211, doi:10.1002/csr.1631.
Larrinaga, C., Carrasco, F., Correa, C., Llena, F., & Moneva, J. (2002). Accountability and accounting regulation: the case of the Spanish environmental disclosure standard.
European Accounting Review, 11, 723-740.
Latridis, G. (2013). Environmental disclosure quality: Evidence on environmental performance, corporate governance and value relevance. Emerging Markets Review, 14, 55-75, doi:DOI10.1016/j.ememar.2012.11.003.
Li, Y., & Bewley, K. (2000). Disclosure of environmental information by Canadian manufacturing companies: A voluntary disclosure perspective. In Advances in
Environmental Accounting & Management (Vol. 1, pp. 201-226, Advances in
Environmental Accounting & Management, Vol. 1): Emerald Group Publishing Limited.
Morhardt, J. E. (2010). Corporate Social Responsibility and Sustainability Reporting on the Internet. [Article]. Business Strategy & the Environment (John Wiley & Sons, Inc),
19(7), 436-452, doi:10.1002/bse.657.
Naylor, J. C. and Smith, A. F. M. (1982). Applications of a Method for the Efficient Computation of Posterior Distributions, Applied Statistics, 31, 214-225.
Nègre, E., Verdier, M.-A., Cho, C. H., & Patten, D. M. (2017). Disclosure strategies and investor reactions to downsizing announcements: A legitimacy perspective. Journal of
Accounting and Public Policy, 36(3), 239-257, doi:https://doi.org/10.1016/j.jaccpubpol.2017.03.003.
O’Donovan, G. (2002). Environmental disclosures in the annual report: Extending the applicability and predictive power of legitimacy theory. Accounting, Auditing &
Accountability Journal, 15(3), 344-371, doi:doi:10.1108/09513570210435870.
Purushothaman, M., Tower, G., Hancock, R., & Taplin, R. (2000). Determinants of Corporate Social Reporting Practices of Listed Singapore Companies. Pacific Accounting Review,
12(2), 101-133.
Qiu, Y., Shaukat, A., & Tharyan, R. (2016). Environmental and social disclosures: Link with corporate financial performance. The British Accounting Review, 48, 102-116, doi:10.1016/j.bar.2014.10.007.
Reverte, C. (2009). Determinants of Corporate Social Responsibility Disclosure Ratings by Spanish Listed Firms. [Article]. Journal of Business Ethics, 88(2), 351-366, doi:10.1007/s10551-008-9968-9.
Roy, A., & Ghosh, S. K. (2017). Corporate Environmental Disclosure, Corporate Governance and Firm Characteristics: Evidence from Polluting and Non-Polluting Sectors in India.
IUP Journal of Corporate Governance, 16, 26-53.
Russo-Spena, T., Tregua, M., & De Chiara, A. (2018). Trends and Drivers in CSR Disclosure: A Focus on Reporting Practices in the Automotive Industry. [Article]. Journal of
Business Ethics, 151(2), 563-578, doi:10.1007/s10551-016-3235-2.
Scott, W. R. (1991). Unpacking Institutional Arguments. In W. Powell and P. DiMaggio, eds. The New Institutionalism in Organizational Analysis, University of Chicago Press, 64-182
Sen, M., Mukherjee, K., & Pattanayak, J. K. (2011). Corporate environmental disclosure practices in India. Journal of Applied Accounting Research, 12, 139-156, doi:10.1108/09675421111160709.
Shocker, A. D., & Sethi, S. P. (1973). An Approach to Incorporating Societal Preferences in Developing Corporate Action Strategies. California Management Review, 15(4), 97-105, doi:10.2307/41164466.
Suchman, M. C. (1995). Managing legitimacy: strategic and institutionnal approaches.
Academy of Management Review, 20(3), 571-610.
Villiers, C. d., & van Staden, C. J. (2011). Where firms choose to disclose voluntary environmental information. Journal of Accounting and Public Policy, 30(6), 504-525, doi:https://doi.org/10.1016/j.jaccpubpol.2011.03.005.
![[PDF] Tutoriel migration de Visual Basic 6 vers .NET | Cours informatique](data:image/gif;base64,R0lGODlhAQABAIAAAP///wAAACH5BAEAAAAALAAAAAABAAEAAAICRAEAOw==)