HAL Id: hal-00957183
https://hal.archives-ouvertes.fr/hal-00957183
Submitted on 9 Mar 2014
HAL is a multi-disciplinary open access
archive for the deposit and dissemination of
sci-entific research documents, whether they are
pub-lished or not. The documents may come from
teaching and research institutions in France or
abroad, or from public or private research centers.
L’archive ouverte pluridisciplinaire HAL, est
destinée au dépôt et à la diffusion de documents
scientifiques de niveau recherche, publiés ou non,
émanant des établissements d’enseignement et de
recherche français ou étrangers, des laboratoires
publics ou privés.
crystals in fields up to 28 tesla
Thierry Klein, D. Braithwaite, A. Demuer, William Knafo, G. Lapertot, C.
Marcenat, Pierre Rodière, I. Sheikin, Pierre Strobel, André Sulpice, et al.
To cite this version:
Thierry Klein, D. Braithwaite, A. Demuer, William Knafo, G. Lapertot, et al.. Thermodynamic
phase diagram of Fe(Se0.5Te0.5) single crystals in fields up to 28 tesla. Physical Review B:
Con-densed Matter and Materials Physics (1998-2015), American Physical Society, 2010, 82, pp.184506.
�10.1103/PhysRevB.82.184506�. �hal-00957183�
Thermodynamic phase diagram of Fe(Se
0.5Te
0.5) single crystals in fields up to 28 tesla
T. Klein,1,2D. Braithwaite,3 A. Demuer,4W. Knafo,5G. Lapertot,3C. Marcenat,3 P. Rodière,1I. Sheikin,4P. Strobel,1A. Sulpice,1and P. Toulemonde1
1Institut Néel, CNRS, 25 rue des martyrs, 38042 Grenoble, France 2Institut Universitaire de France and Université J. Fourier, Grenoble 1, France 3SPSMS, UMR-E9001, CEA-INAC UJF-Grenoble 1, 17 rue des martyrs, 38054 Grenoble, France
4LNCMI, CNRS, 25 Avenue des Martyrs, BP 166, 38042 Grenoble, France 5LNCMI, UPR 3228, CNRS-UJF-UPS-INSA, 31400 Toulouse, France
共Received 1 October 2010; published 4 November 2010兲
We report on specific heat共Cp兲, transport, Hall probe, and penetration depth measurements performed on
Fe共Se0.5Te0.5兲 single crystals 共Tc⬃ 14 K兲. The thermodynamic upper critical field Hc2lines has been deduced
from Cpmeasurements up to 28 T for both H储cand H储ab, and compared to the lines deduced from transport
measurements共up to 55 T in pulsed magnetic fields兲. We show that this thermodynamic Hc2line presents a
very strong downward curvature for T → Tcwhich is not visible in transport measurements. This temperature
dependence associated to an upward curvature of the field dependence of the Sommerfeld coefficient confirms that Hc2 is limited by paramagnetic effects. Surprisingly this paramagnetic limit is visible here up to T / Tc
⬃ 0.99 共for H储ab兲 which is the consequence of a very small value of the coherence length c共0兲 ⬃ 4 Å 关and
ab共0兲 ⬃ 15 Å兴, confirming the strong renormalization of the effective mass 共as compared to DMFT
calcula-tions兲 previously observed in ARPES measurements 关A. Tamai, A. Y. Ganin, E. Rozbicki, J. Bacsa, W. Meevasana, P. D. C. King, M. Caffio, R. Schaub, S. Margadonna, K. Prassides, M. J. Rosseinsky, and F. Baumberger, Phys. Rev. Lett. 104, 097002 共2010兲兴. Hc1 measurements lead to ab共0兲 = 430⫾ 50 nm and
c共0兲 = 1600⫾ 200 nm and the corresponding anisotropy is approximatively temperature independent 共⬃4兲,
being close to the anisotropy of Hc2for T → Tc. The temperature dependence of both 共⬀T2兲 and the electronic
contribution to the specific heat confirm the nonconventional coupling mechanism in this system.
DOI:10.1103/PhysRevB.82.184506 PACS number共s兲: 74.25.Dw, 74.70.Xa
I. INTRODUCTION
The discovery of superconductivity up to 55 K in iron-based systems1 has generated tremendous interest. Among
those, iron selenium 共FeSe1−␦兲 共Ref.2兲 has been reported to
be superconducting with a critical temperature of 8 K at am-bient pressure, rising to 34–37 K under 7–15 GPa.3On the
other hand, the substitution of tellurium on the selenium site in Fe1+␦共TexSe1−x兲 increases Tcto a maximum on the order of
14–15 K at ambient pressure4,5 共for x ⬃ 0.5兲. This binary
compound is very interesting as it shares the most salient characteristics of iron based systems共square-planar lattice of Fe with tetrahedral coordination兲 but has the simplest crys-tallographic structure among Fe-based superconductors 共no charge reservoir,6 so-called 11-structure兲. Moreover, even
though the end point Fe1+␦Te 共Ref. 7兲 compound displays
antiferromagnetic ordering, a magnetic resonance similar to that observed in other parent compounds 关with a 共1/2, 1/2兲 nesting vector connecting the ⌫ and M points of the Fermi surface兴 is recovered for intermediate Te contents8,9
suggest-ing a common mechanism for superconductivity in all iron-based superconductors. However, in contrast to iron pnic-tides which show only weak to moderate correlations, recent ARPES measurements suggested the existence of very large mass renormalization factors 共up to ⬃20 as compared to DMFT calculations兲 共Ref.10兲 indicating that Fe共Se,Te兲 is a strongly correlated metal differing significantly from iron pnictides.
In order to shed light on superconductivity in these sys-tems, it is of fundamental importance to obtain a precise
determination of both upper and lower critical fields and their anisotropy. Up to now Hc2 has mainly been deduced
from transport measurements11–13 and more recently by
spe-cific heat up to 14 T.14As in other pnictides共see Ref.15, and
references therein兲, high Hc2共0兲 values have been reported
but, in the case of Fe共TexSe1−x兲, strong deviations from the
standard Werthamer-Helfand-Hohenberg model for Hc2共T兲
have been reported. Those deviations have been associated to paramagnetic limitations 共so-called Pauli limit兲.11–13
How-ever, in presence of strong thermal fluctuations 共see discus-sion below兲, the determination of Hc2 from transport
mea-surement becomes very hazardous and a thorough analysis was hence lacking of an unambiguous determination of Hc2
from specific-heat measurements.
We show that the Hc2lines actually display a very strong
downward curvature close to Tccorresponding to0dHc2/dT
values rising up to ⬃12 T / K for H储cand even ⬃45 T / K for H储ab. This strong curvature, not visible in transport data, shows that Hc2remains limited by paramagnetic effects up to
temperatures very close to Tc共up to T / Tc⬃ 0.99 for H储ab兲.
The corresponding Pauli field Hp is slightly anisotropic
共Hp
储ab/
Hp储c⬃ 0.8兲 whereas the orbital limit 关Ho共0兲兴 presents a
much stronger anisotropy Ho共0兲储ab/Ho共0兲储c⬃ 3 – 4. The huge
0Ho共0兲 values 共⬃130⫾ 20 T for H储c and ⬃400⫾ 50 T for H储ab兲 correspond to very small coherence length values 关ab共0兲 ⬃ 15⫾ 1 Å andc共0兲 ⬃ 4 ⫾ 1 Å兴 confirming the large
value of the effective mass previously observed by ARPES 共Ref. 10兲 and hence supporting the presence of strong elec-tronic correlations in this system.
In addition, preliminary Hc1measurements led to
contra-dictory results. On the one hand, Yadav et al.16reported on
PHYSICAL REVIEW B 82, 184506共2010兲
rather high Hc1 values ⬃100 G and ⬃400 G for H储c and
H储ab, respectively, with Hc1 lines showing a clear upward
curvature at low temperature. On the other hand, Bendele et al.17obtained much smaller values共⬃20 G and ⬃45 G for
H储cand H储ab, respectively兲 associated with a clear satura-tion of the Hc1共T兲 lines at low temperature. Finally, Kim et
al.18reported on strong deviations of the temperature
depen-dence of the superfluid density 共s⬀ 1 / 2⬀ Hc1兲 from the
standard behavior, attributed to a clear signature of multigap superconductivity. We present here detailed first penetration field measurements performed with Hall sensor arrays in a variety of single crystals showing very different aspect ra-tios. We hence obtained0Hc1
储c
共0兲 = 78⫾ 5 G and0Hc1 储ab
共0兲 = 23⫾ 3 G. The Hc1lines clearly flatten off at low
tempera-ture but do not show the pronounced deep previously ob-tained in tunnel-diode oscillator共TDO兲 measurements.18Our
TDO measurements however led to a similar deep which is probably due to an overestimation of the absolute ⌬共T兲 value related to spurious edge effects. Finally, we obtained a temperature-independent ⌫Hc1= Hc1
储c/H c1 储ab
values ⬃3.3⫾ 0.5 which corresponds to ⌫= c/ab⬃ 4.0⫾ 0.8 共see below兲,
be-ing close to the ␥H
c2 value obtained for T → Tc 共i.e., ⬃Ho
储ab/
Ho储c兲.
Finally, we confirm that ⬀ T2 in both crystallographic
directions and show that the temperature dependence of Cp
strongly deviates from the standard BCS weak-coupling be-havior confirming the nonconventional coupling mechanism of this system. However, the amplitude of the specific heat jump is much larger than those previously reported in other Fe共Se,Te兲 samples and hence does not follow the ⌬Cpvs Tc3
scaling law reported in iron-based systems.19,20
II. SAMPLE PREPARATION AND EXPERIMENTS
We present here specific heat, transport, Hall probe, and tunnel diode oscillator 共penetration depth兲 measurements performed in Fe1+␦共Se0.50Te0.5兲 single crystals grown by two
different techniques. Samples A have been grown using the sealed quartz tube method. The samples were prepared from very pure iron and tellurium pieces and selenium shots in a 1:0.5:0.5 ratio, loaded together in a quartz tube which has been sealed under vacuum. The elements were heated slowly 共100 ° C / h兲 at 500 ° C for 10 h, then melted at 1000 ° C for 20 h, cooled slowly down to 350 ° C at 5 ° C / h, and finally cooled faster by switching off the furnace. Single crystals were extracted mechanically from the resulting ball, the crys-tals being easy cleaved perpendicular to their c crystallo-graphic axis. The refined lattice parameters of the Fe1+␦共Se0.5Te0.5兲 tetragonal main phase, a = 3.7992共7兲 Å and
c= 6.033共2兲 Å, are in agreement with the literature.4,17 The real composition of the crystals checked by x-ray energy-dispersive microanalysis using a scanning electron micro-scope was found to be Fe1.05共2兲共Te0.55共2兲Se0.45共2兲兲. The
tem-perature dependence of the resistivity shows a metallic behavior at low temperature as expected for this low level 共␦= 0.05兲 of interstitial iron.21
Samples of batch B were grown with the Bridgman tech-nique using a double-wall quartz ampoule. The inside tube had a tipped bottom with a 30° angle and an open top. The
inside wall of the outer ampoule was carbon coated to achieve the lowest possible oxygen partial pressure during the growth. The Bridgman ampoule was inserted in a three zone gradient furnace共1000° / 840° / 700°兲 and lowered at a speed of 3 mm/h. At the end of the growth, temperature was lowered to room temperature at 50 ° C / h. Further character-izations of these crystals have been published elsewhere.13
The different single crystals used in this study have been listed in TableI.
The Cp measurements have been performed in magnetic
fields up to 28 T using both an ac high sensitivity technique and a conventional relaxation technique. For ac measure-ments, heat was supplied to the sample by a light-emitting diode via an optical fiber and the corresponding temperature oscillations were recorded with a thermocouple 共sample A1 and A4兲. In parallel, the specific heat 共sample A5 and B1兲 were carried out in a miniaturized high-resolution microcalo-rimeter using the long-relaxation technique. The chip resis-tance used as both thermometer and heater as well as the thermal conductance of its leads have been carefully cali-brated up to 28 T using a capacitance thermometer. Each relaxation provides about 1000 data points over a tempera-ture interval of about 80% above the base temperatempera-ture which has been varied between 1.8 and 20 K. Data can be recorded during heating and cooling. The merging of the upward and downward relaxation data provides a highly reliable check of the accuracy of this method.
Electrical transport measurements have been performed on sample B1 in static magnetic fields up to 28 T and pulsed magnetic fields up to 55 T and are described in detail elsewhere.13We have also measured the resistivity of sample
A5 with a commercial device 共PPMS兲 up to 9 T.
The real part of the ac transmittivity, TH
⬘
, of samples A1 to A3 has been measured by centering these on a miniature GaAs-based quantum well Hall sensor 共of dimension 8 ⫻ 8 m2兲. The sensor is used to record the time-varyingcomponent Bacof the local magnetic induction as the sample
is exposed to an ac field ⬃1 Oe 共⬃ 210 Hz兲. TH
⬘
is then defined as: TH
⬘
=关Bac共T兲 − Bac共4.2 K兲兴 / 关Bac共T Ⰷ Tc兲− Bac共4.2 K兲兴. The remanent local dc field 关Brem共Ha兲兴 in the
sample has been measured after applying a magnetic field Ha
and sweeping the field back to zero. In the Meissner state, no
TABLE I. Average thickness d, width w, length l, or mass m of the samples and measurement techniques 共Cp= specific heat, R
= transport, HP= Hall probe, and TDO= tunnel-diode oscillator兲.
Sample d 共m兲 w 共m兲 l 共m兲 Measured by A1 50 180 220 ac-Cp, HP, TDO A2 60 300 750 HP, TDO A3 65 400 600 HP, TDO A3⬘ 40 400 300 HP, TDO A3⬙ 40 100 100 HP, TDO A4 m⬃ 50 g ac-Cp A5 m⬃ 1.1 mg dc-Cp, R B1 m⬃ 0.7 mg dc-Cp, R
vortices penetrate the sample and Bremremains equal to zero
up to Ha= Hf 共the first penetration field兲. A finite remanent
field is then obtained for field amplitudes larger than Hf as
vortices remain pinned in the sample.
Finally, the London magnetic penetration depth in the Meissner state, , has been measured on the same samples with a LC oscillating circuit共14 MHz兲 driven by a TDO. The samples have been glued at the bottom of a sapphire rod which were introduced in a coil of inductance L. The varia-tion in the penetravaria-tion depth induce a change in L and hence a shift of the resonant frequency␦f共T兲 = f共T兲 − f共Tmin兲.␦f共T兲,
renormalized to the frequency shift corresponding to the ex-traction of the sample from the coil ⌬f0 is then equal to the
magnetic susceptibility. At low temperatures 共typically for Tⱕ 12 K兲, Ⰶ d 共d being the lowest dimension of the sample, here the thickness兲, and we have ␦f共T兲⌬f
0 =
˜ R
˜, where ˜ is
an effective penetration depth depending on the field orien-tation and R˜ an effective dimension of the sample. When the magnetic field is applied along the c axis, only the in-plane supercurrents are probed and ˜ =ab, whereas ˜ =ab+
d wc
for H储ab 共w being the width of the sample兲. The effective dimension R˜ is calculated following Ref.22.
III. UPPER CRITICAL FIELD
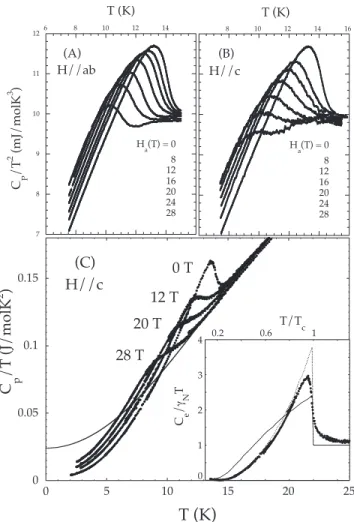
Figure 1 displays typical ac measurements for both H储c and H储ab 共sample A4兲. As shown, a well-defined specific-heat jump is obtained at Tcfor H = 0共⬃20% of the total Cp兲
and this peak progressively shifts toward lower temperature as the magnetic field is increased共here up to 28 T兲. The Hc2
line has been deduced from the midpoint of the Cp/T
anomaly after subtraction of a smooth polynomial back-ground from the raw data. As shown in Fig.2共A兲, the corre-sponding Hc2lines present a very strong downward curvature
for T → Tc which was not revealed by previous transport
measurements 关the same behavior is observed in all mea-sured samples, see, for instance, Figs. 2共B兲 and3共A兲for a comparison between samples A4 and B1兴. Note that a very similar curvature has been reported very recently from Cp
measurements up to 14 T.14
Such a curvature is a strong indication for paramagnetic effects and we have hence fitted the experimental data using a weak-coupling BCS clean limit model including both or-bital and Pauli limitations.23 This model only requires two
fitting parameters 共plus Tc兲: the initial slope dHc2/dT兩T=Tc
and the zero-temperature Pauli limit Hp. The results are
shown in Fig. 3共A兲for sample A4 and B1. As shown, very good fits can be obtained in both samples using very similar fitting parameters: 0dHc2/dT兩T=Tc⬃ 38⫾ 3 T / K and
⬃13⫾ 2 T / K for H储ab and H储c, respectively, and 0Hp
⬃ 45⫾ 2 T and ⬃54⫾ 4 T / K for H储ab and H储c, respec-tively.
As previously observed in layered systems 共see Ref.24
and discussion in Ref. 25兲 Hc2 储ab
is actually very close to a 共1 − T / Tc兲1/2law. Strikingly, this simple behavior is valid up
to T / Tc⬃ 0.99 in our system 关see Fig.3共B兲兴. Such a
depen-dence can be directly inferred from a Ginzburg-Landau共GL兲 expansion which leads to25
冉
H Hp冊
2 + H Ho = 1 − T Tc 共1兲共where Ho is the orbital field兲 i.e., Hc2⬃ Hp共1 − t兲0.5 for H
Ⰷ Hp
2/H
o. A fit to Eq. 共1兲 关solid line in Fig. 3共B兲兴 leads to
0Hp储ab⬃ 65 T and 0Hp储c⬃ 75 T, 0Ho储ab⬃ 650 T, and 0Ho储c⬃ 170 T 共sample A4兲.26 We hence have
0Hp
2/H
o
⬃ 6 T for H储ab, field which is reached for T / Tc⬃ 0.99.
Fe共Se,Te兲 is thus a rare example of superconductor for which the upper critical field is dominated by paramagnetic effects on almost the totality of the phase diagram 共for H储ab兲. A shown in Fig. 3共B兲, a linear dependence is recovered very close to Tc with 0dHo 储ab/ dT⬃ 45 T / K and 0dHo 储c / dT 8 10 12 14 16 T (K) (B) H//c Ha(T) = 0 8 12 16 20 24 28 6 8 10 12 14 7 8 9 10 11 12 C P /T 2 (m J/m o lK 3 ) (A) T (K) H//ab Ha(T) = 0 8 12 16 20 24 28 0 0.05 0.1 0.15 0 5 10 15 20 25 C p /T (J/m o lK 2 )
T (K)
H//c (C) 0 T 12 T 20 T 28 T 0 1 2 3 4 0.2 0.6 1 C e / ! N T T/TcFIG. 1. ac specific-heat measurements Cp/T2as a function of T
of a Fe共Se0.5Te0.5兲 single crystal 共sample A4兲 for 0H= 0, 8, 12, 16,
20, 24, and 28 T共from right to left兲 for 共a兲 H储aband共b兲 H储c. The data have been renormalized taking Cp共T = 20 K兲 = 3.8 J / mol K.
The Hc2line is deduced from the midpoint of the specific-heat jump
after subtraction of a smooth polynomial background.共c兲 Specific heat from relaxation data 共H储c兲 for the indicated magnetic fields 共sample A5兲. Inset: temperature dependence of the electronic con-tribution to the specific heat Ce = Cp− T3−␦T5 共solid symbols兲,
where the phonon contribution 共T3+␦T5兲 has been subtracted
from the normal-state data 关see thin line in Fig. 1共C兲兴. The BCS behavior for 2␦/kTc= 3.5共solid line兲 and 2⌬ / kTc= 5共dotted line兲 are displayed for comparison.
THERMODYNAMIC PHASE DIAGRAM OF Fe共Se0.5Te0.5兲… PHYSICAL REVIEW B 82, 184506共2010兲
⬃ 12 T / K, in good agreement with a values deduced from the BCS fitting procedure.27
Those extremely high Hovalues are related to very small
values of the coherence lengths ab= ⌽0/2关0.7⫻0Ho兴
⬃ 15⫾ 1 Å and c=ab⫻共Ho
储c/
Ho 储ab兲 ⬃ 4 ⫾ 1 Å which
confirm the very strong renormalization of the Fermi veloc-ity observed in ARPES measurements10 共see also theoretical
calculations in Ref. 28兲. Indeed, one gets vF,ab=⌬ab/ប
⬃ 1.4⫻ 104 m / s 关⌬ being the superconducting gap
⬃2 meV 共Refs.29and30兲兴 i.e., បvF,ab⬃ 0.09 eV Å in
per-fect agreement with ARPES data which also led to បvF
⬃ 0.09 eV Å for the␣3hole pocket centered on the ⌫ point 共note that the Hc2line will be dominated by the band having
the larger critical field, i.e., the lower Fermi velocity兲. Our measurements do hence confirm the strong correlation ef-fects previously suggested by ARPES measurements.10
An estimate of the paramagnetic field in the weak-coupling limit is given by the Clogston-Chandrasekhar
for-0 5 10 15 20 25 3010 11 12 13 14 15 midpoint Cp Onset T' H R -> 0 R/RN= 0.5
µ
0H
(T
)
T (K) (A) H//ab H//c 0 10 20 30 40 50 0 5 10 15 midpoint Cp R/RN= 0.5 R -> 0µ
0H
(T
)
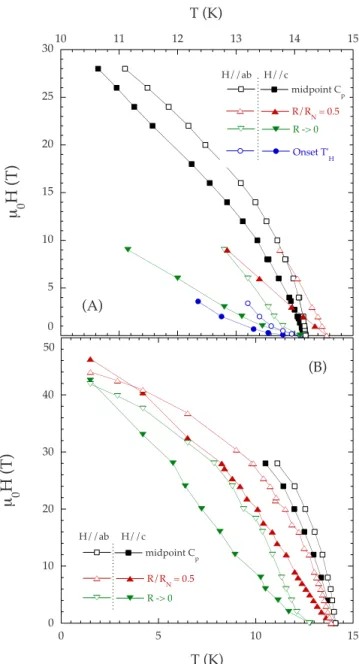
T (K) (B) H//ab H//cFIG. 2. 共Color online兲 共a兲 H-T phase diagram 共batch A兲 in both
H储ab共open symbols兲 and H储c共closed symbols兲 displaying the Hc2
line deduced from specific-heat measurements 共see Fig. 1兲 共squares兲, the field corresponding to the onset of the diamagnetic screening共circles兲 as well as the fields corresponding to zero resis-tance 共downward triangles兲 and R / RN= 0.5 共upward triangle, RN
being the normal-state resistance兲. 共b兲 Same as in 共a兲 for sample B1. The transport data are taken from Ref.13. See Fig.3for a direct comparison between the Hc2lines in each batch.
0.01 0.1 1 10 0.0001 0.001 0.01 0.1 1 µ 0 H (T ) 1-T/T c H irr~ (1-t) 2 Hc2~ (1-t) H c2~ (1-t) 0.5 (B) H//ab H//c 0 5 10 15 20 25 30 35 408 9 10 11 12 13 14 15 sample A4 sample B1
µ
0H
(T
)
T (K) //ab //c (A) theoretical fits 40 15 Sample A4 dH c2/dT(T=Tc) (T/K) 35 12 Sample B1 H p(Tesla) 43 50 Sample A4 47 58 Sample B1FIG. 3. 共Color online兲 共a兲 Comparison between the Hc2共T兲
val-ues deduced from specific-heat measurements in sample A4 共blue squares兲 and sample B1 共red circles兲 for both H储c共closed symbols兲 and H储ab共open symbols兲 and theoretical values for clean weakly coupled BCS superconductors including both orbital and Pauli limi-tations共solid lines兲. 共b兲 Hc2vs共1 − t兲 共sample A4兲 in a log-log scale
共t = T / Tc兲 showing that the linear dependence of the Hc2line rapidly
crosses to a⬃共1 − t兲0.5dependence. The solid lines are fits to Eq.共1兲
共see text for details兲. The linear slopes close to Tc 共⬃45 and
⬃12 T / K兲 extrapolate to very high orbital limits. On the contrary the irreversibility line共blue circles兲 displays the 共1 − t兲2dependence
mula:0Hp= 2⌬ /
冑
2gB⬃ 26 T in our sample 共taking g = 2兲,i.e., well below the experimental suggesting that g ⬃ 1.0– 1.2. however, it is important to note that Hp may be
increased by strong-coupling effects31 and a fit to the data
can be obtained introducing an electron-phonon coupling constant ⬃ 0.6– 0.7 and g ⬃ 2 共still having an anisotropy on the order of 1.2 between the two main crystallographic axis兲. Even if it is difficult to conclude on the exact value of g, our data clearly indicate a small anisotropy of this coefficient共 ⬃1.2兲 supporting the possibility of a crossing of the Hc2
lines at low temperature. Note that this anisotropy is much lower than the one inferred from transport measurements 关⬃4 共Ref.13兲兴 confirming that the large apparent anisotropy of g deduced from those measurements is an artifact, prob-ably related to the anisotropy of flux dynamics 共see discus-sion on the irreversibility line below兲. The anisotropy of the upper critical field is then strongly temperature-dependent rising from Hcab2/H c2 c ⬃ H p ab/H p c
⬃ 0.8 for T →0, reflecting the small anisotropy of the g factor, to Hc2
ab/H c2 c ⬃ H o ab/H o c
⬃ 3.5– 4 close to Tc, reflecting the anisotropy of the
coher-ence lengths共see Fig.7兲.
IV. IRREVERSIBILITY LINE
The small values associated to large values, ab共0兲
⬃ 430 nm 共see below and Ref.17兲 lead to strong fluctuation effects hindering any direct determination of Hc2from either
transport of susceptibility measurements. These fluctuations
can be quantified by the Ginzburg number Gi
=共kBTc/⑀0c兲2/8, where⑀0关=共⌽0/4ab兲2兴 is the line tension
of the vortex matter. One hence obtains ⑀0c⬃ 40 K 共as a
comparison⑀0c⬃ 200 K in cuprates兲 and Gi⬃ 10−2which is
very similar to the value obtained in YBa2Cu3O7−␦ or
NdAsFe共O1−xFx兲 共so-called 1111-phase, see Ref.32, and
ref-erences therein兲 clearly showing that thermal fluctuations are very strong in this system.
To emphasize this point, we have reported in Fig.2, the temperatures corresponding to both R → 0 and R / RN= 0.5
de-duced from transport measurements up to 9 T for sample A4 共see also Fig.4兲 and even up to 50 T for sample B1 共see Ref.
13兲 共RN being the normal state resistance兲. As shown, none
of those lines present the strong downward curvature ob-tained in Cp measurements. On the contrary, the R / RN= 0
lines vary almost linearly with T with d0H / dT⬃ 11 T / K and⬃5 T / K for H储aband H储c, respectively, in agreement with previous measurements.11,12However, as pointed above,
these lines do not correspond to any thermodynamic criterion and discussions of the corresponding lines should hence be taken with great caution. Moreover whereas the midpoint of the specific heat coincides with the R = 0 temperature for H = 0 in sample A4, this midpoint rather lies close to the R / RN= 0.5 point in sample B1 clearly showing that neither of those two transport criteria can be associated with the Hc2
line.
Similarly, as previously observed in high-temperature cu-prates and 1111-pnictides,32 the onset of the diamagnetic
re-sponse共TH
⬘
→ 0兲 also lies well below the Hc2 line 关see Figs.2共A兲and4兴. Indeed, this onset is related to the irreversibility line above which the system is unable to screen the applied
ac field due to the free motion of vortices. This irreversibility line is then expected to lie close to the R = 0 line. As shown in Fig.4 the onset of diamagnetism actually differs slightly from the onset of resistivity. This difference is much prob-ably related to different voltage-current criteria共the magnetic screening corresponds to much smaller electric fields but re-quires higher currents兲 but both lines present the positive curvature characteristic of the onset of irreversible processes. Note that, as expected for vortex melting 共for a review see Ref.33兲, the irreversibility line 共here defined as the onset of TH
⬘
兲 varies as: Hirr⬀共1 − T / Tc兲␣with␣⬃ 2 关see Fig.3共B兲兴. Asimilar curvature has also been reported by Bendele et al.17
for the irreversibility field deduced from magnetization mea-surements.
V. LOWER CRITICAL FIELD
The first penetration field has been measured on a series of Fe共Se0.5Te0.5兲 samples with very different aspect ratios
-1 -0.5 0 0.5 1 11 12 13 14 15 16 T ' H -1 R(T )/R(17K ) T (K) µ 0H=0 µ 0H=1T µ 0H=3T µ 0H=9T µ 0H=3T µ0H=0 0 0.03 13 14 15 16 ! C p /T (arb .unit s) R (" ) T (K) Ha=6T H a=0T
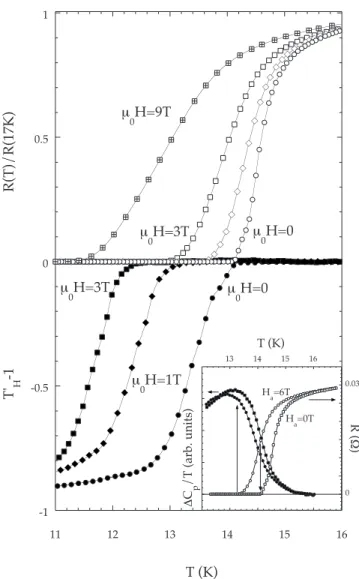
FIG. 4. Transport and ac transmittivity measurements as a func-tion of T for the indicated magnetic fields共H储c兲 in Fe共Se0.5, Te0.5兲
single crystals. In the inset: comparison between transport and specific-heat data for 0H= 0 and 6 T共储c兲 emphasizing that the
midpoint of the specific-heat anomaly does not correspond to any characteristic temperature in R共T兲 for H ⫽ 0.
THERMODYNAMIC PHASE DIAGRAM OF Fe共Se0.5Te0.5兲… PHYSICAL REVIEW B 82, 184506共2010兲
共see Table I兲. To avoid spurious effects associated to strong pinning preventing the vortex diffusion to the center of the sample34H
f has also been measured on several locations of
the same sample. The inset of Fig. 5 displays typical ex-amples on sample A3
⬘
共two positions兲 and A3⬙
. In samples with rectangular cross sections, flux lines partially penetrate into the sample through the sharp corners even for Ha⬍ Hfbut remain “pinned” at the sample equator. The magnetiza-tion at Ha= Hf is then larger than Hc1 and the standard
“el-liptical” correction for Hc1关=Hf/共1 − N兲, where N is the
de-magnetization factor兴 cannot be used anymore. Following Ref. 35, in presence of geometrical barriers, Hf is related to
Hc1 through
Hc1⬇
Hf
tanh共
冑
␣d/w兲, 共2兲where␣varies from 0.36 in strips to 0.67 in disks, d and w being the thickness and width of the sample, respectively. To reduce the uncertainty associated with the␣value as well as the d / w ratio in real samples of irregular shape, five different samples with different aspect ratios have been measured共see Table I兲. Sample A3
⬘
has been cut out of sample A3 and finally A3⬙
out of A3⬘
in order to directly check the influ-ence of the aspect ratio on Hf. The corresponding Hfvaluesare reported in the inset of Fig.7together with the theoreti-cal predictions from Eq.共2兲 taking0Hcab1= 78 G共the predic-tions for a an standard elliptical correction are also displayed for comparison兲.
The lower critical fields共0Hcc1,0Hcab1兲 are then related to the penetration depth共c, ab兲 through
0Hcc1= ⌽0 4ab 2 关ln共兲 + c共兲兴, 共3兲 0Hcab1= ⌽0 4abc 关ln共ⴱ兲 + c共ⴱ兲兴, 共4兲
where = ab/ab, ⴱ= c/ab, and c共兲 is a -dependent
function tending toward ⬃0.5 for large values. Taking 0Hcc2共0兲 = 0.7⫻0Ho⬃ 130 T, and Hc1
c
= 78⫾ 5 G one gets ab共0兲 ⬃ 430⫾ 50 nm, which is in fair agreement with
muons relaxation data.17,36This very large value confirms
the general trend previously inferred in iron pnictides 共see, for instance, Ref.17, and references therein兲 pointing toward a linear increase of Tcvs 1 / ab
2 as initially proposed in
cu-prates by Uemura et al.37 For H储ab, no correction was
in-troduced 共flat samples兲 and one hence obtains 0Hcab1 =0Habf = 23⫾ 3 G leading to c⬃ 1600⫾ 200 nm 共taking
0Hcab2= 0.7⫻0Hoab⬃ 460 T兲.
As shown in Fig.5, Hc1共T兲 clearly shows a saturation at
low temperature. As a comparison we have reported on Fig.
5 the temperature dependence of the superfluid density
de-duced from muons relaxation data36 and
S
TDO共T兲
measurements.18Both H
c1andS
SR共T兲 curves are similar but
do not reproduce the important shoulder at 5 K of the super-fluid density. This shoulder has been interpreted as a clear signature of multigap superconductivity and as a failure of the clean limit s-wave 共including s⫾兲 pairing.18 Our
mea-surements do not support this interpretation.
In order to shed light on this discrepancy, we have per-formed TDO measurements on each of the samples of Table
I. As described in Sec.II, cand abwere deduced from the
effective penetration depth ˜ measured for both H储ab and H储c. As shown in Fig. 6 共sample A3
⬙
兲, both ⌬aband ⌬care proportional to Tn with n close to 2, in good agreement
with previous measurements for H储c 共Ref. 18兲 共the same temperature dependence has been obtained for all samples兲. The TDO data then require the introduction of the value of ab共0兲 to convert the ⌬共T兲 data into S
TDO共T兲 /
S
TDO共0兲
= 1 /关1 + ⌬ab共T兲 / ab共0兲兴2. Introducing ab共0兲 ⬃ 430 nm and
taking R˜ ⬃14 m共from Ref. 22兲, STDO共T兲 shows a change of curvature around 5 K, very similar to the one previously reported in Ref. 18 共see inset of Fig.6兲. A similar discrep-ancy has already been observed in MgCNi3 and interpreted
as a reduction in the critical temperature at the surface of the sample due to a modification of the carbon stoichiometry.38
However, such an explanation is not expected to hold here as single crystals were extracted mechanically from the bulk.
It is important to note that the temperature dependence of the superfluid density is very sensitive to the absolute value of ⌬ and, although very similar to the one reported by Kim et al.,18 the amplitude of ⌬
ab/T2⬃ 40 Å / K2 observed in
our samples is much larger than the one reported recently by Sarafin et al.14 共⬃10 Å / K2兲. Similar discrepancies in the
absolute amplitude of ⌬ have also been reported in other pnictides39 and have been attributed to complications from
rough edges which may lead to an overestimation of ⌬. Dividing the absolute ⌬ab by a factor ⬃5 共i.e., taking R˜
0 20 40 60 80 100 0 2 4 6 8 10 12 14 16 µ 0 H c1 (G ) T (K) -5 0 5 10 -50 0 50 Brem S/ !0 µ0Ha(G) Sample A3' (Edge) Sample A3' (Center) Sample A3" Hp Hp
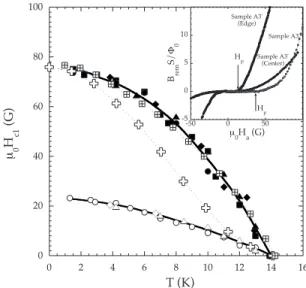
FIG. 5. Temperature dependence of the lower critical field共Hc1兲
deduced from Hall probe measurements for H储ab共open symbols兲 and H储c共closed symbols兲 in sample A1 共squares兲, A2 共circles兲, A3 共lozenges兲, and A3⬙共triangles兲, see TableIfor sample dimensions. Solid lines are guide to the eyes, crossed squares are muon relax-ation data from Ref.23 and open crosses TDO data. In the inset: remanent field Bremas a function of the applied field in sample A3⬘
= 70 m for H储cinstead of 14 m兲 actually leads to a very good agreement between TDO and Hc1 data 共see Fig. 6兲
hence indicating that this value has probably been overesti-mated due to an underestimation of the effective dimension R
˜ in presence of rough edges.
Very similar temperature dependences of Hc1 were
ob-tained in both directions 共see Fig. 5兲 leading to a 共almost兲 temperature-independent anisotropy of Hc1: ⌫Hc1⬃ 3.4⫾ 0.5
and hence ⌫= c/ab=共Hc1
c /H c1
ab兲 ⫻ 兵关ln共ⴱ兲 + c共兲兴 / 关ln共ⴱ兲
+ c共兲兴其 ⬃ ⌫Hc1⫻ 1.2⬃ 4.1⫾ 0.8 共see Fig. 7兲. This value is
hence very close to the one obtained for Hc2 close to Tcas
⌫Hc2共T →Tc兲 ⬃ ⌫Ho=ab/c共see Fig.7兲. Similarly, very
simi-lar temperature dependences have been obtained for ⌬cand
⌬ab共with ⌬c⬃ 5 ⫻ ⌬abup to T⬃ Tc兲 again suggesting a
weak temperature dependence of this anisotropy. Finally, this value is also close to the one obtained for the irreversibility field deduced from the onset of diamagnetic screening.
VI. FINAL DISCUSSION
The value of the normal state Sommerfeld coefficient共␥N兲
in Fe共Se,Te兲 compounds remains debated as values ranging from⬃23 mJ/ mol K2共Ref.40兲 to ⬃39 mJ/ mol K2共Ref.4兲
have been obtained. For nonsuperconducting samples, it has even been shown recently41 that␥
Nrises rapidly for x ⬍ 0.1
reaching⬃55 mJ/ mol K2for 0.1ⱕ x ⱕ 0.3. Even though our
maximum field共28 T兲 is too low to fully destroy supercon-ductivity down to 0 K hence hindering any precise determi-nation of␥N, it is worth noting that a␥Nvalue on the order of
⬃39 mJ/ mol K2is incompatible with the entropy
conserva-tion rule in our sample. A reasonable fit to the data关solid line
in Fig.1共C兲兴 assuming that Cp/T=␥N+T2+␦T4 for 20⬎ T
⬎ 12 K and 0H= 28 T leads to ␥N= 23⫾ 3 mJ/ mol K2 in
good agreement with the value obtained by Tsurkan et al.40
This␥Nvalue is also in fair agreement with the one deduced
from ARPES measurements 关⬃30 mJ/ mol K2 共Ref. 10兲兴.
Similarly, the Debye temperature共⌰D⬃ 143 K兲 is in
reason-able agreement with the one previously reported in both Fe共Se0.67Te0.23兲 关⌰D⬃ 174 K 共Ref. 4兲兴 and Fe1.05Te 关⌰D
⬃ 141 K 共Ref.42兲兴.
The electronic contribution to the specific heat 共Ce/T
= Cp/T−T2−␦T4兲 is then displayed in the inset of Fig. 1
together with the theoretical prediction for a single-gap BCS superconductor in the weak-coupling limit 共i.e., taking 2⌬ / kTc⬃ 3.5, thin solid line兲. As shown, this standard
be-havior largely overestimates the experimental data at low temperature suggesting the presence of a much larger gap. A reasonable agreement to the data is obtained assuming that 2⌬ / kTc⬃ 5 共dotted line兲. However, even though some
indi-cation for the presence of a large gap were obtained by fitting either SR共Ref. 36兲 or optical conductivity43 data, the
cor-responding gap value 共⬃3 meV兲 is much larger than the value obtained by spectroscopy关⬃1.8– 2 meV 共Refs.29and
30兲兴. Moreover those former measurements also suggest the presence of a much smaller gap which is not present in our specific-heat measurements.
Some evidence for nodes 共or for deep gap minima兲 in Fe共Se0.5Te0.5兲 has been suggested by fourfold oscillations in
the low-temperature specific heat for H储c.44 However,
de-spite the high resolution of our ac technique and the very good quality of our samples共the specific heat jump at Tcis
slightly larger than in Ref. 44兲 we did not observe these 0 100 200 300 400 500 600 700 800 0 10 20 30 40 50 ! " (nm ) T2(K2)
!"
c!"
ab 0 1 0 5 10 #s,ab (T )/ #s,ab (0) T (K) Taking R = 14 µm Taking R = 70 µm ~ ~FIG. 6. Temperature dependence of ab共solid symbols兲 and c
共open symbols兲 deduced from the frequency shift in TDO measure-ments共sample A3⬙, TableI兲. Inset: temperature dependence of the superfluid density S
TDO共T兲 /
S
TDO共0兲 = 1 / 关1 + ⌬
ab共T兲 / ab共0兲兴2
tak-ing ab共0兲 = 430 nm and R˜ =14 m 共solid symbols兲 关i.e., following
Ref.22, see corresponding ⌬ab共T兲 values on the main panel兴 or R
˜ =70 m 共open symbols兲. The average Hc1共T兲 / Hc1共0兲 curve 共see
Fig.5兲 is displayed as the thick solid line.
0 1 2 3 4 5 0 0.2 0.4 0.6 0.8 1 ! T/Tc Hc2 Hc1(x 1.2) Hirr 0 50 0 0.5 µ 0 H f (G ) 2d/(w+l)
Geometrical Barriers - disk 78G
GB-strip 78G (1-N).H c1(disk - 93G) A1 A2 A3 A4 A5
FIG. 7. Temperature dependence of the anisotropy of the upper 共open circles兲, and lower 共solid squares兲 critical fields and irrevers-ibility line共onset of diamagnetic response, open crosses兲. The ⌫Hc1
data have been multiplied by a factor 1.2 to display ⌫= 1.2
⫻ ⌫Hc1. In the inset: first penetration field Hf as a function of the
aspect ratio: 2d /共w + l兲. Thick solid lines are theoretical predictions in presence of geometrical barriers using see Eq.共2兲 for disks 共up-per line兲 and strips 共lower line兲; the thin line correspond to a stan-dard elliptical correction共no surface barrier兲.
THERMODYNAMIC PHASE DIAGRAM OF Fe共Se0.5Te0.5兲… PHYSICAL REVIEW B 82, 184506共2010兲
oscillations in our samples 关i.e., ⌬Cp共兲 / Cp⬍ 10−3兴. Nodes
are also expected to show up in the field dependence of the Sommerfeld coefficient 关␥共H兲兴 which is then expected to vary as H␣ with␣⬍ 1共␣= 0.5 for the so-called Volovik ef-fect for d-wave pairing with line nodes whereas ␣⬃ 1 for classical single-gap BCS systems兲. We have hence extrapo-lated the Ce共H兲 / T data to zero using either a BCS formula
共see discussion above, Ce/T−␥共H兲 ⬀ exp关−⌬共H兲 / kT兴 in our
temperature range兲 or a phenomenological second-order polynomial fit. Both procedure led to a concave curvature for ␥共H兲 with␣⬃ 1.5⫾ 0.3 for H储cand␣⬃ 2.2⫾ 0.6 for H储ab. This concave behavior can be attributed to the effect of Pauli paramagnetism on the vortex cores45共see Refs.46and47for
experimental data in heavy fermions兲 hence clearly support-ing the importance of these effects in Fe共Se0.5Te0.5兲.
Finally note that it has been suggested that ⌬Cp/Tccould
be proportional to Tc2in iron pnictides19,20due to strong
pair-breaking effects48 with ⌬C
p/Tc
3⬃ 0.06 mJ/ mol K4. One
hence would expect an anomaly ⌬Cp/Tc⬃ 12 mJ/ mol K2at
Tcin our system which is clearly lower than the experimental
value ⬃40⫾ 5 mJ/ mol K2. Similarly, it has been suggested
that the initial slope of the Hc2 line could scale as 0dHcc2/dT⬃ 0.2⫻ Tc 共T / K兲 but, again, this scaling does
not hold in our sample for which0dHc2
c /
dT⬃ 12 T / K. Fi-nally note that the temperature dependence of the superfluid density 共see discussion above兲 supports the ⌬ab/T2
⬃ 10 Å / K2 value obtained by Serafin et al.14 which is also
much smaller than the one suggested from the scaling of:49
⌬ab/T2⬃ 8.8⫻ 104/Tc
3⬃ 32 Å / K2.
VII. CONCLUSION
In summary, 共i兲 precise determinations of the Hc2 lines
from Cp measurements led to a very strong downward
cur-vature, similar to that observed in layered systems.
共ii兲 The temperature dependence of the upper critical field and the field dependence of the Sommerfeld coefficient both indicate that Hc2 is limited by strong paramagnetic effects
with 0Hp⬃ 45⫾ 2 T and ⬃54⫾ 4 T for H储ab and H储c,
respectively.
共iii兲 The very small value of the coherence lengthab共0兲
⬃ 15 Å confirms the strong renormalization of the effective mass共compared to DMFT calculations兲 previously observed in ARPES measurements10 and associated strong electron
correlation effects.␥Nis estimated to⬃23⫾ 3 mJ/ mol K2in
fair agreement with the ARPES value.
共iv兲 The anisotropy of the orbital critical field is estimated to be on the order of 4 hence leading to ac共0兲 value smaller
than the c lattice parameter.
共v兲 Neither the temperature dependence of nor that of the electronic contribution to the specific heat follow the
weak-coupling BCS model 共an BCS dependence with
⌬ / kTc⬃ 5 remains possible兲 but no evidence for nodes in the
gap is obtained from the field dependence of the Sommerfeld coefficient. We did not observe the fourfold oscillations of the low-temperature specific heat previously obtained by Zeng et al.44
共vi兲 The amplitude of the specific-heat jump ⌬CP/Tc
⬃ 40⫾ 5 mJ/ mol K2is much larger than that previously
ob-served in Fe共Se,Te兲 and does not follow the ⌬Cp/Tc
3
inferred in iron pnictides. Similarly neither the slope of the Hc2 line
nor the absolute value of ⌬共T兲 obey the scaling laws previ-ously proposed for iron pnictides.48,49
共vii兲 ab共0兲 = 430⫾ 50 nm and c共0兲 = 1600⫾ 200 nm,
confirming the very small superfluid density previously ob-served in iron pnictides. The corresponding anisotropy is al-most temperature independent with ⌫⬃ ⌫Hc2共T →Tc兲 =␥.
共viii兲 These large values associated to small values lead to a very small condensation energy ⑀0c⬃ 40 K and
hence to large fluctuation effects hindering any determination of Hc2 from either transport or susceptibility measurements.
A detailed analysis of the influence of these fluctuations on the specific-heat anomaly will be presented elsewhere.
共ix兲 The strong upward curvature of the irreversibility line 共defined as the onset of diamagnetic screening兲: Hirr⬀共1
− T / Tc兲2strongly suggests the existence of a vortex liquid in
this system.
ACKNOWLEDGMENTS
This work has been supported by the French National Research Agency, Grant No. ANR-09-Blanc-0211 SupraTet-rafer and ANR “DELICE,” and by the Euromagnet II grant via the EU under Contract No. RII-CT-2004-506239. T.K. is most obliged to V. Mosser of ITRON, Montrouge, and M. Konczykowski from the Laboratoire des Solides Irradiés, Palaiseau for the development of the Hall sensors used in this study. We thank J.-P. Brison for the software used to fit the Hc2data.
1Y. Kamihara, T. Watanabe, M. Hirano, and H. Hosono, J. Am.
Chem. Soc. 130, 3296共2008兲; X. H. Chen, T. Wu, G. Wu, R. H. Liu, H. Chen, and D. F. Fang,Nature共London兲 453, 761 共2008兲.
2F. C. Hsu, J. Y. Luo, K. W. Yeh, T. K. Chen, T. W. Huang, P. M.
Wu, Y. C. Lee, Y. L. Huang, Y. Y. Chu, D. C. Yan, and M. K. Wu,Proc. Natl. Acad. Sci. U.S.A. 105, 14262共2008兲.
3G. Garbarino, A. Sow, P. Lejay, A. Sulpice, P. Toulemonde, M.
Mezouar, and M. Núñez-Regueiro, EPL 86, 27001共2009兲; S. Medvedev, T. M. McQueen, I. A. Troyan, T. Palasyuk, M. I. Eremets, R. J. Cava, S. Naghavi, F. Casper, V. Ksenofontov, G.
Wortmann, and C. Felser,Nature Mater. 8, 630共2009兲; S. Mar-gadonna, Y. Takabayashi, Y. Ohishi, Y. Mizuguchi, Y. Takano, T. Kagayama, T. Nakagawa, M. Takata, and K. Prassides, Phys. Rev. B 80, 064506共2009兲; Y. Mizuguchi, F. Tomioka, S. Tsuda, T. Yamaguchi, and Y. Takano, Appl. Phys. Lett. 93, 152505 共2008兲; D. Braithwaite, B. Salce, G. Lapertot, F. Bourdarot, C. Marin, D. Aoki, and M. Hanfland,J. Phys.: Condens. Matter 21, 232202共2009兲.
4B. C. Sales, A. S. Sefat, M. A. McGuire, R. Y. Jin, D. Mandrus,
5K.-W. Yeh, T. W. Huang, Y. L. Huang, T. K. Chen, F. C. Hsu, P.
M. Wu, Y. C. Lee, Y. Y. Chu, C. L. Chen, J. Y. Luo, D. C. Yan, and M. K. Wu, EPL 84, 37002 共2008兲; M. H. Fang, H. M. Pham, B. Qian, T. J. Liu, E. K. Vehstedt, Y. Liu, L. Spinu, and Z. Q. Mao,Phys. Rev. B 78, 224503共2008兲.
6Assuming that the additional iron atoms sitting on Fe2 sites
be-tween the Se/Te atoms do not constitute a charge reservoir.
7W. Bao, Y. Qiu, Q. Huang, M. A. Green, P. Zajdel, M. R.
Fitzsimmons, M. Zhernenkov, S. Chang, M. Fang, B. Qian, E. K. Vehstedt, J. Yang, H. M. Pham, L. Spinu, and Z. Q. Mao,
Phys. Rev. Lett. 102, 247001共2009兲.
8Y. Qiu, W. Bao, Y. Zhao, C. Broholm, V. Stanev, Z. Tesanovic,
Y. C. Gasparovic, S. Chang, J. Hu, B. Qian, M. Fang, and Z. Mao,Phys. Rev. Lett. 103, 067008共2009兲; M. D. Lumsden, A. D. Christianson, E. A. Goremychkin, S. E. Nagler, H. A. Mook, M. B. Stone, D. L. Abernathy, T. Guidi, G. J. MacDougall, C. de la Cruz, A. S. Sefat, M. A. McGuire, B. C. Sales, and D. Man-drus,Nat. Phys. 6, 182共2010兲.
9A. Martinelli, A. Palenzona, M. Tropeano, C. Ferdeghini, M.
Putti, M. R. Cimberle, T. D. Nguyen, M. Affronte, and C. Ritter,
Phys. Rev. B 81, 094115共2010兲.
10A. Tamai, A. Y. Ganin, E. Rozbicki, J. Bacsa, W. Meevasana, P.
D. C. King, M. Caffio, R. Schaub, S. Margadonna, K. Prassides, M. J. Rosseinsky, and F. Baumberger, Phys. Rev. Lett. 104, 097002共2010兲.
11H. Lei, R. Hu, E. S. Choi, J. B. Warren, and C. Petrovic,Phys.
Rev. B 81, 094518 共2010兲; T. Kida, T. Matsunaga, M. Hagi-wara, Y. Mizuguchi, Y. Takanoe, and K. Kindo,J. Phys. Soc. Jpn. 78, 113701共2009兲.
12M. H. Fang, J. H. Yang, F. F. Balakirev, Y. Kohama, J. Singleton,
B. Qian, Z. Q. Mao, H. D. Wang, and H. Q. Yuan,Phys. Rev. B
81, 020509共2010兲.
13D. Braithwaite, G. Lapertot, W. Knafo, and I. Sheikin,J. Phys.
Soc. Jpn. 79, 053703共2010兲.
14A. Serafin, A. I. Coldea, A. Y. Ganin, M. J. Rosseinsky, K.
Prassides, D. Vignolles, and A. Carrington, Phys. Rev. B 82, 104514共2010兲.
15Z. Pribulova, T. Klein, J. Kacmarcik, C. Marcenat, M.
Konc-zykowski, S. L. Budko, M. Tillman, and P. C. Canfield, Phys. Rev. B 79, 020508共2009兲.
16C. S. Yadav and P. L. Pauloose,New J. Phys. 11, 103046共2009兲. 17M. Bendele, S. Weyeneth, R. Puzniak, A. Maisuradze, E.
Pom-jakushina, K. Conder, V. Pomjakushin, H. Luetkens, S. Katrych, A. Wisniewski, R. Khasanov, and H. Keller, Phys. Rev. B 81, 224520共2010兲.
18H. Kim, C. Martin, R. T. Gordon, M. A. Tanatar, J. Hu, B. Qian,
Z. Q. Mao, R. Hu, C. Petrovic, N. Salovich, R. Giannetta, and R. Prozorov,Phys. Rev. B 81, 180503共R兲 共2010兲.
19S. L. Bud’ko, N. Ni, and P. C. Canfield, Phys. Rev. B 79,
220516共R兲 共2009兲.
20J. Paglione and R. L. Greene,Nat. Phys. 6, 645共2010兲. 21T. J. Liu, X. Ke, B. Qian, J. Hu, D. Fobes, E. K. Vehstedt, H.
Pham, J. H. Yang, M. H. Fang, L. Spinu, P. Schiffer, Y. Liu, and Z. Q. Mao,Phys. Rev. B 80, 174509共2009兲.
22R. Prozorov and R. W. Giannetta,Supercond. Sci. Technol. 19,
R41共2006兲.
23J. P. Brison, N. Keller, A. Verniere, P. Lejay, L. Schmidt, A.
Buzdin, J. Flouquet, S. R. Julian, and G. G. Lonzarich,Physica C 250, 128共1995兲.
24S. T. Ruggiero, T. W. Barbee, and M. R. Beasley, Phys. Rev.
Lett. 45, 1299共1980兲; C. Uher, J. L. Cohn, and I. K. Schuller,
Phys. Rev. B 34, 4906共1986兲.
25S. I. Vedeneev, C. Proust, V. P. Mineev, M. Nardone, and G. L.
J. A. Rikken,Phys. Rev. B 73, 014528共2006兲.
26Note that the zero-temperature extrapolations of the fields
de-duced from GL expansions always overestimate the experimen-tal values.
27Note that we could expect to observe a dimensional crossover at
a temperature Tⴱ for which
c共Tⴱ兲 ⬃ c /
冑
2 with Hcab2=
冑
3⌽0/dab⬀共1 − T / Tc兲0.5for T ⬍ Tⴱ关taking ab= ab共0兲 ⫻ 共1− T / Tc兲−0.5兴. This crossover is however hindered by the Pauli
field HpⰆ Hc2D2⬃ 2600⫻ 共1 − T / Tc兲0.5.
28M. Aichhorn, S. Biermann, T. Miyake, A. Georges, and M.
Imada,Phys. Rev. B 82, 064504共2010兲.
29T. Hanaguri, S. Niitaka, K. Kuroki, and H. Takagi,Science 328,
474共2010兲.
30T. Kato, Y. Mizuguchi, H. Nakamura, T. Machida, H. Sakata,
and Y. Takano,Phys. Rev. B 80, 180507共R兲 共2009兲.
31H
pis expected to be enhanced by a factor 共1 + e-ph兲⑀ in the
strong-coupling limit where e-ph is the electron-phonon
cou-pling constant and ⑀ is an exponent ranging from 0.5 to 1, T. P. Orlando, E. J. McNiff, Jr., S. Foner, and M. R. Beasley,Phys. Rev. B 19, 4545共1979兲; M. Schossmann and J. P. Carbotte,ibid.
39, 4210共1989兲.
32J. Kacmarcik, C. Marcenat, T. Klein, Z. Pribulova, C. J. van der
Beek, M. Konczykowski, S. L. Budko, M. Tillman, N. Ni, and P. C. Canfield,Phys. Rev. B 80, 014515共2009兲.
33G. Blatter, M. V. Feigelman, V. B. Geskenbein, A. I. Larkin, and
V. M. Vinokur,Rev. Mod. Phys. 66, 1125共1994兲.
34R. Okazaki, M. Konczykowski, C. J. van der Beek, T. Kato, K.
Hashimoto, M. Shimozawa, H. Shishido, M. Yamashita, M. Ish-ikado, H. Kito, A. Iyo, H. Eisaki, S. Shamoto, T. Shibauchi, and Y. Matsuda,Phys. Rev. B 79, 064520共2009兲.
35E. H. Brandt,Phys. Rev. B 59, 3369共1999兲.
36P. K. Biswas, G. Balakrishnan, D. M. Paul, C. V. Tomy, M. R.
Lees, and A. D. Hillier,Phys. Rev. B 81, 092510共2010兲.
37J. Uemura, G. M. Luke, B. J. Sternlieb, J. H. Brewer, J. F.
Caro-lan, W. N. Hardy, R. Kadono, J. R. Kempton, R. F. Kiefl, S. R. Kreitzman, P. Mulhern, T. M. Riseman, D. L. Williams, B. X. Yang, S. Uchida, H. Takagi, J. Gopalakrishnan, A. W. Sleight, M. A. Subramanian, C. L. Chien, M. Z. Cieplak, G. Xiao, V. Y. Lee, B. W. Statt, C. E. Stronach, W. J. Kossler, and X. H. Yu,
Phys. Rev. Lett. 62, 2317共1989兲.
38P. Diener, P. Rodière, T. Klein, C. Marcenat, J. Kacmarcik, Z.
Pribulova, D. J. Jang, H. S. Lee, H. G. Lee, and S. I. Lee,Phys. Rev. B 79, 220508共2009兲.
39K. Hashimoto, A. Serafin, S. Tonegawa, R. Katsumata, R.
Oka-zaki, T. Saito, H. Fukazawa, Y. Kohori, K. Kihou, C. H. Lee, A. Iyo, H. Eisaki, H. Ikeda, Y. Matsuda, A. Carrington, and T. Shibauchi,Phys. Rev. B 82, 014526共2010兲.
40V. Tsurkan, J. Deisenhofer, A. Gunther, C. Kant, H. Krug von
Nidda, F. Schrettle, and A. Loidl, arXiv:1006.4453 共unpub-lished兲.
41T. J. Liu, J. Hu, B. Qian, D. Fobes, Z. Q. Mao, W. Bao, M.
Reehuis, S. A. J. Kimber, K. Prokes, S. Matas, D. N. Argyriou, A. Hiess, A. Rotaru, H. Pham, L. Spinu, Y. Qiu, V. Thampy, A. T. Savici, J. A. Rodriguez, and C. Broholm, Nature Mater. 9, 718共2010兲.
42G. F. Chen, Z. G. Chen, J. Dong, W. Z. Hu, G. Li, X. D. Zhang,
P. Zheng, J. L. Luo, and N. L. Wang, Phys. Rev. B 79,
THERMODYNAMIC PHASE DIAGRAM OF Fe共Se0.5Te0.5兲… PHYSICAL REVIEW B 82, 184506共2010兲
140509共R兲 共2009兲.
43C. C. Homes, A. Akrap, J. S. Wen, Z. J. Xu, Z. W. Lin, Q. Li,
and G. D. Gu,Phys. Rev. B 81, 180508共2010兲.
44B. Zeng, G. Mu, H. Luo, T. Xiang, H. Yang, L. Shan, C. Ren, I.
Mazin, P. Dai, and H. Wen,arXiv:1007.3597共unpublished兲.
45H. Adachi, M. Ichiode, and K. Machidaz,J. Phys. Soc. Jpn. 74,
2181 共2005兲; M. Ichioka and K. Machida, Phys. Rev. B 76, 064502共2007兲.
46H. Aoki, T. Sakakibara, H. Shishido, R. Settai, Y. Onuki, P.
Mira-novi, and K. Machida, J. Phys.: Condens. Matter 16, L13 共2004兲; K. Deguchi, S. Yonezawa, S. Nakatsuji, Z. Fisk, and Y. Maeno,J. Magn. Magn. Mater. 310, 587共2007兲.
47S. NishiZaki, Y. Maeno, and Z. Mao,J. Phys. Soc. Jpn. 69, 572
共2000兲.
48V. G. Kogan,Phys. Rev. B 80, 214532共2009兲.
49R. T. Gordon, H. Kim, M. A. Tanatar, R. Prozorov, and V. G.