HAL Id: in2p3-01024125
http://hal.in2p3.fr/in2p3-01024125
Submitted on 20 Mar 2020
HAL is a multi-disciplinary open access archive for the deposit and dissemination of sci-entific research documents, whether they are pub-lished or not. The documents may come from teaching and research institutions in France or abroad, or from public or private research centers.
L’archive ouverte pluridisciplinaire HAL, est destinée au dépôt et à la diffusion de documents scientifiques de niveau recherche, publiés ou non, émanant des établissements d’enseignement et de recherche français ou étrangers, des laboratoires publics ou privés.
Implementation of an imaging spectrometer for
localization and identification of radioactive sources
H. Lemaire, R. Abou Khalil, K. Amgarou, J.C. Angélique, Fabrice Bonnet, D.
de Toro, F. Carrel, O. Giarmana, M. Gmar, N. Menaa, et al.
To cite this version:
H. Lemaire, R. Abou Khalil, K. Amgarou, J.C. Angélique, Fabrice Bonnet, et al.. Implementation of an imaging spectrometer for localization and identification of radioactive sources. Nuclear Instruments and Methods in Physics Research Section A: Accelerators, Spectrometers, Detectors and Associated Equipment, Elsevier, 2014, 763, pp.97-103. �10.1016/j.nima.2014.05.118�. �in2p3-01024125�
1
Implementation of an Imaging Spectrometer for Localization and
1
Identification of Radioactive Sources
2 3
H. Lemairea, R. Abou Khalilb, K. Amgaroub, J.-C. Angéliquec, F. Bonnetd,
4
D. De Torob, F. Carrela, O. Giarmanad, M. Gmara, N. Menaab, Y. Menesguena,
5
S. Normanda, A. Patozd, V. Schoepffa, P. Talentd, T. Timib 6
7
aCEA, LIST, Gif-sur-Yvette, F-91191, France
8
bCANBERRA, 1 rue des hérons, Saint-Quentin-en-Yvelines, F-78182, France
9
cLPC, 6 boulevard du Maréchal Juin, F-14050, France
10
dCANBERRA, 10 route de Vauzelles, Loches, F-37600, France
11 12
Corresponding author: H. Lemaire, hermine.lemaire@cea.fr
13 Telephone: 0033 1 69 08 35 75 14 15 Abstract 16 17
Spatial localization of radioactive sources is currently a main issue interesting nuclear 18
industry as well as homeland security applications and can be achieved using gamma 19
cameras. For several years, CEA LIST has been designing a new system, called GAMPIX, 20
with improved sensitivity, portability and ease of use. The main remaining limitation of this 21
system is the lack of spectrometric information, preventing the identification of radioactive 22
materials. This article describes the development of an imaging spectrometer based on the 23
GAMPIX technology. Experimental tests have been carried out according to both 24
spectrometric methods enabled by the pixelated Timepix chip used in the GAMPIX gamma 25
camera. The first method is based on the size of the impacts produced by a gamma-ray energy 26
deposition in the detection matrix. The second one uses the Time over Threshold (ToT) mode 27
of the Timepix chip and deals with time spent by pulses generated by charge preamplifiers 28
over a user-specified threshold. Both energy resolution and sensitivity studies demonstrated 29
the superiority of the ToT approach which will consequently be further explored. Energy 30
calibration, tests of different pixel sizes for the Timepix chip and use of the Medipix3 chip are 31
future milestones to improve performances of the newly implemented imaging spectrometer. 32
33
Keywords 34
35
Gamma imaging; GAMPIX; Timepix; imaging spectrometer; Time over Threshold
36 37
1. Introduction
38
Spatial localization of radioactive sources is currently a main issue interesting nuclear 39
industry (nuclear power plants security, decommissioning of nuclear facilities, radiation-40
protection) as well as homeland security applications (controls, post-accidental interventions) 41
2 [1] [2]. Gamma imaging is a very interesting technique to achieve this spatial localization by 42
enabling superimposition of visible and gamma pictures using dedicated devices called 43
gamma cameras. 44
Spatial localization can be achieved using Compton scattering or coded masks. Compton 45
approach includes two steps: the scattering of the incident photon and its full absorption. 46
From the path of each incident photons one can determine cones from which it could have 47
been emitted. The radioactive source is located at the intersection of all the rebuilt cones. Two 48
sensors are usually involved in these systems but gamma cameras based on a single sensor 49
also exist. We can give the example of the recently industrialized Polaris-H system [3] [4]. In 50
this new gamma camera, the depth of interaction required to determine the path is obtained 51
from the cathode-to-anode signal ratio (CAR) or from drift time information. Because photons 52
have to deposit energy in two successive detectors, the Compton approach is mainly dedicated 53
to photons above 200 keV [3]. In the rest of the article, we will focus on gamma cameras 54
using coded masks. 55
Current industrial gamma cameras based on coded masks can be considered as first generation 56
because they are based on scintillator detectors. Much progress was made since the design of 57
the first gamma camera by Hal Anger (Berkeley University, California) in the last’s 50 for 58
medical applications [5]: digitalization of data processing [6], replacement of the pinholes 59
used for spatial localization (CARTOGAM, CEA LIST [7]) by multiple hole collimators 60
(Fixed Multiple hole Collimated Camera, University of Michigan [8]) and MURA coded 61
masks (RadCam, Radiation Monitoring Devices Inc. [9]), etc. In the 90’s, continuous 62
scintillators moved into pixelated scintillators (CSPD-2, University of Michigan [10]; RMD-63
Pinhole, Radiation Monitoring Devices Inc. [11]). At the same time, semiconductor detectors 64
were developed [6]. Such detectors intended to improve both spatial and energy resolution by 65
enabling direct conversion from gamma photons to electrical charge. First gamma cameras 66
integrating semiconductor detectors present some limitations because of small detection 67
surfaces resulting in small fields of view ([12, 13]) and obligation of cooling the detector 68
when using materials such as germanium [12]. The progressive development of pixelated 69
CdTe or CdZnTe substrates hybridized to ASICs [14, 15, 16, 17] opened the way to a second 70
generation of gamma cameras operating at room temperature. 71
In this context, CEA LIST designed a second generation system, named GAMPIX [1, 18, 19]. 72
GAMPIX’s body integrates three main building blocks: 73
The detection system is a 1 mm thick CdTe substrate bump-bonded to a pixelated readout 74
chip called Timepix [17] and developed by the CERN. In 1.4 cm², the Timepix chip integrates 75
256 pixels by 256 pixels, 55 µm side, with independent shaping and processing chains. 76
In front of the detection system, the coded mask in tungsten alloy is used as a multi pinhole 77
collimator for spatial localization [20]. It is characterized by its number of holes (rank) and its 78
thickness. 79
Finally, the USB module enables plug-and-play connection of the gamma camera with the 80
acquisition laptop [21] and remote measurements. 81
3 GAMPIX is currently under industrialization by AREVA CANBERRA (the industrial system 82
is named iPix, see Fig. 1). Compared to CARTOGAM, which is the current AREVA 83
CANBERRA industrial system, GAMPIX presents three main improvements: 84
The first one is the low-energy (below 100 keV) sensitivity with a gain of five decades in 85
comparison with CARTOGAM. GAMPIX is able to detect in 1 s a 241Am radioactive source 86
generating a dose rate of 0.25 µSv.h-1 in the vicinity of the gamma camera. For this reason,
87
GAMPIX is a performing tool for plutonium detection during decommissioning operations 88
(241Ambeing a feature of the presence of plutonium). GAMPIX efficiency decreases at high 89
energy because of both the small detection volume (0.1982 cm3 of CdTe against 5 cm3 of 90
CsI(Tl) for CARTOGAM) and the non-perfect filtering achieved by the coded mask. For this 91
reason, 20 s are needed to detect a 137Cs radioactive source with 2.5 µSv.h-1 dose rate and 60 s
92
for a 60Co source giving a dose rate of 3.8 µSv.h-1. However, it is important to emphasize that, 93
by adapting the characteristics of the coded mask, GAMPIX is able to cover an energy range 94
from 241Am to 60Co with better performances than CARTOGAM even at high energy (see [1] 95
for results obtained in Nuclear Power Plants). 96
The second point is the portability facilitated by the reduction of the weight. CARTOGAM, 97
which is the lightest system currently on the market, and GAMPIX respectively weight 15 kg 98
and 2 kg. The difference is mainly due to the shielding required by the scintillation detector of 99
CARTOGAM. 100
Finally, the third point deals with the ease of use and deployment of GAMPIX in comparison 101
with CARTOGAM. GAMPIX uses for instance only one cable for camera management, data 102
transmission and power supply. 103
Besides, GAMPIX has a field of view of 50°. The angular resolution, which refers to the 104
minimal angle between two radioactive sources to be separated in the decoded image, reaches 105
down to 2° for a 241Am radioactive source. 106
GAMPIX applications benefit from its characteristics. Thanks to its great portability, it can 107
easily be deployed in nuclear power plants in order to control, for instance, the correct 108
position of lead shielding dedicated to the radiation protection of operators. Regarding nuclear 109
facilities decommissioning, GAMPIX is able to provide an accurate localization of hot spots 110
(for instance, in pipes) for targeted decommissioning enabling both reduction of operations 111
duration and waste volume to be stored. The sensitivity of GAMPIX and its easy deployment 112
by non-expert end-users enable its use for fast control of luggage (airports) and containers 113
(ports) for homeland security applications. Finally, for post-accidental interventions, 114
GAMPIX can help the first responders to quickly identify dangerous areas in Fukushima type 115
environments. Experimental results illustrating these applications can be found in the 116
Reference [1]. 117
In its current version, the main limitation of the GAMPIX gamma camera is the lack of 118
spectrometric information, preventing the identification of radioactive material. Thus, dose 119
rate calculation needs an assumption on the nature of radionuclides and it is impossible to 120
identify different radionuclides simultaneously present in the environment. Considering this 121
limitation, it was decided to add new spectrometric capabilities to the GAMPIX gamma 122
camera to achieve an imaging spectrometer. 123
4 The Timepix chip offers two approaches for performing spectrometry measurements. The first 124
one is based on the average size of the clusters which directly depends on the energy of the 125
incident gamma-ray. As an example, the average cluster size is contained for a given Timepix 126
energy threshold between 2.8 pixels for a 241Am source and 7.0 pixels for a 60Co source. The 127
incident average energy can thus be deduced from the average cluster size. The second 128
approach uses the Timepix Time over Threshold (ToT) mode [17, 22, 23]. By setting a 129
threshold on pulses obtained at the output of charge sensitive preamplifiers, ToT mode 130
measures the time spent by the pulses over the threshold, which is directly dependent on the 131
incident gamma-ray energy. Conversion between cluster sizes or ToT values and energy can 132
be achieved using reference radioactive sources or monoenergetic beams. 133
The purpose of this article is to demonstrate the ability of the GAMPIX system to provide 134
spectrometric information. Qualitative and quantitative evaluation of its performances 135
regarding this purpose will be presented. The first part of the document is dedicated to the 136
preliminary setting of the Timepix chip and to the description of the required analysis tools. In 137
the second part, methodology for implementing the imaging spectrometer and evaluation 138
criteria of the final system are presented. Finally, the last part summarizes experimental 139
results obtained in the frame of this study. 140
2. Settings of the Timepix chip and analysis tools
141
Fine tuning of the Timepix chip settings was crucial prior the implementation of the imaging 142
spectrometer. It aims at optimizing both energy resolution and gain. Settings and data 143
acquisition were performed using the Pixelman interface developed in the Czech Technical 144
University of Prague [24]. First, threshold equalization with “noise edge” method was carried 145
out to minimize dispersion around the average threshold value caused by gain differences 146
between pixels. Then, a parametric study on the thirteen chip parameters showed that the Ikrum
147
DAC had the greatest influence on both energy gain and energy resolution [25]. The Ikrum
148
current both controls falling times of pulses generated by charge preamplifiers and 149
compensates leakage currents (within the limit of Ikrum/2). All parameters were finally set to
150
their default value, except Ikrum which was set to the DAC code value 2 corresponding to a
151
falling time in the order of 1 µs [26]. It is important to notice that the pile-up is limited with 152
such a value. The substrate bias voltage has to be high enough (in absolute value) to minimize 153
charge spreading and charge trapping which is a drawback of CdTe. In our case, bias voltage 154
was set to -110 V. Conversion between ToT values and energy can be done by mean of a 155
calibration curve [27-28]. This curve is mostly linear, except at very low energy (just above 156
the threshold set on the pulses). Energy calibration also aims at optimizing energy resolution 157
by correcting the shift between peaks due to clusters of different sizes (Fig. 2). In this study, 158
we tested our imaging spectrometer without energy calibration but directly with ToT values. 159
It is important to emphasize on the fact that energy resolution improvement given by the 160
energy calibration step was not crucial for these measurements because gamma-ray spectra 161
coming from the different studied radionuclides have a typical signature (Table I). 162
Data processing was performed with dedicated MATLAB software developed by CEA LIST. 163
This software implements processing functions dealing with both spectrometric approaches 164
5 tested in the imaging spectrometer. Concerning cluster size, the software identifies clusters as 165
set of neighboring pixels. A maximal allowed cluster size can be set by the user to remove 166
cosmic rays, size of which commonly exceeds 20 pixels. It is important to set a low enough 167
acquisition time per frame to avoid pile-up which would lead to non-physical clusters 168
resulting from the sum of successive close events. Cluster size histograms giving the number 169
of occurrences depending on the cluster size are finally plotted. As far as ToT mode is 170
concerned, the software sums ToT values of all pixels forming a cluster. If energy calibration 171
has been achieved, energy conversion is done before summation. Spectra giving the number 172
of occurrences as a function of ToT values are finally plotted. The software also achieves 173
spatial reconstruction from the coded mask projection on the detection matrix. Spatial 174
reconstruction can be focused on a given cluster size windowing or ToT windowing specified 175
by the user. This functionality will be used for the implementation of the imaging 176
spectrometer as presented in section III. 177
3. Implementation of the imaging spectrometer and evaluation criteria
178
To demonstrate the feasibility of an imaging spectrometer based of the GAMPIX gamma 179
camera, it was decided to develop a device achieving a selective spatial reconstruction 180
depending on the energy of incident photon (via cluster size and ToT values). This device was 181
tested with four radioactive sources covering the energy range of interest for the GAMPIX 182
system (see Table I). Performances of both spectrometric approaches in terms of 183
discrimination capability, and comparison with the GAMPIX gamma camera in its current 184
version in terms of sensitivity were assessed. The first part of this section is dedicated to the 185
methodology used for the implementation of the imaging spectrometer while the second part 186
justifies the choice of evaluation criteria. 187
3.1 Implementation of the imaging spectrometer
188
Implementation of the imaging spectrometer according to both cluster size and ToT values 189
approaches is based on windowing. Cluster size windowing requires a preliminary 190
measurement with each radionuclide taken alone. From the cluster size histograms, mean 191
cluster size, dispersion around the mean and overlapping between radionuclides are evaluated. 192
The first spatial reconstruction is performed on the single mean cluster size. Then, the 193
windowing is progressively broadened and the best configuration is determined by 194
qualitatively evaluated spatial reconstructions. To appreciate differences between cluster size 195
histograms, Fig. 3 shows histograms of 241Am and 60Co radioactive sources and Table II gives 196
mean cluster size and percentage of clusters in different ranges for the four radionuclides 197
tested. Table III summarizes the cluster size windowing chosen for best discrimination. To 198
avoid overlapping between radionuclides, mean cluster size and most frequent cluster sizes 199
are not necessarily included in the windowing. 200
Concerning ToT windowing, a preliminary measurement with each radionuclide taken alone 201
is also required to identify in the spectra ToT values associated with typical features 202
(photoelectric peaks, Compton edge, etc.) Spectra obtained with each radionuclide are then 203
compared to determine if there is overlapping due to the energy resolution of the sensor. The 204
6 first windowing is centered on typical features and the best windowing is finally obtained by 205
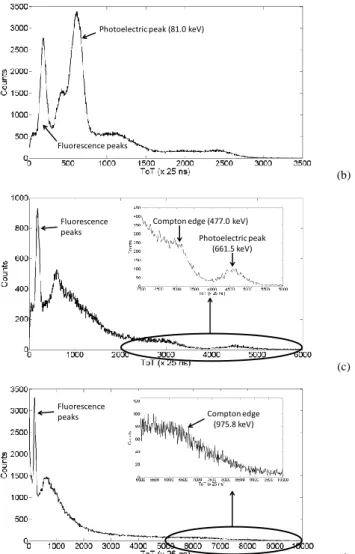
sequential approach. Typical features of the four radionuclides studies and position of the 206
windowing are shown in Fig. 4. All ToT spectra obtained are in good agreement with 207
previous literature results [27] and show the ability of the ToT mode to provide useful 208
gamma-ray spectra, even at high energy (137Cs and 60Co). One can notice the large fraction of 209
events on the fluorescence and escape peaks. It is explained by the pixelation of the detector: 210
it is unusual that both incident photon and fluorescence photon deposit their energy in the 211
same 55-µm-side pixel. Table IV summarizes ToT windowing for all tested radionuclides. 212
Because of overlapping, windowing does not necessarily include typical features. 213
3.2 Evaluation criteria
214
The first evaluation criterion of imaging spectrometer performances is the discrimination 215
ability, which is qualitatively evaluated from spatial reconstructions. If radionuclides with 216
different gamma-ray emissions are simultaneously present in the field of view, the 217
discrimination ability characterizes the ability of the system to reconstruct only radioactive 218
sources included in a given energy range. 219
The second evaluation criterion is the sensitivity, which corresponds to the minimal duration 220
required for detecting a radionuclide inducing a given dose rate near the gamma camera. The 221
sensitivity corresponds to a picture free of artifacts, as shown in Fig. 5 (b). Three parameters 222
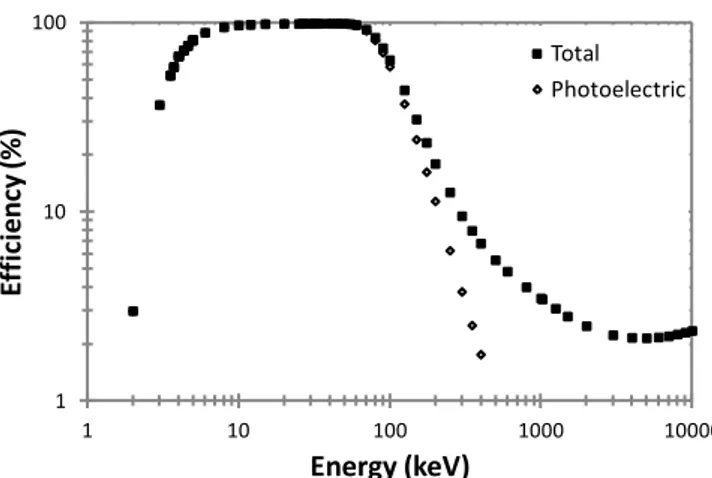
have a great impact on the sensitivity. The first one is the detector efficiency. It decreases 223
when the incident gamma-ray energy increases as shown in Fig. 6. For a 1-mm-thick CdTe 224
detector, efficiency drastically decreases from 100 keV. The second factor is the coded mask 225
and its characteristics. A tradeoff has to be found between thickness (sensitivity) and number 226
of holes (i.e. the rank, which defines the angular resolution). The last factor is the energy 227
windowing. Without windowing (standard working mode for the GAMPIX gamma camera), 228
all photons hitting the detector are taken into account. The narrower windowing is, the fewer 229
photons are considered, and the more sensitivity is decreased. 230
4. Performances of the imaging spectrometer
231
Performances according to both evaluation criteria presented in section III are successively 232
presented. All acquisitions were performed in “Time over Threshold” mode and in “frame” 233
type with 1 s acquisition per frame. They were repeated three times to control reproducibility. 234
4.1 Discrimination ability
235
To evaluate discrimination capability, radioactive sources were disposed two or three at a 236
time in front of the gamma camera over a graduated table. Tests were carried out for distance 237
between radioactive sources and GAMPIX gamma camera varying between 50 cm and 238
150 cm on the camera axis and between 0 and 50 cm on each side of the camera on the 239
perpendicular axis. Acquisition time was set between 300 s and 2000 s depending on 240
configurations tested. 241
7 Table V shows pictures obtained after both cluster size windowing and ToT windowing for a 242
1500 s acquisition with 241Am, 133Ba and 137Cs radioactive sources positioned in the 243
configuration illustrated in Fig. 7. Both approaches are efficient for 241Am and 137Cs 244
discrimination but cluster size windowing is unable to separate 133Ba from 241Am. 137Cs also 245
appears less punctual for cluster size configuration and there are more artifacts on 241Am 246
picture. All tested configurations proved the superiority of ToT approach on cluster size 247
approach regarding this evaluation criterion. 248
Three factors explain this superiority. First, spectra of the four radionuclides tested are well 249
differentiated contrary to cluster size plots: centroid of photoelectric peaks varies from about 250
500 to 4500 from 241Am to 60Co (Fig. 4), while mean cluster size only changes from about 3 251
to 7 (Table III). Secondly, the 11810 channels of the counting system in ToT mode are great 252
enough to show these differences. Finally, ToT mode enables to carry out fine spectrometry 253
measurements while cluster size mode only deals with mean energy values. 254
4.2 Sensitivity
255
During our experiments, sensitivity was determined for each source placed at 1 m from the 256
gamma camera in the camera axis, without windowing, with cluster size windowing and with 257
ToT windowing. Several configurations of the mask were tested. We were looking for the loss 258
of sensitivity induced by the spectro-imaging mode for both spectrometric approaches with 259
respect to the GAMPIX gamma camera in its current version. 260
Tables VI to VIII summarize sensitivity for all radionuclides tested without windowing 261
(GAMPIX gamma camera in its current version) and with cluster size and ToT windowing for 262
several configurations of the coded mask. Percentages below the values indicate the loss of 263
sensitivity due to both windowing techniques. 264
Several conclusions can be drawn from these results. Concerning coded masks, the one of 265
rank 7 with a thickness of 4 mm produces best results for energies under 100 keV (241Am, 266
133Ba), while mask of rank 7 with a thickness of 8 mm is more efficient for higher energies
267
(137Cs, 60Co). Rank 13 offers better performances than rank 7 in terms of spatial resolution but 268
is less efficient in terms of sensitivity. Two millimeters appears to be a too-thin thickness for 269
each of the tested radionuclides, especially for high-energy gamma-ray emissions. In the case 270
of unknown searched radionuclides, coded mask of rank 7 with a thickness of 4 mm offers the 271
best tradeoff. 272
Concerning energy windowing, it causes a loss of sensitivity greater than 20% in most cases, 273
which is explained by the little fraction of events occurring in the sensor and finally selected 274
for spatial reconstruction. For low energies, this sensitivity loss is not a real problem because 275
of very small acquisition times required by the GAMPIX gamma camera (from 1 s to 2 s for 276
241Am with rank 7 and thickness of 8 mm for the coded mask). For higher energies, loss can
277
be limited by the choice of the most adapted mask. Best sensitivities are obtained for ToT 278
windowing in comparison with cluster size windowing. Degraded results with 60Co are 279
explained by photoelectric peak spreading due to the high mean cluster size (7) and to the 280
dispersion around this value which causes shifts between photoelectric peaks. 281
8
5. Conclusion and outlook
282
The purpose of our study was to demonstrate the feasibility of an imaging spectrometer based 283
on the GAMPIX gamma camera and to evaluate its performances. Two methods were tested 284
to implement this imaging spectrometer: cluster size and ToT approaches. Tests on 285
discrimination ability and sensitivity both proved the feasibility of such a device and the 286
superiority of ToT approach. Loss of sensitivity with ToT approach is greater than 20%. If it 287
is not a problem for low energies, a relevant choice of the mask can mitigate this drawback 288
for energies higher than 100 keV. If the radionuclide is unknown, the coded mask of rank 7 289
with a thickness of 4 mm offers the best compromise. 290
Further developments of the imaging spectrometer will combine both cluster size and ToT 291
spectrometric approaches. Next planned step is the integration of the energy calibration in the 292
imaging spectrometer for the analysis of closer gamma-ray energies. Because of the high 293
mean cluster size, improvements are also expected for high energies (60Co). Energy 294
calibration measurements should take place at the SOLEX facility which provides 295
monoenergetic beams from 0.5 keV to 28 keV [30]. As a first step, we plan the global 296
calibration of the Timepix chip. Improvements of the energy resolution of a factor between 297
two and four are reported by [26] with a pixel by pixel calibration and this approach will be 298
considered as a second step. Test of a 1 mm thick, 110 µm pixel side Timepix chip is also 299
expected. It would enable to evaluate the energy resolution gain due to the limitation of 300
charge sharing between several pixels, which is one of the main explanations for energy 301
resolution degradation. 302
Finally, the replacement of the Timepix chip by a Medipix3 chip will be studied. The ToT 303
mode is not implemented in the Medipix3 chip and spectra have to be obtained by counting 304
the number of events for each threshold value [31]. The main improvement compared to 305
previous Medipix chips concerns the hardware connection between several neighboring 306
pixels, which should drastically improve the energy resolution of the system. 307
308
References
309 310
[1] F. Carrel, et al., “GAMPIX: a New Gamma Imaging System for Radiological Safety and 311
Homeland Security Purposes”, IEEE NSS Conference Record, 2011. 312
[2] V. Schoepff, et al., “BOOSTER: Development of a Toolbox for Triage of Large Group of 313
Individuals Exposed to Radioactive Material”, accepted for publication in IEEE 314
Transactions on Nuclear Science, 2014.
315
[3] W. Kaye, et al., “Calibration and Operation of the Polaris 18-Detector CdZnTe Array”, 316
IEEE, 2010.
317
[4], “Polaris-H Gamma-Ray Imaging Spectrometer”, presentation brochure. 318
[5] H.O. Anger, “Scintillation Camera”, The review of scientific instruments, vol. 29, num. 1, 319
1958. 320
[6] M. Ricard, “Imaging of gamma emitters using scintillation cameras”, Nucl. Instrum. 321
Methods Phys. Res. A, vol. 527, pp. 124-129, 2004.
9 [7] O. Gal, et al., “CARTOGAM – a portable gamma camera for remote localization of 323
radioactive sources in nuclear facilities”, Nucl. Instrum. Methods Phys. Res. A, vol. 460, 324
pp. 138-145, 2001. 325
[8] S.V. Guru, et al., “A high energy gamma camera using a multiple hole collimator and 326
PSPMT”, Nucl. Instrum. Methods Phys. Res. A, vol. 353, pp. 328-333, 1994. 327
[9] M. Woodring, et al., “Advanced radiation imaging of low-intensity gamma-ray sources”, 328
Nucl. Instrum. Methods Phys. Res. A, vol. 422, pp. 709-712, 1999.
329
[10] Z. He, et al., “The CSPD-2 Gamma-Ray Imaging System”, IEEE TNS, vol. 44, num. 3, 330
1997. 331
[11] R. Redus, et al., “A combined video and gamma ray imaging system for robots in nuclear 332
environments”, Nucl. Instrum. Methods Phys. Res. A, vol. 353, pp. 324-327, 1994. 333
[12] V.R. McCready, et al., “Clinical tests on a prototype semiconductor gamma-camera”, 334
British Journal of Radiology, vol. 44, pp. 58-62, 1971.
335
[13] Y. Eisen, et al.., “A gamma camera based on CdTe detector”, Nucl. Instrum. Methods 336
Phys. Res. A, vol. 380, pp. 474-478, 1996.
337
[14] Z. He, et al., “3-D position sensitive CdZnTe gamma-ray spectrometers”, Nucl. Instrum. 338
Methods Phys. Res. A, vol. 422, pp. 173-178, 1999.
339
[15] C. Mestais, et al., “A new design for a high resolution, high efficiency CZT gamma 340
camera detector”, Nucl. Instrum. Methods Phys. Res. A, vol. 458, pp. 62-67, 2001. 341
[16] O. Limousin, et al., “Caliste 256: A CdTe imaging spectrometer for space science with a 342
580 µm pixel pitch”, Nucl. Instrum. Methods Phys. Res. A, vol. 647, pp. 46-54, 2011. 343
[17] X. Llopart, et al., “Timepix, a 65k programmable pixel readout chip for arrival time, 344
energy and/or photon counting”, Nucl. Instrum. Methods Phys. Res. A, vol. 581, pp. 485-345
494, 2007. 346
[18] M. Gmar, et al., “GAMPIX: a new generation of gamma camera”, Nucl. Instrum. 347
Methods Phys. Res. A, Vol. 652, pp. 638-640, 2011.
348
[19] F. Carrel, et al., “GAMPIX: a new generation of gamma camera for hot spot 349
localisation”, Proceedings of the ISOE Conference, Cambridge, 2010. 350
[20] S. R. Gottesman and E. E. Fenimore, “New family of Binary Arrays for Coded Aperture 351
Imaging”, Applied Optics, Vol. 28, n. 20, pp. 4344-4352, 1989. 352
[21] Z. Vykydal, “Microprocessor controlled USB interface for Medipix2 detector”, Ph.D. 353
dissertation, Department of Physical Electronics, Czech Technical University, Prague,
354
Poland, 2004-2005. 355
[22] D. Maneuski, et al., “Imaging and spectroscopic performance studies of pixelated CdTe 356
detector”, Journal of Instrumentation, vol. 7, 2012. 357
[23] E. Fröjdh, et al., “X-ray absorption and charge transport in a pixelated CdTe detector 358
with single photon processing readout”, Journal of Instrumentation, Vol. 7, 2011. 359
[24] D. Turecek, et al., “Pixelman: a multi-platform data acquisition and processing software 360
package for Medipix2, Timepix and Medipix3 detectors”, IOP, 2011. 361
[25] M. Kroupa, et al., “Optimization of the spectroscopic response of the Timepix detector”, 362
IOP, 2011.
363
[26] M. Filipenko et al., “Characterization of the energy resolution and the tracking 364
capabilities of a hybrid pixel detector with CdTe-sensor layer for a possible use in a 365
neutrinoless double beta decay experiment”, Eur. Phys. J. C, 73:2374, 2013. 366
10 [27] J. Jakubek, “Precise energy calibration of pixel detector working in time-over-threshold 367
mode”, Nucl. Instrum. Methods Phys. Res. A, vol. 633, pp. S262-S266, 2011. 368
[28] D. Turecek, et al., “Energy calibration of pixel detector working on Time-Over-369
Threshold mode using test pulses”, NSS/MIC ISSN 1082-3654, pp. 1722-1725, 2011. 370
[29] C. Ponchut and M. Ruat, “Energy calibration of a CdTe X-ray pixel sensor hybridized to 371
a Timepix chip”, IOP, 2012. 372
[30] Y. Ménesguen and M.C. Lépy, “Efficiency calibration and surface mapping of an 373
energy-dispersive detector with SOLEX: a compact tunable monochromatic X-ray 374
source”, Nucl. Instrum. Methods Phys. Res. A, vol. 695, pp. 193-196, 2012. 375
[31] R. Ballabriga et al., “Medipix3:A 64 k pixel detector readout chip working in single 376
photon counting mode with improved spectrometric performance”, Nucl. Instrum. 377
Methods Phys. Res. A, vol. 633, pp. S15-S18, 2011.
11
Figures
379 380
(a) (b) (c)
Fig. 1: (a) GAMPIX gamma camera prototype developed by CEA LIST (b) front side and (c) back side of the
381
iPix industrial prototype developed by CANBERRA.
382 383
384
Fig. 2: Spectra obtained with a 241Am radioactive source depending on cluster size.
385 386
(a) (b)
Fig. 3: Cluster size histograms for (a) 241Am and (b) 60Co
387 388 (a) 0 100 200 300 400 500 600 700 800 900 0 50 100 150 200 250 300 350 C o u n ts ToT (x 25 ns) Clusters 1 Clusters 2 Clusters 3 Clusters 4 Clusters 5 All clusters Fluorescence peaks
12
(b)
(c)
(d)
Fig. 4: Spectra of (a) 241Am, (b) 133Ba, (c) 137Cs and (d) 60Co with typical features.
389 390
(a) (b)
Fig. 5: Spatial reconstruction of a radioactive source of 137Cs (coded mask of rank 7 with thickness of 4 mm) for
391
acquisition time of (a) 10 s and (b) 400 s. The presence of artifacts can be observed on the left. Result obtained
392
for a 400 s acquisition time is considered as satisfying.
393 394
Fluorescence peaks
Photoelectric peak (81.0 keV)
Fluorescence peaks
Photoelectric peak (661.5 keV) Compton edge (477.0 keV)
Fluorescence
peaks Compton edge
13 395
Fig. 6: Logarithmic plot of efficiency for 1 mm CdTe detector between 1 keV and 10 MeV.
396 397
398
Fig. 7: Example of the experimental configuration used to evaluate both spectrometric approaches. Workbench
399
on which radioactive sources are placed is seen from above.
400 401 Tables 402 403 Table 1 404
Characteristics of radioactive sources tested
405
Source 241Am 133Ba 137Cs 60Co
Energy (keV) 59.5 [81.0, 356.0] 661.7 1173.2 and 1332.5
Activity (MBq) 72.8 35.1 26.1 11.7
Dose rate at 1 m (µSv/h) 0.286 1.658 1.987 3.585
406
Table 2
407
Mean cluster size and cluster size probabilities
408
Radionuclide Mean cluster size (pixels) Cluster size probability (%) 0-4 4-10 > 10 241Am 2.8 90.1 9.8 0.1 133Ba 3.9 70.4 28.4 1.2 137Cs 4.4 59.9 35.4 4.7 60Co 7.0 54.6 30.8 14.6 409 Table 3 410
Cluster size windowing
411
Radionuclide Windowing (cluster size) Mean cluster size (pixels)
241Am 0-3 2.8 133Ba 7-10 3.9 137Cs 10-100 4.4 60Co 12-100 7.0 412 1 10 100 1 10 100 1000 10000 Ef fi ci en cy (% ) Energy (keV) Total Photoelectric cm -60 -40 -35 -30 -25 -20 -15 -10 -5 0 5 10 15 20 25 30 35 40 110 A 105 100 B 95 A B 90 C C 85 80 0 241Am 133 Ba 137Cs Camera
14
Table 4
413
ToT windowing
414
Radionuclide Windowing (ToT values)
241Am 400-500 133Ba 600-800 137Cs 1000-2000 60Co 5000-15000 415 Table 5 416
Mean cluster size and cluster windowing
417
Radioactive sources All 241Am 133Ba 137Cs
Cluster size windowing
ToT windowing
418
Table 6
419
Sensitivities without windowing and for cluster size and ToT windowing with rank 7, thickness of 4 mm coded
420
mask
421
Without windowing Cluster size windowing ToT windowing
241Am 1 s 1 s 1 s 0% 0% 133Ba 4 s 15 s 7 s +275% +75% 137Cs 60 s 130 s 100 s +117% +67% 60Co 300 s 400 s 1500 s +33% +400% 422 Table 7 423
Sensitivities without windowing and for cluster size and ToT windowing with rank 7, thickness of 8 mm coded
424
mask
425
Without windowing Cluster size windowing ToT windowing
241Am 1 s 2 s 2 s +100% +100% 133Ba 10 s 25 s 12 s +150% +20% 137Cs 20 s 180 s 80 s +800% +300% 60Co 60 s 125 s 650 s +108% +983% 426 427 428
15
Table 8
429
Sensitivities without windowing and for cluster size and ToT windowing with rank 13, thickness of 2 mm coded
430
mask
431
Without windowing Cluster size windowing ToT windowing
241Am 3 s 4 s 4 s +33% +33% 133Ba 14 s 100 s 17 s +614% +21% 137Cs 300 s > 600 s > 600 s > +100% > +100% 60Co Not visible Not visible Not visible