J. Mater. Environ. Sci., 2018, Volume 9, Issue 4, Page 1110-1118 https://doi.org/10.26872/jmes.2018.9.4.122 ! http://www.jmaterenvironsci.com ! Journal(of(Materials(and(( Environmental(Sciences( ISSN(:(2028;2508( CODEN(:(JMESCN( Copyright(©(2018,((((((((((((((((((((((((((((( University(of(Mohammed(Premier(((((( (Oujda(Morocco(
The use of linear and nonlinear methods for adsorption isotherm
optimization of basic green 4-dye onto sawdust-based activated carbon
1
, N. Benderdouche
1*, B. Bestani
1M. Hamzaoui
Laboratoire de Structure, Elaboration et Application des matériaux Moléculaires (SEAMM).
1
Faculté des Sciences et de la Technologie (FST), Université Abdelhamid Benbadis-Mostaganem-Algérie
1. Introduction
Effluents from industrial, agricultural and domestic origin are often charged with pollutants. Their impact on the environment is very harmful; they are sometimes recycled or quite simply rejected into nature which causes a capital problem and a major concern for local public authorities and international organizations [1-3]. Thus, all these encouraged the improvement of the existing techniques of depollution and the development of new processes, in accordance with the increasingly restrictive international standards. Textile and tannery are among major industries that use great amount of water, generating then an important waste water pollution charged with all kind of pollutant such as dyes, salts etc…[4-6]. Indeed, many conventional methods have been used for wastewater treatment such as precipitation, oxidation, flotation-coagulation and electro-coagulation. Even they appear effective, but they are limited to a variety of pollutants for technical reasons and high cost of exploitation or may not be capable of treating large volumes of effluent [7-9]
Among the mentioned methods for wastewater treatments that has drawn attention to many researchers in the last decades, adsorption using activated carbon, a phase transfer process has been widely used in practice to remove contaminants in all their forms (organic and inorganic) from fluid phases [10-13] because of the low investment in initial cost and design simplicity. Activated carbons for wastewater treatment are usually obtained from materials locally available such as natural materials, agricultural wastes and industrial wastes [14-16].
Adsorption isotherms which are usually used to determine the quantity of a given pollutant adsorbed are also used to describe adsorbent-adsorbate equilibrium relationship. A comparative study between linear (which is frequently used to determine the best-fitting isotherm) and nonlinear (which is used to avoid errors affecting R2 during linearity) isotherm analysis for the adsorption of basic green 4-dye by Sawdust-based activated carbon was the aim of this study [17-18].
1.( Experimental details
Abstract
The abundance and low cost of sawdust as an agricultural by-product make it a potential candidate as precursor of activated carbon preparation. In this study, the sawdust samples were chemically treated with acid (20% H3PO4,170°C, 2h), base (20%KOH,
ambient, 24h) and salt (1mol/L (NH4)2S2O8, ambient, 24h) separately followed by
pyrolysis at 600 C for 3h, resulting respectively in SD-1, SD-2, SD-3 sawdust-based activated carbons respectively used as adsorbents for basic green 4 dye removal from aqueous media and the results were compared to the commercially available Merck activated carbon. Batch adsorption tests were performed and the experimental data analyzed using the Langmuir and Freundlich models in their linear and non linear forms, in order to estimate the equilibrium parameters. For optimum adsorption isotherm selection, a comparison of linear and nonlinear regression methods was applied. Three errors functions: Chi-square statistic (χ2), root mean square error
(RMSE) and Average percentage error (APE) were used for isotherm optimization prediction. While the coefficient of determination (R2) was used for the best-fit linear
theoretical isotherm selection Received 03 May 2017, Revised 24 Sep 2017, Accepted 29 Sep 2017 Keywords !! Modeling; !! Adsorption isotherm; !! Linear; non-linear; !! Standard errors; !! Activated carbon bestanib@yahoo.fr ; Phone: +213552329407; Fax: +21345434354
2.1. Preparation of stock solutions
All reagents used in this study were of analytical grade from Merck, (Germany). A 10-2 M of stock solutions
was prepared according to standard procedure by dissolving the required amount of basic green 4-dye in distilled water. Successive dilutions were used to obtain working solutions of the desired concentrations. Table 1 shows Chemical structure and characteristics of basic green 4-dye.
Table1: Chemical structure and characteristics of basic green 4-dye. Characteristics Chemical structure
CI Molecular formula Molecular weight )* max λ Max. wave length (
(mice) 50 LD 42,000 12 O 4 N 54 H 52 C 927.03g/mol 615nm 80 mg/kg
* Experimentally obtained value
2.2 Adsorbents preparation
In order to eliminate impurities, dust and to reduce moisture; sawdust samples were washed several times with distilled water then dried in an oven overnight at 378 K. The obtained samples were then grinded, sieved through 0.071 mm for intimate chemical agent–particle contact using a Vierzen Crosshop grinder before activation. Depending on the chemical agent chosen, three sawdust-based activated carbons were prepared in a two-step process involving a chemical impregnation using phosphoric acid, hydroxide potassium and sodium thiosulfate separately followed by pyrolysis at 600°C for 3 hours for each case as shown in Scheme 1.
In general, activation using chemical agents or physical using heat is a way to enhance the adoptive properties of raw materials. In our case, we used an acid (H3PO4), a base (KOH) and a salt ((NH4)2S2O8) which are less
haemfull to the environment. Phosphoric acid is the most preferred because of the environmental and economic concerns.Potassium hydroxide and salt develops large microporos. In all cases chemical agents and heat at 600°C increase the porosity of the precursor by eliminating most the volatile organic compounds and impureties which leave more space for pollutants adsorption, increasing then their uptake as described by Douara et al [27]. 2.3 Adsorption experiments
The effect of some important parameters such as adsorbent dosage, contact time range, pH and temperature on the adsorptive removal of basic green 4-dye onto the prepared activated carbons and the commercial one were performed in batch sorption experiments in a series of capped 250 mL Erlenmeyer flasks at a room temperature
Washing and drying
H3PO4 action at 443 K for 90 min.
Filtering and drying overnight
Pyrolysis at 600C for 3 h
* HCl(0.1N) and distilled water washing *Lead acetate test
Obtained activated carbon ready to use for test
adsorption
Scheme 1: A two step-process carried out on activated process on sawdust (case: SD-1 preparation)
25±1C. For such studies, a 25 mL volume of a dye solution of known initial concentration was mixed with a known amount of adsorbent. The resulting suspension was then agitated magnetically at a constant speed of 200 rpm until equilibrium had been reached. After the adsorption process had occurred, the resulting solution in each flask was centrifuged at 4000 rpm and the supernatant analyzed using a UV–Visible 2121 Optizen spectrophotometer at wavelength value of 615nm. The concentrations retained in the adsorbent phase (qe) were
determined according to the mass balance using the following relationship:
(
)
V
m
C
C
q
eq e∗
∗
−
=
1000
0 (1)And the distribution coefficient is:
(2)
C0 and Ceq are the initial and the equilibrium dye concentration (mg/L) respectively,
(mg/L), V is the volume of the liquid phase (mL), m is the mass of the activated carbon sample (mg) and Kd is
the distribution coefficient (L/g). The performance of the adsorption is evaluated by using the removal efficiency (RE) defined as:
100 ) ( (%) 0 0 ∗ − = C C C R t E (3)
2.4. Linear and nonlinear Langmuir and Freundlich isotherm
The isotherms data were analysed using two of the most commonly used equilibrium models namely the Langmuir isotherm which is based on monolayer coverage prediction of the adsorbate, this model also suggest that there is no lateral interaction between the sorbed molecules [19] and the Freundlich isotherm which is based on multilayer adsorption on heterogeneous surface [20]
Depending on both the nature of the adsorbent and the interaction type, various kinds of isotherms can be distinguished. In order to find a suitable model that can be used for design purposes; two well known and widely adopted adsorption isotherms, namely: Langmuir, which assumes that the adsorption takes place at specific homogeneous sites within the adsorbent with no lateral interaction between the sorbed molecules [19] and Freundlich [20] which describes adsorption as taking place on a heterogeneous adsorbent surface, were fitted to experimental data to describe the adsorption of basic green 4 dye at the solid-liquid interface. Table 2 summarizes the linear and non linear forms of the isotherms models used in this study. Where Ceq is the
equilibrium concentration of the adsorbate (mg/L) and qe is the amount of adsorbate adsorbed per unit mass
of activated carbon (mg/g). Both Langmuir maximum uptake of dye per unit mass of adsorbent b (mg/g) and Langmuir constant related to the rate of adsorption KL (L/mg) are obtained from (Ce/qe) vs Ce plots. While
Freundlich constants Kf and n can be obtained from the intercept and the slope of ln qe vs ln Ceq plots, with n
indicating the favourableness (n>1) of the adsorption process and KF the adsorption capacity of the adsorbent.
Table 2: Linear and non linear forms of Langmuir and Freundlich isotherms
Isotherm Nonlinear Linear Plot
Freundlich n eq F e K C q = 1 ln(qe)=lnKF+(1n)∗ln(Ce) ln(qe) vs ln(Ce) Langmuir-I e e m e bC bC q q + = 1 ) 1 ( ) ( m m e e e q b q C q C ∗ + = e e q C vs e
C
Langmuir-II 1 (1 ) (1 ) (1 ) m e m e b q C q q = ∗ ∗ + qe 1 vs e C 1 Langmuir-III (1 ) ( ) e e m e C q b q q = − ∗ qe vs e e C q Langmuir-IV m e e e b q b q C q ∗ − ∗ = e e C q vs qeAnother characteristic of Langmuir isotherm is the equilibrium parameter RL given by equation (4) defining the
nature of adsorption process that can be either unfavourable (RL > 1), linear (RL = 1), favourable (0 < RL < 1) or
irreversible RL =0. 0
1
1
C
b
R
L+
=
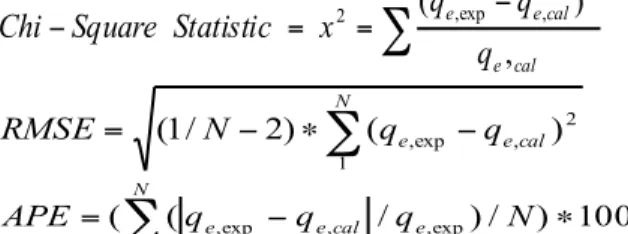
(4)2.5. Error functions analysis
Distribution functions such as Chi-square (χ2), Root mean square error (RMSE) and the Average percentage
error (APE) are used in order to evaluate models [21], if data from the model are similar to the experimental
(
)
V m C C C K eq eq d ∗ ∗ ∗ − = 1000 0data, χ2 will be a small number, if they are different, χ2 will be a large number and the small the RMSE value, the
better the curve fitting. In general plus values of errors function are low it means more there is an agreement between the experimental and calculate data and more the model converges and becomes favourable, their functions are listed below:
∑
− = = − cal e cal e e q q q x Statistic Square Chi , ) ( 2 , exp , 2 (5)∑
− ∗ − = N cal e e q q N RMSE 1 2 , exp , ) ( ) 2 / 1 ( (6) 100 ) / ) / ( ( ,exp 1 , exp , − ∗ =∑
q q q N APE e N cal e e (7)With N is the number of observations in the experimental data.
2.( Results and Discussion
The use of an iterative numerical optimization method to minimize the least-squares function is required by Non-Linear Regression (NLR), whereas an analytical solution is admitted by the linear one.
3.1.!linear fitting of the isotherm models
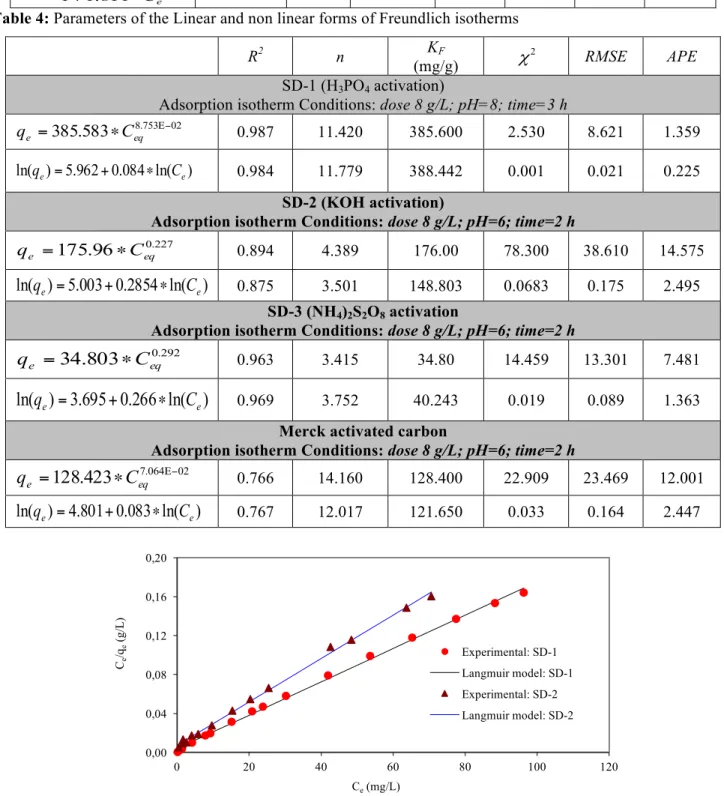
For the best fitting and finding the parameters of isotherms, linear regression analysis and the least squares method are frequently used. However, Langmuir and Freundlich isotherms in their linear forms mentioned in Table 1 were used not only for this purpose but also to describe the relationship between the amount of dye adsorbed qe and its equilibrium concentration Ceq [21]. Figure 1 and Figure 2 show linear plots of both isotherm
models for chosen dye by all considered adsorbents. Each of the four linear forms of Langmuir isotherm will result in different parameter estimates as shown in Table 3 [21-23].The adsorption of basic 4- dye onto SD-1 and SD-2 adsorbents is well represented by Langmuir type I model with highest coefficient of determinations, R2 values as shown in Figure 1, indicate that there is strong evidence that the sorption of the chosen dye onto the
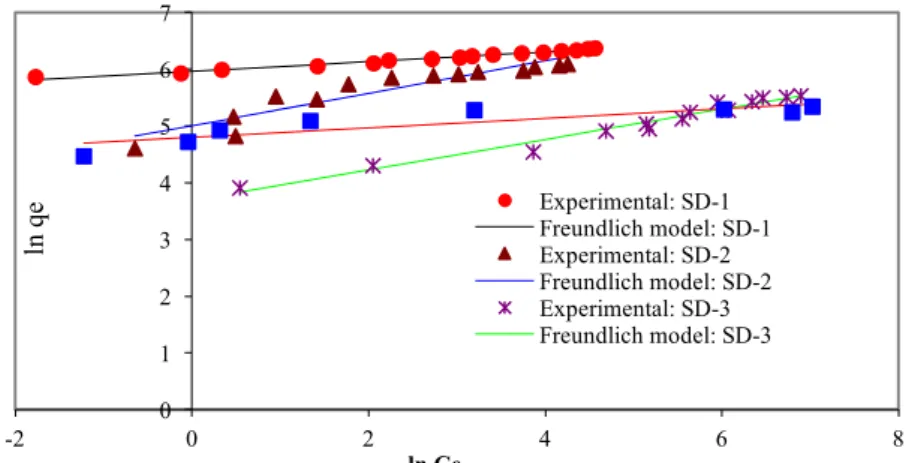
prepared samples follows the Langmuir isotherm, from which a maximum capacity of 583.52 mg/g has been obtained compared to the other types of the same model according to R2 values and related Chi-square (χ2), and Root mean square error (RMSE). While, the Average percentage error (APE) are higher for most linear forms except for the case of SD-2. This best fitting is due to the minimal deviations from the fitted equation resulting in the best error distribution. As shown in Figure 2, the Freundlich isotherm model also is well fitted for the adsorption of basic 4- dye onto using SD-1 and SD-3 with higher R2 and lower standard errors values suggesting that a satisfactory fit to the experimental data can be generated.
Table 4 summarizes the corresponding Freundlich isotherm parameters, their correlation coefficients (R2) and
related standard errors for each parameter. 3.2. Non linear fitting of the isotherm models
The non linear analysis is used in order to avoid errors raised by different estimates resulting from simple linear regression of the linearized forms of Langmuir equation presented in Table 2 which can affect R2 values significantly. To avoid such errors, we use the non-linear analysis as an adequate method [24]. It is an interesting way for describing adsorption isotherms used for many applications such as wastewater treatment from textile industry.
Langmuir and Freundlich adsorption isotherms of basic 4-dye by all four considered adsorbents using nonlinear analysis are shown in Figure 3; and their corresponding isotherm parameters, coefficients of determination (R2) and related standard errors ((χ2, RMSE, APE) for each parameter are summarized in Table 3 and Table 4 . Higher values of R2 obtained in this study are derived by fitting experimental data into the Langmuir isotherm model for both SD-2 and Merck-AC samples. The Freundlich isotherm model best fits the data for SD-1 and SD-3 samples as shown in Table 1 and Figure 2. In addition, lower values of Chi-square (χ2), and Root mean
square error (RMSE) for each parameter obtained in both isotherm models with higher R2 can generate a satisfactory fit to the experimental data. As shown in Table 1, maximum adsorption capacity values obtained using non linear Langmuir model, were 515.2, 435.9, 276.0 and 196.6 mg/g for SD-1, SD-2, SD-3 and Merch-AC respectively compared to inactivated sawdust capacity of 70 mg/g. These values are closer to the adsorbed quantities corresponding to saturation plateau obtained using equation (1) and shown in Figure 3, indicating the acceptability of Langmuir model.
The saturation amounts in Freundlich model obtained using non-linear regression are also closer to the experimental ones with lower errors function as shown in table 1 and Figure 4. which means that this model is
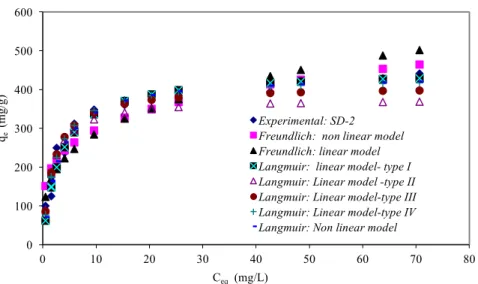
valid and can describe the equilibrium data. Figure 5 represents data obtained by both models in their linear and non linear forms compared to the experimental one for SD-2 sample taken as an example in this study.
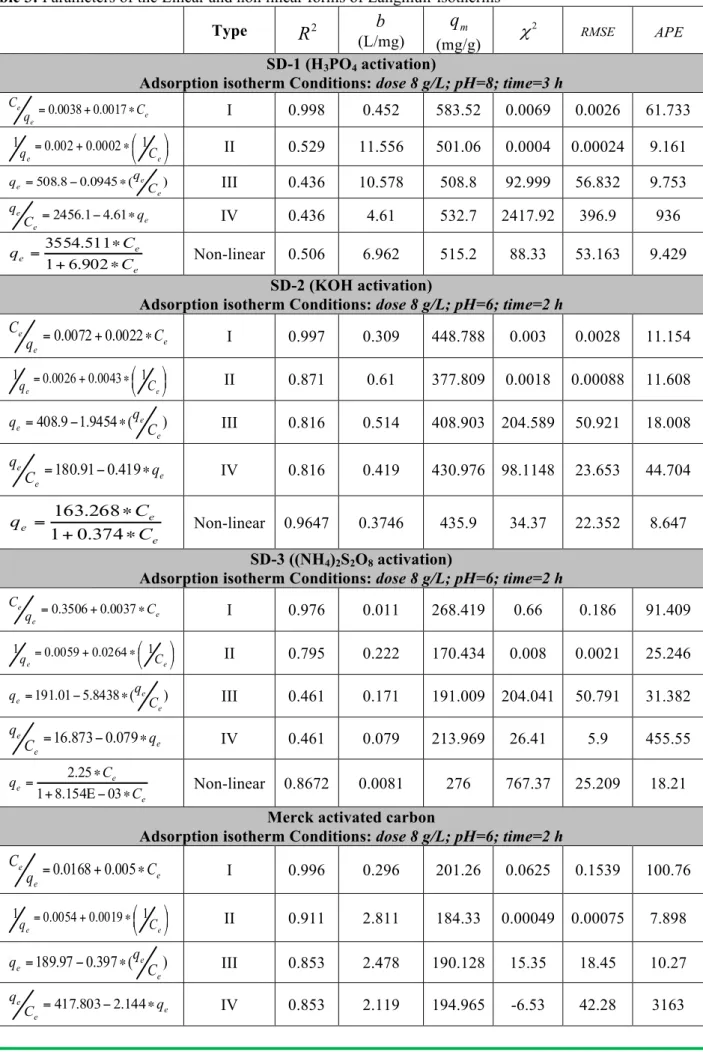
Table 3: Parameters of the Linear and non linear forms of Langmuir isotherms
Type
R
2b
(L/mg) mq
(mg/g) 2 χ RMSE APE SD-1 (H3PO4 activation)Adsorption isotherm Conditions: dose 8 g/L; pH=8; time=3 h
e e e C q C ∗ + =0.0038 0.0017 I 0.998 0.452 583.52 0.0069 0.0026 61.733 ! " # $ % & ∗ + = e e C q 0.002 0.0002 1 1 II 0.529 11.556 501.06 0.0004 0.00024 9.161 ) ( 0945 . 0 8 . 508 e e e C q q = − ∗ III 0.436 10.578 508.8 92.999 56.832 9.753 e e e q C q ∗ − =2456.1 4.61 IV 0.436 4.61 532.7 2417.92 396.9 936 e e e C C q ∗ + ∗ = 902 . 6 1 511 . 3554 Non-linear 0.506 6.962 515.2 88.33 53.163 9.429 SD-2 (KOH activation)
Adsorption isotherm Conditions: dose 8 g/L; pH=6; time=2 h e e e C q C ∗ + =0.0072 0.0022 I 0.997 0.309 448.788 0.003 0.0028 11.154 ! " # $ % & ∗ + = e e C q 0.0026 0.0043 1 1 II 0.871 0.61 377.809 0.0018 0.00088 11.608 ) ( 9454 . 1 9 . 408 e e e C q q = − ∗ III 0.816 0.514 408.903 204.589 50.921 18.008 e e e q C q ∗ − =180.91 0.419 IV 0.816 0.419 430.976 98.1148 23.653 44.704 e e e C C q ∗ + ∗ = 374 . 0 1 268 . 163 Non-linear 0.9647 0.3746 435.9 34.37 22.352 8.647 SD-3 ((NH4)2S2O8 activation)
Adsorption isotherm Conditions: dose 8 g/L; pH=6; time=2 h
e e e C q C ∗ + =0.3506 0.0037 I 0.976 0.011 268.419 0.66 0.186 91.409 ! " # $ % & ∗ + = e e C q 0.0059 0.0264 1 1 II 0.795 0.222 170.434 0.008 0.0021 25.246 ) ( 8438 . 5 01 . 191 e e e C q q = − ∗ III 0.461 0.171 191.009 204.041 50.791 31.382 e e e q C q ∗ − =16.873 0.079 IV 0.461 0.079 213.969 26.41 5.9 455.55 e e e C C q ∗ − Ε + ∗ = 03 154 . 8 1 25 . 2 Non-linear 0.8672 0.0081 276 767.37 25.209 18.21
Merck activated carbon
Adsorption isotherm Conditions: dose 8 g/L; pH=6; time=2 h e e e C q C ∗ + =0.0168 0.005 I 0.996 0.296 201.26 0.0625 0.1539 100.76 ! " # $ % & ∗ + = e e C q 0.0054 0.0019 1 1 II 0.911 2.811 184.33 0.00049 0.00075 7.898 ) ( 397 . 0 97 . 189 e e e q C q = − ∗ III 0.853 2.478 190.128 15.35 18.45 10.27 e e e q C q ∗ − =417.803 2.144 IV 0.853 2.119 194.965 -6.53 42.28 3163
e e e C C q ∗ + ∗ = 811 . 1 1 1 . 356 Non-linear 0.9375 1.812 196.6 8.514 12.126 6.848
Table 4: Parameters of the Linear and non linear forms of Freundlich isotherms
R2 n KF
(mg/g) χ2 RMSE APE
SD-1 (H3PO4 activation)
Adsorption isotherm Conditions: dose 8 g/L; pH=8; time=3 h
02 753 . 8 583 . 385 Ε− ∗ = eq e C q 0.987 11.420 385.600 2.530 8.621 1.359 ) ln( 084 . 0 962 . 5 ) ln(qe = + ∗ Ce 0.984 11.779 388.442 0.001 0.021 0.225 SD-2 (KOH activation)
Adsorption isotherm Conditions: dose 8 g/L; pH=6; time=2 h
227 . 0 96 . 175 eq e C q = ∗ 0.894 4.389 176.00 78.300 38.610 14.575
)
ln(
2854
.
0
003
.
5
)
ln(
q
e=
+
∗
C
e 0.875 3.501 148.803 0.0683 0.175 2.495 SD-3 (NH4)2S2O8 activationAdsorption isotherm Conditions: dose 8 g/L; pH=6; time=2 h
292 . 0
803
.
34
eq eC
q
=
∗
0.963 3.415 34.80 14.459 13.301 7.481)
ln(
266
.
0
695
.
3
)
ln(
q
e=
+
∗
C
e 0.969 3.752 40.243 0.019 0.089 1.363Merck activated carbon
Adsorption isotherm Conditions: dose 8 g/L; pH=6; time=2 h
02 064 . 7
423
.
128
Ε−∗
=
eq eC
q
0.766 14.160 128.400 22.909 23.469 12.001)
ln(
083
.
0
801
.
4
)
ln(
q
e=
+
∗
C
e 0.767 12.017 121.650 0.033 0.164 2.447Figure 1: Linear fitting of the Langmuir (Case of SD-1 and SD-2 samples)
0,00 0,04 0,08 0,12 0,16 0,20 0 20 40 60 80 100 120 Ce /qe (g /L ) Ce(mg/L) Experimental: SD-1 Langmuir model: SD-1 Experimental: SD-2 Langmuir model: SD-2
Figure 2: Linear fitting of the Freundlich isotherms models for all samples 0 1 2 3 4 5 6 7 -2 0 2 4 6 8 ln qe ln Ce Experimental: SD-1 Freundlich model: SD-1 Experimental: SD-2 Freundlich model: SD-2 Experimental: SD-3 Freundlich model: SD-3 0 100 200 300 400 500 600 700 0 20 40 60 80 100 120 qe (m g/ g) Ce (mg/L) Experimental: SD-1 Langmuir model: SD-1 Experimental: SD-2 Langmuir model: SD-2 0 100 200 300 400 500 600 700 0 20 40 60 80 100 120 qe m g/ g) Ce(mg/L) Experimental: SD-1 Freundlich model: SD-1 Experimental: SD-2 Freundlich model: SD-2
Figure 4: Non Linear fitting of the Freundlich isotherms models for SD-1 and SD-2 samples Figure 3: Non Linear fitting of the Langmuir isotherms models for SD-1 and SD-2 samples
Figure 5: Non Linear fitting of the Langmuir and Freundlich isotherms models for SD-2 sample
Separation factor RL, a dimensionless constant defined by equation 4 is used to express the essential features of
the Langmuir isotherm. [25]
All RL values do exist between 0<RL<1indicating then, that the prepared samples are favorable for basic green
dye adsorption under conditions used in this study as shown in figure 6 (case of SD-2 taken as an example). Also, the adsorption intensity for all adsorbents used in this study found from the linear Freundlich isotherm model are higher (n> 1) implying a good adsorption process with lower errors functions and higher R2 values
except for the one of commercial activated carbon (R2 = 0.875). We noticed that the Langmuir model in its linear form (type-I) and the nonlinear one gave a high values of the equilibrium parameter compared to the other models.
Figure 6: Separation factor-linear and nonlinear Langmuir isotherm model (SD-2 case)
Conclusions
The adsorption of basic green 4-dye onto a chemically modified sawdust using Phosphoric acid, potassium hydroxide and ammonium persulfate as oxidizing agent and Merck activated carbon (used as a reference), from aqueous solution was investigated on the basis of equilibrium studies. The isotherm models were carried out at different initial dye concentrations and constants characterising each system (such as pH; dose and equilibrium time) previously identified and recapitulated in above tables. Linear and nonlinear Langmuir and Freundlich isotherm and error functions were used to model the experimental data. Higher determination coefficients
0 100 200 300 400 500 600 0 10 20 30 40 50 60 70 80 qe (m g/ g) Ceq (mg/L) Experimental: SD-2 Freundlich: non linear model Freundlich: linear model Langmuir: linear model- type I Langmuir: Linear model -type II Langmuir: Linear model-type III Langmuir: Linear model-type IV Langmuir: Non linear model
0,0000 0,0010 0,0020 0,0030 0,0040 0,0050 500 1000 1500 2000 2500 3000 3500 4000 RL Initial Concentration (mg/L) Langmuir-1 Langmuir-2 Langmuir-3 Langmuir-4
provided by linear forms of Langmuir: type I (all samples) best fit the data with higher adsorption capacities compared to the other types and non linear isotherm models. Lower error function analysis for non linear regression of Freundlich isotherm meaning the validity of this model for describing the equilibrium data. The 2 samples.
-AC and SD
-values except for the Merck
2
validity of this model can also be proven by the obtained R
Higher uptakes ranging from 170.43 to 583.52 mg/g (depending of the oxidizing agent) corresponding to 99.9 %, 99.6% and 70.1% for SD-1, SD-2 and SD-3 respectively compared to 59.9% obtained by Merck-AC, indicate that the surface modified sawdust can be used as alternative adsorbents in textile wastewater treatment.
Acknowledgments- Authors thank the financial support from National CNEPRU project (Mostaganem University)
E02220070003 -01/01/2010 of the Ministry of Higher Education.References
1. M. Ahmad, A.S. Bajahlan, W.S. Hammad, Environ. Monitor. Asses. 147 (2008) 297. 2. O. Botalova, J. Schwarzbauer, Water, Air, & Soil Pollution. 221 (2011) 77.
3. Y. Akria, R.M. David, E. Philip, Proceedings of 21st Mid-Atlantic Industrial Waste Conference, Harrisburg, Technomic, Lancaster, PA, USA, (1989).
4. A.K. Verma, R. Dash, P. Bhunia, J. Environ. Manag. 93 (2012) 154.! 5. I. Bisschops, H. Spanjers, Environ.Tech. 24 (2003) 1399.!
6. S. Sirianuntapiboon, P. Srisornsak, Bioresour. Tech. 98 (2007) 1057.!
7. T. Robinson, G. McMullan, R. Marchant, P. Nigam, Bioresour. Tech. 77 (2001) 247.!
8. G. Mesohegyi, P. Frank, F.T. Van der Zee, J. Font, A. Fortuny, A. Fabregat, J. Environ. Manage. 102 (2012) 148.
9. J. Panswed, S. Wongchaisuwan, Water Sci. Tech. 18 (1986) 139. 10. C. Theivarasu, S. Mylsamy, Int. J. Eng. Sci.Tech. 2 (2010) 6284. 11. B. Emrah, O. Mahmut, S. Ayhan, Micro. Meso. Mater. 115 (2008) 234.
12. W. Eckhard, Adsorption Technology in Water Treatment, Fundamentals, Processes, and Modeling. Walter de Gruyter GmbH & Co. KG, Berlin/Boston (2012).
13. K.S. Bharathi, S.T. Ramesh, Appl. Water Sci. 3 (2013) 773
14. H.X. Li, R.J. Zhang, L.Tang, J.H. Zhang, Z.G. Mao, Bioresour. 9 (2014) 6698.
15. M. Urík, P. Littera, J. Ševc, M. Kolenčík, S. Čerňanský, Int. J. Environ. Sci. Tech. 6 (2009) 451. 16. R. Rajeshkannan, M. Rajasimman, N. Rajamohan, Chem. Ind. & Chem. Eng. Quarterly. 17 (2011) 67. 17. R. Rajeshkannan, M. Rajasimman, N. Rajamohan, Int. J. Civ. Environ. Eng. 2 (2010) 222.
18. Y.S. Ho, Polish J. Environ. Studies. 15 (2006) 81.
19. K.V. Kumar, S. Sivanesan, V. Ramamurthi, Process Biochem. 40 (2005) 2865. 20. I. Langmuir, J. Am. Chem. Soc. 40 (1918) 1361.
21. H. Freundlich, J. Phys. Chem. 57 (1906) 385.
22. S. Mohammadi-Kalalagh, H. Babazadeh, Int. J. Environ. Sci. Tech. 11 (2014), 111/
23. F. Yang, X.J. Song, W.M. Wei, S. Yao, C.K. Xia, Z.Z. Yang, Asian J. Chemistry. 26 (2014), 1521. 24. Z. L. Yaneva, B. K. Koumanova, N. V. Georgieva, J. Chemistry. Volume 2013 (2013) 10 pages. 25. C. Xunjun, Information 6 (2015) 14.
26. A.T. Adeolu, O.A. Okareh, A.O. Dada, Amer. J. Environ. Protect. 4 (2016) 7.
27. N. Douara, B. Bestani, N. Benderdouch, L. Duclaux, Desalin. Water treat. 57 (2015), 5529.