HAL Id: halshs-00763966
https://halshs.archives-ouvertes.fr/halshs-00763966
Submitted on 12 Dec 2012
HAL is a multi-disciplinary open access archive for the deposit and dissemination of sci-entific research documents, whether they are pub-lished or not. The documents may come from teaching and research institutions in France or
L’archive ouverte pluridisciplinaire HAL, est destinée au dépôt et à la diffusion de documents scientifiques de niveau recherche, publiés ou non, émanant des établissements d’enseignement et de recherche français ou étrangers, des laboratoires
On the inclusion of the Chinese renminbi in the SDR
basket
Agnès Bénassy-Quéré, Damien Capelle
To cite this version:
Agnès Bénassy-Quéré, Damien Capelle. On the inclusion of the Chinese renminbi in the SDR basket. 2012. �halshs-00763966�
Documents de Travail du
Centre d’Economie de la Sorbonne
On the inclusion of the Chinese renminbi the SDR basket
Agnès BÉNASSY-QUÉRÉ, Damien CAPELLE
On the inclusion of the Chinese r enminbi in the SDR basket Agnès Bénassy-Quéré* and Damien Capelle**
Abstr act
We study the impact of a broadening of the SDR basket to the Chinese currency on the composition and volatility of the basket. Although, in the past, RMB inclusion would have had negligible impact due to its limited weight, a much more significant impact can be expected in the next decades, and more so if the Chinese currency is pegged to the US dollar. If the objective is to reinforce the attractiveness of the SDR as a unit of account and a store of value through more stability, then a broadening of the SDR to the RMB could be appropriate, provided some flexibility is introduced in the Chinese exchange-rate regime. This issue of flexibility is de facto more important than that of “free usability” to make the SDR more stable, at least in the short and medium run.
JEL Classification: F31, F33.
Keywords: SDR, renminbi, international monetary system, foreign exchange volatility.
Résumé
Nous étudions l’impact d’un élargissement du panier DTS à la monnaie chinoise sur la composition et la volatilité du panier, à court et long terme. Cet impact est négligeable sur le passé, mais considérables dans les décennies à venir, surtout si la monnaie chinoise demeure ancrée sur le dollar. Si l’objectif est de renforcer l’attrait du DTS en tant qu’unité de compte et de réserve de valeur en le rendant plus stable, alors un élargissement au RMB relativement rapide serait adéquat, pourvu qu’une certaine flexibilité soit introduite dans le régime de change chinois. Cette question de la flexibilité paraît plus importante, au regard de l’objectif de stabilité du DTS, que la contrainte de « libre usage » de la monnaie retenue jusqu’à présent comme critère clé de participation au panier.
Classification JEL : F31, F33.
Mots-clefs : DTS, renminbi, système monétaire international, volatilité des taux de change.
* Paris School of Economics-University Paris 1 and CESIfo. ** ENS-Cachan.
1. Intr oduction
The 2007-2009 financial crisis has revived the debate on the international monetary system (IMS). Although its direct responsibility in the crisis remains disputed, it is generally believed that the IMS had an indirect contribution through extensive appetite for US assets and
subsequent low interest rates in the United States during the period prior to the crisis. During the crisis, the IMS performed relatively well, not least thanks to generous bilateral swap lines extended especially by the Federal Reserve. However this source of liquidity provision in times of crisis is discretionary and its importance may decline in the future, in line with the declining weight of the United States in the global economy (see Angeloni et al., 2011). Multilateral and regional facilities were developed during the crisis, but they are still viewed as imperfect substitutes for self-insurance through reserve accumulation at the national level. In this context, several authors (see, e.g., Stiglitz Commission, 2009, Julius, 2010, Palais-Royal Initiative, 2011, Qiao and Xu, 2011) have called for a revival of the SDR. This issue has been intensively discussed within the G20 under French presidency. Although no
consensus could be found on a far-reaching overhaul of the SDR framework, a first step was taken in this direction in April 2011 in Washington, when G20 Finance ministers and central bankers agreed to work on a “criteria-based path to broaden the composition of the SDR”.1 This process was linked to a broader discussion about the role of emerging economies in the IMS and the need to take into account their growing role in the world economy. More specifically, the G20 was taking stock of the fact that China had become the first exporter
1
country in the world, the share in global trade being one of the criteria for inclusion of the currency in the SDR. More politically, such discussion arose while there was mounting pressure on China to revise its exchange-rate and capital-flow regime: joining the selective club of SDR basket currencies could be viewed as a reward from opening up its financial account and introducing more flexibility in its exchange-rate regime.
On the top of being a multilateral instrument of liquidity provision, the SDR is a store of value and a unit of account (see IMF, 2011). For it to be attractive for both functions, the value of the basket needs to be relatively stable. This requirement has indeed been key in the decisions taken on its composition since the launch of the SDR. This paper studies the implications of including the renminbi in the SDR basket, focusing on the stability of the basket. Section 2 discusses the motivation and feasibility of including the RMB in the SDR. Section 3 details the valuation method of the basket and applies it successively to the present basket and to an alternative basket that would include the renminbi. Section 4 studies the implications of including the renminbi in the SDR basket for the stability of the SDR. Section 5 explores the impact of RMB inclusion on the interest rate of the SDR. Section 6 concludes.
2. The RMB in the SDR: motivation and feasibility
2.1. The motivation for including the RMB in the SDR basket
Why include the renminbi in the SDR basket? Following Angeloni et al. (2011), this question can be expored along three standard normative axes: efficiency, stability and equity.
Efficiency. The original purpose of the SDR in 1969 was to supplement the US dollar as a source of international liquidity. Including the renminbi in the SDR would strengthen the legitimacy of the SDR as a reserve asset since it would be consistent with the structure of the world economy and the role the People’s Bank of China has started to play as a liquidity provider through the development of bilateral swap lines with foreign central banks.
Furthermore, the inclusion of the RMB in the SDR and the associated reduced volatility of the SDR against the RMB would work as an incentive for the PBoC to provide dollars in
exchange for SDRs on a voluntary basis, which would reduce its dollar exposure (although the potential for diversification through SDR holdings would remain limited unless there are more active allocations in the future). Hence, including the RMB in the SDR could contribute to enhancing the international financial safety net.
Stability. Offering China a way to diversify its reserves with little market impact and without the use of a controversial substitution account would be an achievement in terms of stability. However, to the extent that the RMB stays more or less pegged to the USD, having the RMB in the SDR would, all things being equal, raise the volatility of the basket against currencies that are not de jure or de facto pegged to the dollar. This could reduce the incentive for the corresponding countries to use the SDR both as a reserve asset and as a unit of account. It could even increase the incentive to peg currencies to the dollar around the world and accumulate dollars as a liquid proxy of the SDR. Conversely, having the five major
international currencies in the SDR could be conducive to creating a G5 monetary group for consultation on exchange-rate and monetary issues.2
Equity. Including the RMB in the SDR can be viewed as a way of having China take more responsibility in the functioning of the global monetary system and to encourage it to “speed up the RMB reforms in order to conform with the other basket currencies”.3 However it would also be a way to allow international investors to take long positions in the Chinese currency even before the latter is made convertible. More importantly, it would amount to socializing the exchange-rate risk. Assume, for instance, that when allowed to float, the RMB appreciates against the other currencies of the SDR basket. Then, any country holding SDRs will be able to convert them into key currencies at an inflated exchange rate, the loss being borne by the central bank that makes the swap. Although the impact would be limited, including the RMB in the SDR could also increase the interest rate of the basket, with detrimental implications for debtor countries.
2.2. The feasibility of RMB inclusion in the SDR
The selection of the currencies included in the SDR is not carved in stone and it has changed a number of times in the last 50 years.4 Any change must be approved by the IMF Executive Board with an 85 percent majority. The valuation method, including the weight of the
2
See Bénassy-Quéré and Pisani-Ferry (2011).
3
See Newnham, Chong and Wang (2011).
4
Initially defined as equivalent to 0.888671 grams of fine gold and thus equivalent to one dollar, the value of SDR was redefined as a basket of 16 currencies in 1974 (those of the 16 IMF members responsible each for at least one percent of world trade), following the breakdown of the Bretton Woods system and the subsequent removal to any reference to gold. In 1981, the number of currencies in the basket was reduced to five (US dollar, yen, pound sterling,
Deutschemark, French franc) in order to simplify the valuation of the SDR and to make it more attractive. In 1999, the French franc and the Deutschemark were replaced by the euro, thus bringing the number of currencies down to four.
different currencies, is reviewed every five years by the Executive Board, at the 70 percent majority. In 2000, the Board decided that only “freely usable” currencies should be included in the SDR, the concept of “free usability” being defined in the articles of agreement of the Fund (see below). Since then, the selection criteria have remained unchanged. It is in this context that the discussions on a possible enlargement of the basket take place.
As illustrated in Figure 1, China has become the first exporting country (second exporting monetary area) in terms of goods. When adding services and current income, it ranks second as a country and third as a currency area. Hence China passes the first test to see its currency included in the SDR basket.
Figure 1. Share of various countries or currency areas in world exports of goods, services and current income, in 2008 (in percent)
Source : own calculations based on IMF (IFS) data.
The question then is that of “free usability” of the Chinese currency. The concept of free usability relies on the IMF XXXth Article of Agreement:
“A freely usable currency means a member's currency that the Fund judges, in fact, (i) widely used to make payments for international transactions, and (ii) is widely traded in the
principal exchange markets.” (IMF Articles of Agreements, XXX (f)).
This concept was operationalized by the IMF staff in 1977. Accordingly, a “freely usable” currency is a currency that is:
• Widely used to make payments for international transactions, based on “the extent to which trade in goods and services is paid for in that currency, as well as on the
relative volume of capital transactions denominated in that currency”.5 In practice, the indicators used are the share of a member’s exports of goods and services in global trade, and the share of its currency in the denomination of official reserve holdings. • “Widely traded in the principal foreign exchange markets […] based on the volume of
transactions, the existence of forward market, the spread between buying and selling quotations denominated in that currency.”6 In practice, tradability is assessed through the share of each currency in international banking liabilities, international debt securities and global foreign exchange market turnover. The underlying idea is that each currency of the basket has broad and deep foreign-exchange market, including for hedging products.
In its 2010 review, the Executive Board considered that, although China was now part of the four largest exporting zones in the world, the “freely usable” criterion was not met yet for the RMB. However, it decided to keep the matter under close review, thereby potentially paving the way for the RMB to be included during the next review in 2015. In 2011, the IMF was tasked with reviewing the criterion of free usability. One possibility could be to downplay the criterion of “free usability” (in fact, the “free usability” of the pound and the yen is not fully exploited currently in the SDR arrangement), thus accepting a non-freely usable renminbi in the basket during a transition period. Another possibility would be to account for the growing
5
See IMF (2010), p. 17.
6
demand for RMB by private agents, which could in practice make it easy for central banks to sell this currency (“indirect” liquidity). In any case, the idea would be to assess the impact of RMB inclusion on the attractiveness of the SDR as a unit of account and as a store of value. Some degree of financial account convertibility should be achieved (attractiveness of the SDR as a store-of-value), together with some flexibility of the exchange rate (so that the inclusion of a new currency does not increase the volatility of the basket).
In brief, the door has been half-opened towards the inclusion of the renminbi in the SDR basket, in spite of the still limited cross-border dissemination of this currency (only 0.06% of international bonds and notes at end-2009, and 0.1% of total global foreign exchange market turnover during the 2007-2010 period7). But the door is still half-closed given the far-reaching structural changes that could be needed in terms of financial opening up, exchange-rate flexibilization and institutional change.
If the inclusion of the RMB in the SDR is a possibility, then a difficult question is that of the number of currencies in the basket. As already mentioned, in 2000 it was decided that only the currencies of the four largest exporters should be included in the SDR. Consistently, the Japanese yen or the British pound (depending on the evolution their respective exports) would need to be dropped if the Chinese renminbi was to be included. However, keeping the yen and the pound in the basket would be consistent with the objective of stability of the composition of the basket, as Japan and the UK should remain the 4th and 5th largest exporters.
Furthermore, London remains a major financial center, so the UK is better ranked in terms of
7
See BIS International Debt Securities Statistics, tables 13A and 13B, and BIS Triennnial Central Bank Survey of
capital flows than in terms of exports. Considering the rising role of financial transactions in the global economy, it could be justified to modify the decision of 2000, keep the pound and the yen in the basket and raise the number of currencies from four to five.
The next question then is why not including more currencies in the basket. Based on countries shares in trade and current income (Figure 1), possible candidates could be the Canadian dollar, the HK dollar, the Russian rubble, the Korean won, the SGP dollar, and possibly other currencies, all being convertible, unlike the renminbi. However the potential of development of these currencies is clearly more limited than that of the renminbi. Furthermore, including smaller countries in the basket would encounter the risk of having to revise the composition of the basket regularly to account for changes in country rankings. Finally, the choice on the number of currencies results from a trade-off between efficiency (which requires a limited number of currencies to reduce hedging costs) and stability of the value of the basket (which favors including more currencies to the extent that they are uncorrelated with the currencies already in the basket). The currencies mentioned above generally display high correlation with the US dollar, which reduces their attractiveness to stabilize the SDR. The rest of the paper hence focuses on the renminbi.
3. Old ver sus new SDR
This section relies on the IMF methodology to calculate the value of a “new” SDR basket that would include the renminbi on the top of existing currencies.
3.1 Valuation methodology
The methodology used by the IMF to calculate the weight of each currency in the basket and the subsequent value of the SDR is detailed in IMF (2010). The weight of currency i in the basket reviewed in year T, wi,T ,is based on average exports of goods and services and
currency-denomination of official reserves over the five years preceding year T, as a percentage of the corresponding averages summed up over the N currencies of the basket:
(
)
(
)
∑ ∑
∑
= − − = − − = + + = N i T T t t i t i T T t t i t i T i R X R X w 1 1 6 , , 1 6 , , ,(1)
where Xi,t is the value of exports of goods and services (including current-income credit) in
year t, and Ri,t is the value of the balances in currency i held by the monetary authorities of
other Member states at the end of year t. Then, currency weights are converted in “currency amounts” in SDR as follows: i T Q SDR T i T Q i T Q SDR T i T i w E E E w ) ( 4 , , $ ) ( 4 , $ ) ( 4 , , , = = α
(2)
where Eij,Q4(T) is the exchange rate between i and j (units of currency i in one unit of currency j) in the last quarter of year T.8 The value of the SDR in terms of the US dollar can then be recovered for any time t until the next basket review:
$ , 1 , $ , ( ) it N i T i t SDR T E E
∑
= = α(3) 8
The exact formula includes a correction factor ensuring that the value of the SDR in terms of the US dollar calculated on December 31 on the basis of the new basket will be the same as that actually prevailing on that day.
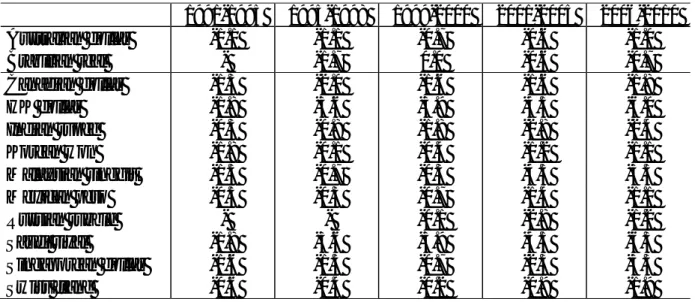
Based on this methodology and on data from IMF IFS and COFER (also from the European Central Bank for the Euro Area during the 1995-1999 period), the SDR basket is recovered here from 1991 to 2006. The results are reported in Table 1 (first two lines for each currency). The official and recalculated baskets look very similar, except for some discrepancies for the pound and the dollar: the dollar weight tends to be undervalued by our calculations, and that of the pound overvalued. These gaps can be explained by revisions of the data over time and by discretionary rounding decisions.9
9
Table 1. Official and recalculated SDR weights, in percent* Review year (T) 1990 1995 1998 2000 2005 2010 Applying to (H) 1991-1996 1996-1998 1999-2000 2001-2005 2006-2010 2011-2015 Dollar Official 40 39 39 45 44 41.9 Recalculated 39 38 37 44 44 41.9 Recal. with RMB 39.6 38.5 38.5 44.0 41.2 37.6 Deutschemark Official 21 21 … … … … Recalculated 21 21 … … … … Recal. with RMB 20.6 20.5 … … … … French franc Official 11 11 … … … … Recalculated 11 11 … … … … Recal. with RMB 10.6 10.5 … … … … Euro Official … … 32 29 34 37.4 Recalculated … … 33 31 34 37.4 Recal. with RMB … … 31.0 28.0 31.8 33.4 Yen Official 17 18 18 15 11 9.4 Recalculated 17 18 18 14 11 9.4 Recal. with RMB 16.6 17.5 17.5 14.0 10.4 8.4 British pound Official 11 11 11 11 11 11.3 Recalculated 12 12 12 11 11 11.3 Recal. with RMB 10.6 10.5 10.5 10.0 10.4 10.1 Renminbi Official … … … … Recalculated … … … … Recal. with RMB 2.0 2.5 2.5 4.0 6.2 10.5 TOTAL Official 100 100 100 100 100 100 Recalculated 100 100 100 100 100 100 Recal. with RMB 100 100 100 100 100 100 *
Consistently with IMF’s methodology, the shares are rounded up to the nearest whole percentage point before 2010. For the 2010 review, the shares are rounded up to one decimal. When including the RMB in the basket (last lines for each currency), all shares are rounded up to one decimal.
3.2 Including the r enminbi in the basket
Now it is assumed that the renminbi has been included in the SDR, and the weighting of the basket is recalculated accordingly, based on the above methodology. The data for China come from the IFS database, assuming that reserve holdings in renminbi are negligible over the 1991-2010 period. The results are reported for each currency in the last lines of Table 1. The share of the renminbi is very small during the 1990s but it starts picking up in the 2000s to reach two digits for the 2010 review based on data over 2005-09.
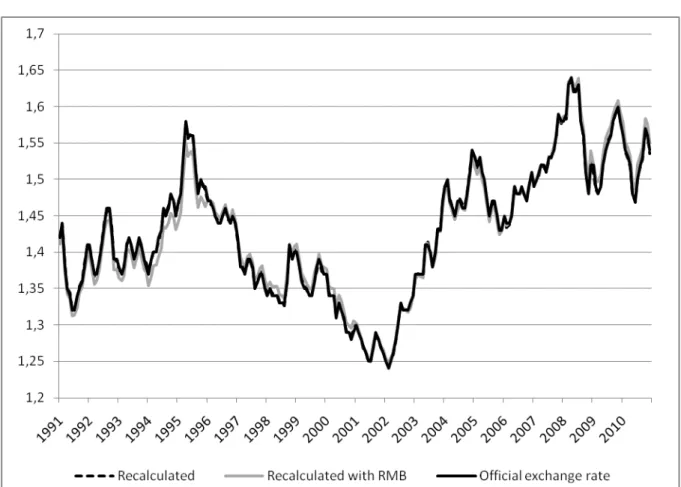
It is then possible to recalculate the value of the SDR in terms of dollar based on the recalculated basket with and without the RMB, and compare these calculations with the official exchange rate of the SDR against the dollar during the same period. The results are depicted in Figure 2. The three lines are hardly distinguishable, which suggests that including the renminbi in the SDR would not have made a big difference over the past, given the limited weight of the Chinese currency in the basket.
Figure 2. Official and recalculated $/SDR nominal exchange rates (monthly data)
Source : IMF and own calculations.
3.3 An SDR for the next decades
As already mentioned, the share of the RMB in the basket only reaches two digits in the review of 2010. From negligible, the Chinese currency may become important in the next decades. Looking forward, the weights of the basket can be projected as follows:
(
)
(
)
(
)
(
) ∑ ∑
∑
∑ ∑
∑ ∑
∑ ∑
∑
∑ ∑
∑ ∑
∑ ∑
∑
= − − = − − = = − − = = − − = = − − = − − = = − − = = − − = = − − = − − = × + + × + = + + = N i T T t t i T T t t i N i T T t t i t i N i T T t t i N i T T t t i T T t t i N i T T t t i t i N i T T t t i N i T T t t i t i T T t t i t i T i R R R X R X X R X X R X R X w 1 1 6 , 1 6 , 1 1 6 , , 1 1 6 , 1 1 6 , 1 6 , 1 1 6 , , 1 1 6 , 1 1 6 , , 1 6 , , , orT i T T T T i T T T T i r X R R x R X X w, , , + + + = (4)
where XT (resp. RT) denotes the sum of average exports (resp. reserves) for our four or five
countries-zones (resp. currencies), over the five-year period preceding the year of the review T, and xi,T (resp. ri,T) denotes the ratio of average exports (resp. reserves) of country or zone
(resp. currency) i over XT (resp. RT), for the same period.
For the four (or five) countries as a whole, reserves are assumed a constant ratio to exports:10
X R
R
+ =constant
As for the share of country i in total exports, it is taken from the projections at the 2050 horizon from MIRAGE11. The current income credit component of xi, is absent from
MIRAGE’s projections. It is projected by multiplying exports of goods and services by an average income credit-to-export ratio observed in each country over the 2005-2010 period. As for official reserves, two alternative scenarios are successively envisaged:
• A conservative scenario (S1): From 2010 to 2050, the currency composition of official reserves remains the same, at the global level, as the one observed during the 2010 review (hence over the 2005-2009 period): ri,T =ri,2010 for T = 2011 to 2050.
10
Hence the rise in this ratio observed for 20 years is supposed to come to an end.
11
• A multipolar scenario (S2): At the 2050 horizon, the currency composition of official reserves matches the country distribution of GDPs across the four or five SDR countries:12
∑
∑
= = = = N i i i N i i i i GDP GDP R R r 1 2050 , 2050 , 1 2050 , 2050 , 2050 ,(5)
From 2011 to 2050, a linear adjustment is assumed from ri,T to ri,2050.
The projection results are reported in Table 2. They should be considered only as illustrative given the heroic assumptions on which they rely.
Without the RMB in the SDR basket, the shares of the four currencies are roughly stable over the four decades. In S2, there is a slight rebalancing from the dollar to the other three
currencies due to the increase in their shares in official reserves.
Currency shares are no longer stable over time when the renminbi is included in the basket. The fall is especially dramatic for the euro and the pound. Under the conservative scenario (S1), the renminbi reaps a 30 percent share at the 2050 horizon, against 35 percent for the dollar and 23 percent for the euro. Under the multipolar scenario (S2), the renminbi already accounts for 32 percent of the basket in the 2035 review. In both scenarios, Table 2 evidences the building up of a tripolar monetary system, albeit at different horizons. In the following, the conservative scenario (S1) is used.
12
The currency composition of reserves is aligned with the distribution of GDPs rather than exports due to higher correlation observed over the past. GDP projections are taken from Fouré et al. (2010). GDPs in volume are augmented with a Balassa-Samuelson effect to account for the evolution of relative prices.
Table 2. SDR weights over the next decades, in percent Review year T 2010 2015 2020 2025 2030 2035 2040 2045 2050 Applying to: 2011-15 2016-20 2021-25 2026-30 2031-35 2036- 2041- 2046-50 2051-55 Dollar S1 Without RMB 41.9 42.5 42.9 43.3 44.0 44.5 45.2 45.7 46.2 With RMB 37.6 38.3 37.9 37.2 36.7 36.2 35.7 35.3 35.0 S2 Without RMB 41.9 41.6 41.5 41.2 41.1 41.1 41 40.9 40.8 With RMB 37.6 37.2 35.2 33,1 30.9 28.9 26.9 25,1 23.2 Euro S1 Without RMB 37.4 37.8 37.4 37.0 36.5 36.0 35.5 35.1 34.8 With RMB 33.4 32.2 30.8 29.4 27.8 26.3 25.1 24.1 23.3 S2 Without RMB 37.4 38.3 38.1 38.1 37.9 37.6 37.5 37.4 37.3 With RMB 33.4 32.4 30.7 28.8 26.9 25.1 23.5 22.1 21.0 Yen S1 Without RMB 9.4 9.3 9.4 9.5 9.5 9.6 9.6 9.6 9.5 With RMB 8.4 7.7 7.5 7.2 6.9 6.6 6.3 6.1 6.0 S2 Without RMB 9.4 9.7 10.0 10.3 10.7 11 11.3 11.5 11.7 With RMB 8.4 8 7.8 7.6 7.4 7.1 6.9 6.7 6.6 British pound S1 Without RMB 11.3 10.4 10.3 10.2 10.0 9.9 9.7 9.6 9.5 With RMB 10.1 8.7 8.3 7.8 7.3 6.9 6.5 6.2 6.0 S2 Without RMB 11.3 10.4 10.4 10.4 10.3 10.3 10.2 10.2 10.2 With RMB 10.1 8.6 8.2 7.7 7.2 6.7 6.3 6 5.7 Renminbi S1 Without RMB … … … … With RMB 10.5 13.1 15.5 18.4 21.3 24 26.4 28.3 29.9 S2 Without RMB … … … … With RMB 10.5 13.8 18.1 22.8 27.6 32.2 36.4 40.1 43.5 TOTAL S1 Without RMB 100 100 100 100 100 100 100 100 100 With RMB 100 100 100 100 100 100 100 100 100 S2 Without RMB 100 100 100 100 100 100 100 100 100 With RMB 100 100 100 100 100 100 100 100 100
4. Implications for the stability of the SDR
One guiding criterion for reconsidering the composition of the SDR is the stability of the basket in terms of the major currencies. Two concepts are successively studied here: short-run volatility, and exchange-rate misalignments.
4.1 Shor t-ter m volatility
Short-term volatility is measured here as the standard deviation of monthly exchange-rate variations over each five-year period following each review period:13
∑
+ + = − − − − = 60 1 2 , 1 , 1 , , , 59 1 T T t SDR H i SDR t i SDR t i SDR t i H i g E E E SD where∑
+ + = − − − = 60 1 , 1 1 , , , 59 1 T T t SDR t i SDR t i SDR t i SDR H i E E E g (6)Figure 3 shows the change in volatility when moving from a four- to a five-currency SDR, i.e. when including the renminbi in the basket, over 2001-05 and 2006-10. All exchange rates against the SDR are calculated based on the currency weights reported in Table 1. The results are consistent in the two periods: including the yuan in the SDR basket reduces the volatility of the SDR against the dollar and the yuan itself, but it raises its volatility against the euro and the pound, and leaves the volatility against the yen roughly unchanged. The peg of the yuan on the dollar explains these results. The impact of the renminbi inclusion on the volatility of the SDR against the euro and the pound however remains limited – less than five percent - due to the limited weight of the Chinese currency in the basket.
13
Each period H corresponds the five years (60 months) following each review year T. The results are qualitatively unchanged with other measures of short-term exchange-rate volatility.
Figure 3. Change in volatility when including the RMB in the SDR (percentage change compared to the volatility against the present SDR basket,
over each period)
Source: own calculations.
The impact of RMB inclusion in the basket on third currencies is reported in Appendix A. Strikingly, RMB inclusion reduces the volatility of the SDR basket against all third currencies under review. Not surprisingly, the more the currency is pegged on the US dollar (hence also de facto on the RMB), the stronger the volatility is reduced.
It is now possible to study the possible impact of RMB inclusion on the volatility of the basket in the next coming decades, based on the weighting projections of Section 3 and on a number of assumptions concerning the volatility of the Chinese currency. Denoting by giSDR,t
the exchange-rate variation (in percent) of currency i against the SDR between the t-1th and
∑
∑
= − = − − − − = − = N j i t j j N j i t j i t j j i t SDR i t SDR i t SDR i t SDR E E E E E E g 1 1 , 1 1 , , 1 , 1 , , , ) ( α α (7)where αj, is the currency amount of currency j. Equation (7) can be re-written as:
∑
∑
∑
∑
= = − − = − = − − − − ≈ − = N j i Jan j j N j i t j i t j i t j i Jan j j N j i t j T j N j i t j i t j i t j i t j j i t SDR E E E E E E E E E E g 1 1 , 1 , 1 1 , , 1 , 1 1 , , 1 , 1 1 , , 1 , , α α α α (8) where i Jan jE ,1 is the exchange rate of currency j in terms of currency i on the first day of the period considered (H). Noting that i
Jan SDR j i Jan j j Jan SDR j i Jan j jE ,1 =w E ,1 E ,1 =w E ,1 α , Equation (8) writes:. i t j N j j N j i t j i t j i t j j N j i Jan SDR j N j i t j i t j i t j i Jan SDR j i t SDR w g E E E w E w E E E E w g , 1 1 , 1 1 , , 1 1 , 1 , 1 1 , , 1 , ,
∑
∑
∑
∑
= = − − = = − − = − = − ≈(9)
From Equation (9) the variance of each currency i against the SDR, over period H can be derived:
∑
∑
∑
≤ < ≤ = = + = = N j j H i j i j H j H j H i j N j H j H i j N j H j H iSDR Var w g w Var g w w Cov g g
g Var ' 1 ' ,' , 1 2 , 1 , ( ) 2 ( ; ) ) ( (10)
where Cov denotes the covariance. Two alternative, polar scenarios are investigated based on observed variances and covariances over the 1999-2009 period:
• Peg: the renminbi is supposed to be pegged to the dollar. Its volatility against the dollar is zero; that against the others currencies is equal to that of the dollar against the
same currency; finally, all covariances involving the RMB/USD exchange rate are zero and each covariance involving the RMB/i exchange rates is equal to the corresponding covariance involving the USD/i exchange rate.
• Float: the renminbi is assumed to float freely. Its variance against each currency i is assumed identical to the average variance of the three other currencies against the same currency i; and the covariances of each RMB/i exchange rate are assumed to be averages of the two covariances of j/i, with j≠RMB, i. 14
The variance-covariance matrices used in both scenarios are reported in Appendix B, together with the observed variance-covariance matrix over 1999-2009.
Figure 4 shows the change in volatility in the future when moving from a four to a five-currency SDR, i.e. from including the renminbi in the basket, using the weights given by Table 2. For each scenario (peg, float), the volatility of the SDR basket vis-à-vis the five currencies is compared whether the renminbi is included or not in the basket.
14
The float assumptions are based on the observation that free floating currencies display surprisingly stable monthly volatility across currencies and across time (see Mussa, 2000).
Figure 4 Change in volatility when including the renminbi in the SDR in each scenario (in percent)
a. peg
b. float
When the renminbi is supposed to stay pegged to the US dollar (scenario 1), the results are similar qualitatively as those depicted in Figure 3 for the 2006-10 period: including the Chinese currency in the basket reduces the volatility of the SDR against both the dollar and the renminbi, raises the volatility of the SDR against the euro and the pound and leaves that against the yen roughly unchanged. Not surprisingly, the impact of RMB inclusion increases over time, in line with the rising weight of the Chinese currency in the basket. For instance, over the 2026-30 period, RMB inclusion raises the volatility of the SDR against the euro by 20 percent, against less than 5 percent over 2006-10.
If the renminbi is allowed to float, and given our assumptions concerning its volatility against the other currencies of the basket, its inclusion in the SDR raises the volatility of the latter against every currency but the RMB itself. However, the magnification of volatility is now much more limited than in the peg scenario. For instance, over the 2026-30 period, the volatility of the SDR against the euro is increased by only 5 percent. Like in the previous case, though, the magnification of volatility increases along the rise in the weight of the RMB in the basket.
Three conclusions may be drawn from this analysis. First, as long as many currencies are de jure or de facto pegged to the dollar and the RMB itself is pegged to the US currency, the inclusion of the RMB in the SDR basket mechanically reduces the volatility of the latter against many currencies, including the RMB and the dollar themselves. Second, the impact of RMB inclusion on the volatility of the SDR is limited in the short run but much more
benign impact on the volatility of the latter if the RMB is no longer pegged on the dollar. On the whole, SDR broadening would reduce the volatility of the basket against many currencies, with the major exceptions of the euro and the pound. Waiting until the RMB is made more flexible would have ambiguous effect on volatility: on the one hand, a floating RMB would have less impact on the volatility of the basket; on the other hand, waiting more would imply a higher weight by the time of RMB inclusion.15
4.2. Misalignments
A desirable feature of the SDR basket is also long-run stability: the SDR should not display a trend of appreciation or depreciation against the main currencies of the international monetary system. One way to study this second aspect of stability is to analyze possible misalignments of the SDR, misalignments being defined as deviations of the exchange rate from its
equilibrium level. Here, a simple, Balassa-Samuelson benchmark is used for equilibrium exchange rates.16 Accordingly, the real exchange rate between currencies i and j at time t,
i t j
RER, , depends on the productivity differential which is generally proxied by the relative GDP per capita in PPP between i and j, GDPcapij,t:
i t j i i t j a b GDPCAP RER , ln , ln = + (11)
Where ai are random country effects and b is expected to be positive. The estimation is run for
a panel of 128 countries over the period 1980 to 2009, with the United States as the reference
15
Such discontinuity could possibly be avoided by changing the weighting methodology, e.g. by including FX turnover in the weighing scheme, see Newham et al. (2011).
16
It is more appropriate than purchasing power parity for an emerging country like China where productivity is still much lower than in advanced economies.
country (j=US) (see Appendix C). The estimated coefficient is bˆ=0.23: a 10 percent increase in GDP per capita relative to the US involves a real exchange-rate appreciation of 2.3 percent against the dollar. Then, the real equilibrium exchange rate can be recovered of each country i against the SDR as follows:
∑
= = N j t j j i t i t SDR RER w RER R E R 1 $ , $, , ˆ ˆ ˆ (12) with it t US i GDPcap GDPcap b a c i t e R E R , , ln ˆ ˆ ˆ $, ˆ = + + and j t t j R E R R E R $, $ , ˆ 1 ˆ = .Finally, the misalignment of the SDR/i exchange rate in terms of the Balassa-Samuelson benchmark can be defined as:
i t SDR i t SDR i t SDR i t SDR R E R R E R RER M , , , , ˆ ˆ ˆ = − (13)
Figure 5 compares the misalignment obtained whether the RMB is included or not in the SDR basket. Although the RMB is found undervalued by up to 20 percent against the SDR, its inclusion in the SDR basket has negligible impact on other misalignments. However it should be kept in mind that the equilibrium exchange rate of the renminbi is to appreciate over time. This suggests an important argument in favor of the inclusion of the RMB in the basket: to the extent that the value of the SDR should remain stable over the long run, it would be advisable to balance its composition between, on the one hand, the currencies of advanced economies,
that are likely to depreciate in real effective terms over the long term, and that of a large, emerging country that is bound to appreciate in relation with the Balassa-Samuelson effect17
Figure 5. Misalignments relative to a Balassa-Samuelson benchmark, in percent
Solid line: RMB out of SDR; Dotted line: RMB in SDR
RMB/SDR USD/SDR
Reading: a positive figure points to an overvaluation of the SDR.
Source: own calculations.
5. Implications for the SDR inter est r ate
The low interest rate paid by deficit countries for liquidity in SDR has sometimes been view as a key feature of this system.18 It is possible to investigate the impact of the inclusion of the RMB on the interest rate of the SDR, which is a weighted average of the 3-month benchmark interest rates of the basket currencies:
∑
= = N j t j SDR t j T j t SDR E i i 1 , , , , α (14) 17This line of reasoning is strengthened when considering the cumulated deficits of the United States, one major counterpart being China’s cumulated surpluses.
18
where αj,TESDRj,t is the effective weight of currency j at date t, and ij,t is the short-term interest
rate in country (or currency zone) j. Equation (14) can be used to compare the SDR interest rate with and without the RMB in the basket. Three-month interest rates are taken from the IFS (IMF) for the United-States, the Euro area, Japan and the United-Kingdom. For China, two alternative measures of the interest rate are used. The first one is the three-month central-bank bills from Datastream.19 It can be argued however that interest rates have been
maintained artificially low in China thanks to capital controls and banking regulations. Hence nominal GDP growth is used as an alternative proxy for the Chinese interest rate.20 The results are depicted in Figure 6. The impact of renminbi inclusion on the interest rate of the SDR is discernible only with the second proxy of the Chinese interest rate (golden rule). The impact picks at one percentage point in the recent period, in line with high observed nominal growth in China. Looking forward, the rise in Chinese share in the SDR could further raise the interest rate of the SDR. However China’s GDP growth is likely to slow down in the coming decades. The net effect is likely to be neutral: with a 10% share in the SDR basket in 2010, a 10% real growth rate in China (compared with 2% in advanced economies) raises the real interest rate of the basket by 0.8 percentage point. At the 2030 horizon, the share of China could increase up to 27% (see Table 2), but the real growth rate would be halved (Fouré et al., 2010; World Bank, 2012). Assuming advanced economies still enjoy a 2% real growth rate, the impact of renminbi inclusion on the SDR interest rate would be 27×3%=0.8 percentage point, hence the same as in 2010.
19
Supplemented the PBoC bill series available before 2003 with the discount rate/bank rate series from the IMF.
20
Figure 6. SDR Interest rate with and without the RMB (in percentage points)
Source : own calculations.
6. Conclusion
In the perspective of the reform of the IMS, the inclusion of the renminbi in the SDR is mainly motivated by two objectives: enhancing the attractiveness of the SDR both as a reserve asset and as a unit of account, and strengthening international monetary cooperation. Regarding the first objective (the focus of this paper), the inclusion of the renminbi can be assessed according to the broad principles guiding SDR valuation decisions:21
representativeness, and stability of the composition and value of the basket. Although tentative, our results suggest several conclusions:
21
First, the inclusion of the renminbi in the SDR would make the basket more representative of the structure of world trade, thus improving the legitimacy of the basket. Although the renminbi is not yet widely used in current and financial transactions, it can be expected to meet this requirement in the medium run.
Second, had the renminbi be included in the SDR basket during the 1990s and 2000s, its weight would have been limited (less than ten percent). However, under basic assumptions concerning the future evolution of global trade and the distribution of foreign-exchange reserves, the renminbi could become the first or second currency of the basket by 2040. Waiting too much before including the RMB in the basket (because it is not yet freely usable) would incur the risk of a significant discontinuity in the SDR behavior when the inclusion is eventually decided.
Third, the impact, of RMB inclusion on SDR volatility will crucially depend on China’s exchange-rate regime: assuming the RMB is pegged to the dollar, the volatility of the SDR vis-à-vis the euro and the pound would rise very significantly over the next decades, whereas it would be reduced against the US dollar, the renminbi and a number of third currencies. Conversely, should the yuan be allowed to float, the impact on the volatility of the SDR would be much more limited. These results are strong arguments in favor of postponing RMB inclusion until it is made flexible and. However, it should be kept in mind that waiting too much would introduce a discontinuity on the behavior of the SDR because the new currency would immediately be attributed a large weight. Additionally, having the yuan in the SDR would counterbalance a depreciating trend of the SDR in real effective terms related to the
Balassa-Samuelson and to cumulated deficits in the United States (the USD representing 42 percent of the basket). Indeed, China is likely to experience strong real exchange-rate
appreciation in the future in relation to the Balassa-Samuelson effect and/or to current account adjustment. This feature could raise the attractiveness of the SDR as a store of value.
Meanwhile, net debtor countries would not suffer from a large increase in the SDR interest rate.
Including the RMB in the SDR relatively rapidly would bring advantages in terms of
representativeness and stability of the composition and of the value of the basket, especially if China’s exchange rate regime is made more flexible. This issue of flexibility is de facto more important than that of free usability to make the SDR more stable, at least in the short and medium run.
REFERENCES
Angeloni, Ignazio, Bénassy-Quéré, Agnès, Carton, Benjamin, Darvas, Zzolt, Destais,
Christophe, Pisani-Ferry, Jean, Sapir, André, and Shahin Vallée, 2011, “Global currencies for tomorrow: a European perspective”, Bruegel Blueprint 13/CEPII Research Report 2011-01, July.
Bénassy-Quéré, Agnès, and Jean Pisani-Ferry, 2011, “What international monetary system for a fast-changing world economy?”, in Reform of the International Monetary System – The Palais-Royal Initiative, ed. by Jack T. Boorman and André Icard (SAGE).
Clark, Peter B., and Jacques J. Polak, 2002, “International Liquidity and the Role of the SDR in the International Monetary System”, IMF Working Paper 02/217, Washington, DC.
Fouré, Jean, Bénassy-Quéré, Agnès, and Lionel Fontagné, 2010, “The World Economy in 2050: a Tentative Picture”, Working Paper, CEPII, No 2010-27 December.
International Monetary Fund, 1944, Articles of agreement, Washington, DC
International Monetary Fund, 2005, “Review of the Method of Valuation of the SDR”, Finance Department, Washington, DC, October 28.
International Monetary Fund, 2010, “Review of the Method of Valuation of the SDR”, Finance Department, Washington, DC, October 26.
International Monetary Fund, 2011, “Enhancing International Monetary Stability—A Role for the SDR?”, Strategy, Policy, and Review Department, Washington, DC.
Julius, DeAnne, 2010. “A roadmap for SDR evolution”, in Beyond the Dollar: Rethinking the International Monetary System, ed. by Paola Subacchi and John Driffill, (London, Chatham House).
Mussa, Michael, 2000, “The relationship between the euro and the dollar”, Journal of Policy Modelling, 22 (3), 369-77.
Newnham, Stewart, Chong, Yee Wai, and Qing Wang (2011), “CNY: Exploring the RMB’s Inclusion in the SDR Basket” Morgan Stanley Research.
Palais-Royal Initiative, 2011, “Reform of the international monetary system: a cooperative approach for the twenty first century”, Final report of a group convened by Michel
Camdessus, Alexandre Lamfalussy and Tommaso Padoa-Schioppa.
Pedroni, Peter, 2004, “Panel cointegration; Asymptotic and finite sample properties of pooled time series test, with an application to the PPP Hypothesis”, Econometric Theory, 20 (3), 597-625.
Qiao, Yide, and Mingqi Xu, 2011, “Enhancing the status and role of SDRs in the international monetary system”, SDRF Series Research Report, Shanghai Development Research
Foundation, March.
Stiglitz Commission, 2009, “Report of the Commission of experts of the president of the United Nations General Assembly on reforms of the international monetary system”, United Nations: New York, September.
World Bank, 2012, “China 2030: building a modern, harmonious and creative high-income society”, Conference edition.
Appendix A
Implications of RMB inclusion in the SDR for third currencies
Table A.1 reports the impact of RMB inclusion in the SDR for the volatility of third
currencies. It suggests that the inclusion of the renminbi in the SDR would have reduced the volatility of the SDR basket against the various non-SDR currencies in the 1990s and 2000s. At first sight, this is obvious as the inclusion of a new currency in a basket mechanically stabilizes the basket against non-member currencies. However, one must keep in mind the fact that the renminbi is highly correlated to the US dollar, therefore its inclusion could potentially destabilize the i/SDR exchange rate when i is not correlated to the US dollar. The table shows that those currencies closest to the US dollar (the HK dollar, and Saudi riyal) are those benefiting from the highest decline in volatility following RMB inclusion in the basket.
Table A.1. Change in the standard deviation of exchange rate variation after the inclusion of the renminbi, in percent
1991-1995 1995-1998 1999-2000 2001-2005 2006-2010 Australian dollar -1.1 -1.1 -0.7 -0.6 -1.0 Brazilian real - -1.7 0.0 -0.6 -0.7 Canadian dollar -1.3 -2.0 -1.6 -1.6 -1.8 HK dollar -1.8 -3.6 -3.9 -4.5 -6.0 Indian rupee -0.3 -0.8 -1.8 -2.8 -2.4 Korean won -1.8 -0.1 -0.4 -1.2 -1.1 Malaysian ringgit -1.5 -0.7 -0.3 -4.5 -3.5 Mexican peso -0.5 -0.3 -0.7 -1.4 -1.1 Russian rubble - - -0.1 -2.8 -1.2 Saudi riyal -1.8 -3.6 -3.9 -4.5 -6.3 Singaporean dollar -1.6 -1.5 -0.7 -2.3 -3.3 Swiss franc -0.6 -0.4 -0.2 -0.9 -1.9
Source: own calculations
Appendix B
Variance-covariance matrices over the 1999-2009 period and in each scenario
Table B.1. The observed variance-covariance matrix over the 1999-2009 period
$/€ £/€ ¥ /€ RMB /€ ¥/ $ $/£ RMB/$ ¥/ £ RMB/£ ¥/ RMB $/€ 6.70 2.19 4.50 6.53 -1.93 4.33 -0.17 2.29 4.33 -1.86 £/€ 2.19 3.34 1.10 2.03 -1.00 -1.09 -0.11 -2.13 -1.30 -1.06 ¥/€ 4.50 1.10 8.15 4.51 3.74 3.34 -0.08 6.91 3.43 3.56 RMB/€ 6.53 2.03 4.51 6.54 -1.84 4.41 -0.04 2.46 4.40 -1.88 ¥ / $ -1.93 -1.00 3.74 -1.84 5.77 -0.92 0.07 4.67 -0.83 5.43 $/£ 4.33 -1.09 3.34 4.41 -0.92 5.48 -0.04 4.37 5.55 -0.79 RMB/$ -0.17 -0.11 -0.08 -0.04 0.07 -0.04 0.11 0.03 0.06 -0.02 ¥ / £ 2.29 -2.13 6.91 2.46 4.67 4.37 0.03 8.99 4.67 4.55 RMB/£ 4.33 -1.30 3.43 4.40 -0.83 5.55 0.06 4.67 5.65 -0.88 ¥/ -1.86 -1.06 3.56 -1.88 5.43 -0.79 -0.02 4.55 -0.88 5.50
Source: own calculations based on Eurostat and Bank of England data.
Table B.2. The variance-covariance matrix under Scenario S1 (peg)
$/€ £/€ ¥ /€ RMB /€ ¥/ $ $/£ RMB/$ ¥/ £ RMB/£ ¥/ RMB $/€ 6.70 2.19 4.50 6.70 -1.93 4.33 0.00 2.29 4.33 -1.93 £/€ 2.19 3.34 1.10 2.19 -1.00 -1.09 0.00 -2.13 -1.09 -1.00 ¥/€ 4.50 1.10 8.15 4.50 3.74 3.34 0.00 6.91 3.34 3.74 RMB/€ 6.70 2.19 4.50 6.70 -1.93 4.33 0.00 2.29 4.33 -1.86 ¥ / $ -1.93 -1.00 3.74 -1.93 5.77 -0.92 0.00 4.67 -0.92 5.77 $/£ 4.33 -1.09 3.34 4.33 -0.92 5.48 0.00 4.37 5.48 -0.92 RMB/$ 0.00 0.00 0.00 0.00 0.00 0.00 0.00 0.00 0.00 0.00 ¥ / £ 2.29 -2.13 6.91 2.29 4.67 4.37 0.00 8.99 4.37 4.67 RMB/£ 4.33 -1.09 3.34 4.33 -0.92 5.48 0.00 4.37 5.48 -0.83 ¥/ RMB -1.93 -1.00 3.74 -1.86 5.77 -0.92 0.00 4.67 -0.83 5.77
Source: own calculations.
Table B.3. The variance-covariance matrix under Scenario S2 (float)
$/€ £/€ ¥ /€ RMB /€ ¥/ $ $/£ RMB/$ ¥/ £ RMB/ ¥/ $/€ 6.70 2.19 4.50 3.34 -1.93 4.33 -3.13 2.29 - - £/€ 2.19 3.34 1.10 1.65 1.00 -1.09 - -2.13 -1.61 - ¥/€ 4.50 1.10 8.15 2.80 3.74 3.34 - 6.91 - 5.32 RMB/ 3.34 1.65 2.80 6.06 - - -1.56 - 1.30 1.69 ¥ / $ -1.93 1.00 3.74 - 5.77 -0.92 1.43 4.67 - 4.20 $/£ 4.33 -1.09 3.34 - -0.92 5.48 -2.63 4.37 2.73 - RMB/ -3.13 - - -1.56 1.43 -2.63 5.98 - -0.64 -0.41 ¥ / £ 2.29 -2.13 6.91 - 4.67 4.37 - 8.99 3.25 5.79 RMB/ - -1.61 - 1.30 - 2.73 -0.64 3.25 5.93 2.55 ¥/ - - 5.32 1.69 4.20 - -0.41 5.79 2.55 7.64
Appendix C
Estimating the Balassa-Samuelson effect
The following, long-run relationship needs to be estimated:
t i i US i i t a b GDPCAP u RER$, ln , ln = + + (C.1) i t
RER$, is the real exchange rate of country i against the dollar in year t (relative price of US goods), and GDPCAPUSi is the ratio of GDP per capita in PPP in country i relative to the US.
The real exchange rate is recovered by dividing the PPP conversion factor of the World Bank by the observed nominal exchange rate. The sample is composed of 128 countries over the period 1980 to 2009.
The stationarity of the series is investigated through various panel unit root tests and conclude that the series are I(1).22 The seven panel cointegration tests proposed by Pedroni are
subsequently carried out (see Table C.1). At the 5% confidence level, five tests out of seven reject the null hypothesis of no cointegration. It can then be concluded that the two variables are cointegrated. The cointegration vector is ultimately estimated with random effects23 (see Table C.2). The hypothesis of equality for the constants is rejected.
22
The results of the panel unit root tests are available from the authors.
23
Table C.1. Panel cointegration tests
Stat name H0 H1 Stat p-value 5% 1%
Panel v-Statistic No cointegration Common AR coeffs -122.4262 1.0000 √ √ Panel rho-Statistic No cointegration Common AR coeffs -2.675203 0.0037 X √ Panel PP-Statistic No cointegration Common AR coeffs -6.700647 0.0000 X X Panel ADF-Statistic No cointegration Common AR coeffs -7.606954 0.0000 X X Group rho-Statistic No cointegration Individual AR coeffs 0.478826 0.6840 √ √ Group PP-Statistic No cointegration Individual AR coeffs -5.20037 0.0000 X X Group ADF-Statistic No cointegration Individual AR coeffs -4.663506 0.0000 X X
Source: own calculations.
Table C.2. Estimation of the long-run relationship
Variable Coefficient Std Error t-Statistic Prob ln(GDPCAPUSi) 0.2324 0.0128 18.1360 0.0000
Constant -0.1306 0.0332 -3.9336 0.0001